RESEARCH ARTICLE
Use of multiple traits genomic prediction,
genotype by environment interactions and
spatial effect to improve prediction accuracy
in yield data
Hsin-Yuan Tsai1,2*, Fabio Cericola3, Vahid Edriss4, Jeppe Reitan Andersen4, Jihad OrabiID4, Jens Due Jensen4, Ahmed Jahoor4,5, Luc Janss1, Just Jensen1
1 Center for Quantitative Genetics and Genomics, Aarhus University, Tjele, Denmark, 2 Department of
Marine Biotechnology and Resources, National Sun Yat-Sen University, Kaohsiung, Taiwan, 3 Rijk Zwaan, De Lier, Netherlands, 4 Nordic Seed, Galten, Denmark, 5 Department of Plant Breeding, Swedish University of Agricultural Sciences, Alnarp, Sweden
Abstract
Genomic selection has been extensively implemented in plant breeding schemes. Genomic selection incorporates dense genome-wide markers to predict the breeding values for important traits based on information from genotype and phenotype records on traits of interest in a reference population. To date, most relevant investigations have been per-formed using single trait genomic prediction models (STGP). However, records for several traits at once are usually documented for breeding lines in commercial breeding programs. By incorporating benefits from genetic characterizations of correlated phenotypes, multiple trait genomic prediction (MTGP) may be a useful tool for improving prediction accuracy in genetic evaluations. The objective of this study was to test whether the use of MTGP and including proper modeling of spatial effects can improve the prediction accuracy of breeding values in commercial barley and wheat breeding lines. We genotyped 1,317 spring barley and 1,325 winter wheat lines from a commercial breeding program with the Illumina 9K bar-ley and 15K wheat SNP-chip (respectively) and phenotyped them across multiple years and locations. Results showed that the MTGP approach increased correlations between future performance and estimated breeding value of yields by 7% in barley and by 57% in wheat relative to using the STGP approach for each trait individually. Analyses combining genomic data, pedigree information, and proper modeling of spatial effects further increased the pre-diction accuracy by 4% in barley and 3% in wheat relative to the model using genomic rela-tionships only. The prediction accuracy for yield in wheat and barley yield trait breeding, were improved by combining MTGP and spatial effects in the model.
Introduction
Wheat (Triticum aestivumL.) and barley (Hordeum vulgareL.) are two of the earliest domesti-cated crop species and are ranked as the first and fourth most-grown cereals worldwide, respectively [1–4]. Approximately 75% of barley’s global production is used as an ingredient in a1111111111 a1111111111 a1111111111 a1111111111 a1111111111 OPEN ACCESS
Citation: Tsai H-Y, Cericola F, Edriss V, Andersen
JR, Orabi J, Jensen JD, et al. (2020) Use of multiple traits genomic prediction, genotype by environment interactions and spatial effect to improve prediction accuracy in yield data. PLoS ONE 15(5): e0232665.https://doi.org/10.1371/ journal.pone.0232665
Editor: Aimin Zhang, Institute of Genetics and
Developmental Biology Chinese Academy of Sciences, CHINA
Received: June 14, 2019 Accepted: April 20, 2020 Published: May 13, 2020
Copyright:©2020 Tsai et al. This is an open access article distributed under the terms of the
Creative Commons Attribution License, which permits unrestricted use, distribution, and reproduction in any medium, provided the original author and source are credited.
Data Availability Statement: All genotyping data
used in the study with direct runnable format is provided in the supporting information. All phenotype collection is given in the supporting information.
Funding: This study was funded by Danish Green
Development and Demonstration Program (Grant No. 34009-12-0511) from the Danish Ministry of Food and Agriculture, and Nordic Seed A/S. In this
animal feed with the remaining 25% used for alcoholic and non-alcoholic beverages and a vari-ety of other foodstuffs. Due to barley’s diploid genome architecture and its ability to self-fertil-ize, barley is considered an ideal model species for cereal genetic research [5]. Most wheat varieties are tetraploid (durum) or hexaploid (bread), but a few diploid varieties also exist. Due to their importance in food production, a high quality assembly of the entire genome sequence for barley is publicly available [1]. In contrast, the first genome assembly for wheat became available only recently [4], enhancing the opportunities for plant breeders to advance genome-assisted crop improvements and discover quantitative trait loci (QTLs) of commercial interest.
Previous researchers have indicated that most traits of commercial importance in barley and wheat (e.g., yield) can likely be explained by many QTLs, each of which provide small con-tributions to total genetic variance [6,7]. This architecture has significantly restricted the appli-cation of traditional marker-assisted selection techniques, particularly for economically important traits with a highly polygenic architecture. The concept of genomic selection (GS) proposed by Meuwissen et al. [8] was developed to incorporate whole-genome marker data in selection programs to accumulate single nucleotide polymorphisms (SNP) or haplotype effects that can accurately predict future performance of potential new lines. As such, genomic pre-diction (GP) is now utilized to predict the breeding values of individuals based on a sufficient number of molecular markers and a training population (TP) that is genotyped and pheno-typed for traits of interest. The performances of phenotypes in a validated population (VP) can then be predicted by exploiting dense molecular markers (or QTLs) that are associated with traits in the TP. For commercial breeding programs, large scale phenotyping and genotyping of breeding lines in the TP can lead to the development of promising statistical models for var-iance component estimation and for predicting breeding values using established approaches (e.g., REML [9] and BLUP [10]). In contrast to animal breeding approaches, the utilization of genomic approaches in plant breeding has been developed only recently [11].
Several methods in statistical genetics have been developed that benefit from genetic corre-lations between traits [12–14]. Univariate analysis, also known as single trait genomic predic-tion (STGP), is currently the most common method used in plant breeding schemes (e.g., in cassava [15], wheat [16–18], barley [19], rye [20], and rice [21]). However, for most commer-cial plant breeding programs, breeders have collected data on several phenotypes, which enable them to take advantage of genetic and phenotypic correlations among traits. Such multiple trait genomic prediction (MTGP) methods have recently been extensively examined [15,17,18,22,23].
The MTGP approach was originally developed to exploit information gained from corre-lated indicator traits [13]. Results have generally indicated that MTGP can increase the accu-racy of genetic evaluations, especially when traits with high genetic correlations are involved in the analyses [13,15,17,20,22–24]. These findings agree with expected advantages of indirect selection [25]. Compared with traditional pedigree-based breeding methods and STGP, MTGP will likely be able to provide an ideal alternative for characterizing a higher number of candidate genes for selection and at lower cost, especially for traits that are labor intensive to evaluate or require a long time before they are expressed (e.g., baking quality or resistance to pests).
For several economic traits of spring wheat, studies have shown that correlations between observed phenotypes and estimated breeding values are higher when the genomic prediction model involves both genomic and pedigree information than when pedigree alone is used [26]. In general, commercial plant breeders usually have phenotypic records across multiple generations for traits of economic importance. In this study, we used data from multiple plots of F5generations and analyzed those results jointly with records from replicated experiments of F6generations from a variety of field locations. Because testing conditions are not
study, the funding was used by the university partner - Aarhus University. The funders had no role in study design, data collection and analysis, decision to publish, or preparation of the manuscript.
Competing interests: The authors of this paper
have the journal’s policy, and have the following competing interests: One of the authors, FC was a researcher in Aarhus University, when this study was ongoing, and is now affiliated with Rijk Zwaan (Netherlands) (https://www.rijkzwaan.com/). JRA, JO, JDJ, and AJ are paid employees of Nordic Seed. There are no patents, products in
development or marketed products associated with this research to declare. This does not alter our adherence to PLOS ONE policies on sharing data and materials.
Abbreviations: BLUP, Best linear unbiased
prediction; GP, Genomic prediction; GS, Genomic selection; LD, Linkage disequilibrium; MAS, Marker-assisted selection; MT, Multiple trait; MTGP, Multiple trait genomic prediction; QTL, Quantitative trait loci; SNP, Single nucleotide polymorphism; ST, Single trait; STGP, Single trait genomic prediction; TP, Training population; VP, Validation population.
necessarily identical for each generation, it may be necessary to treat records from different generations as being different, but correlated traits. This approach might considerably increase selection accuracy and further increase the genetic gain achieved per generation [15,17].
The major aims of this study were to: (1) compare the predictive ability for both genomic information and spatial effect in breeding lines of winter wheat and spring barley, (2) evaluate the prediction accuracy underlying STGP and MTGP methods, and (3) apply F5and F6data in the MTGP analysis (as multiple training populations) to predict the future yield in breeding lines of winter wheat and spring barley.
Materials and methods
Field experiment and phenotypes
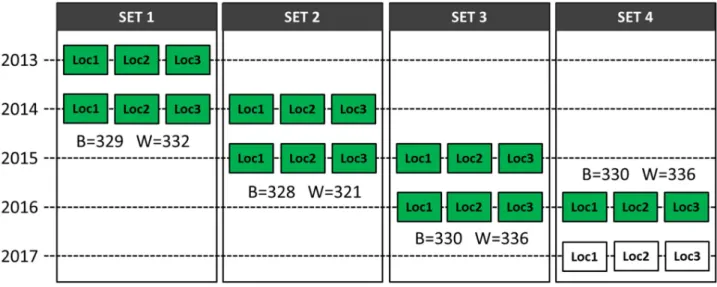
Our field experiment was performed by Nordic Seed A/S (Galten, Denmark). In total, we tested 1,317 spring barley (H.vulgare) and 1,325 winter wheat (T.aestivum) breeding lines. We tested each line in two consecutive years and at three locations every year (Fig 1). The three locations tested were Dyngby, Holeby, and Skive (for first year only) in Denmark.
We nested multiple trials within the three test locations, and tested plots using a random-ized complete block design [27] within each trial and each trial contained the same number of breeding lines. For barley, every trial comprised 22 lines and 3 checks, with 3 replicates in the first year and 2 replicates in the second year. For wheat, every trial had 21 lines and 4 checks, with 2 replicates in each year.
For each trial, lines from any given family were sown in a randomized order, in each repli-cate, next to each other in the field. Based on the size of the family, a trial consisted of one or more families, and if the last family to be sown was more numerous than the remaining avail-able plots, they were sown in the next trial. Therefore, many families had members in at least two different trials. In general, there were 3–5 full-siblings in each trial.
Yield data for the F5and F6generations were collected in this study. Every year, we made a new set of crosses and every set contained approximately 330 unique single seed descent lines
Fig 1. Trial plan of spring barley and winter wheat field growth experiments. ‘B’ is the number of lines in spring barley in each corresponding set and ‘W’ is the number of lines in winter wheat. Each set contains data from two consecutive years. For instance, set 1 contained data from 2013 to 2014, set 2 contained data from 2014 to 2015, and so on. The green box represents data we included in the test, whereas the white box in Set 4 represents data still under collection at time of analysis, and not yet included in the test. The figure was adapted from and originally drawn by Andrea Bellucci (pers. comm.).
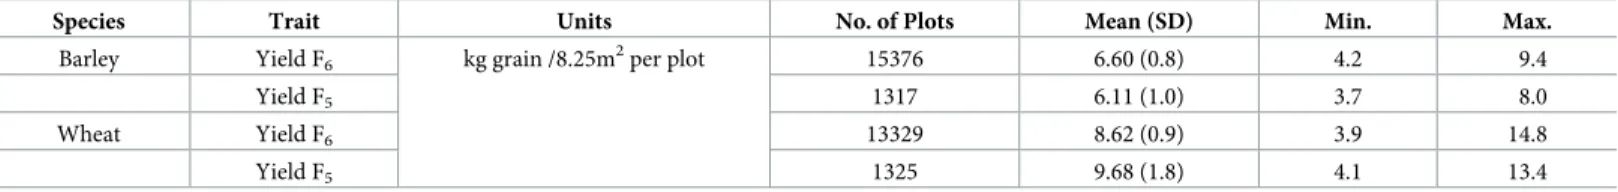
in F5, which were then used to produce the F6line. The number of recorded plots in F6were slightly different in spring barley and winter wheat, as details inTable 1. The yield data were measured as kg grain per 8.25-m2plot in both spring barley and winter wheat breeding lines for F5and F6, respectively.
The phenotypes of trait and pedigree information of every line were recorded by Nordic Seed A/S (Galten, Denmark). The three farms used are owned by Nordic Seed A/S, and they, therefore did not need any further permission to use the land. The three farms are legal for farming use, and not located on any national parks or other protected areas of land or sea.
Genotypes
We used the Illumina 9K barley SNP-chip and the 15K wheat SNP-chip to genotype all breed-ing lines. After quality control procedures, 4,056 SNPs in sprbreed-ing barley and 11,154 SNPs in winter wheat remained for analysis using the following two filters: (1) a minor allele frequency of<0.01 and (2) a missing SNP frequency per line value of>0.02. There were 2,841 SNPs in spring barley and 9,290 SNPs in winter wheat mapped to existing linkage groups according to the genome assembly [1,4], whereas 1,215 SNPs in spring barley and 1,864 SNPs in winter wheat had unknown positions in the genome.
Statistical methods
Pedigree relationship matrices were constructed based on the pedigree information of spring barley and winter wheat using the tabular approach [28,29], which assumed that parental lines have nine cycles of self-fertilization. Genomic relationship matrices (G) were generated for spring barley and winter wheat, using the first method of VanRaden (2008) [30], with G = ZZ’
/ 2∑pj(1-pj), where the matrix Z was calculated as (M–P). M is a matrix of minor allele counts
(0, 1, and 2) withmcolumns (one for each marker) andnrows (one for each line). P is a matrix containing allele frequencies, with columnjdefined as l2(pj−0.5), wherein l is a vector of ones, andpjis the frequency of the second allele at corresponding locusj. After quality con-trol procedures, the percentage of missing values was about 1% for both species in the geno-type file before the genomic relationship matrices were constructed. The mean imputation approach was then applied to assign any missing genotypes [30]. All the missing genotypes were imputed while constructing the genomic relationship matrices. We performed a principle coordinate analysis (PCoA) (Fig 3) on the genomic relationship matrix using the built-in R function [31]. We used univariate and multivariate linear mixed models to obtain REML esti-mates of the variance components of traits using the DMU multivariate mixed model package [32].
Model used for yield traits of F
5and F
6generations
We developed the following models for the analyses. Model1was developed for yield for both F5and F6generations using only genomic information (G). As yield data were both available Table 1. Descriptive statistics for spring barley and winter wheat phenotypic records.
Species Trait Units No. of Plots Mean (SD) Min. Max.
Barley Yield F6 kg grain /8.25m2per plot 15376 6.60 (0.8) 4.2 9.4
Yield F5 1317 6.11 (1.0) 3.7 8.0
Wheat Yield F6 13329 8.62 (0.9) 3.9 14.8
Yield F5 1325 9.68 (1.8) 4.1 13.4
for F5and F6in spring barley and winter wheat, the univariate and multivariate analyses were applied using Model1:
y¼XbþZ1gþe ð1Þ
The b is the fixed factor comprising year, location, and trial (YLT), whereas the g is the genomic information. In addition, to estimate effects from pedigree information and spatial effects, we also developed Model2for F5and F6yields. The b and g terms are described by Model2:
y¼XbþZ1aþZ2gþ
Xn
i¼1Zisþe ð2Þ
where the a term corresponds to additive genetic effects using pedigree information for the covariance structure, the s term is a spatial effect variable to account for local spatial variation of experiments in the field.
For the models described above, where y is a vector of observations for one trait, X is a design matrix for the fixed effect, and the b term is the vector of fixed effects, including com-bined effects of year, location, and trial (YLT). Zncomprises the design matrices of random
effects and the g term is a vector of additive genetic effects withg�Nð0;Gs2
gÞ, whereins 2 g
represents genomic variance and G is the genomic relationship matrix. The distribution of a�Nð0;As2
aÞ, thens 2
arepresents the additive genetic variance and A is the pedigree
relation-ship matrix. The s term is a vector of spatial effect withs�Nð0;Is2
sÞ, which contains the X
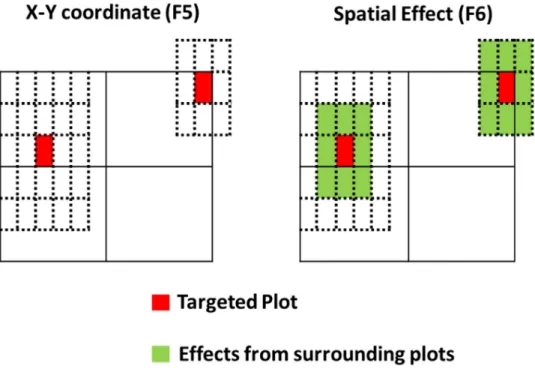
and Y coordinates of plots in the F5test (n = 2), and eight surrounding plots and plot itself in the F6test (n = 9), as illustrated inFig 2. The e term is a vector of random residuals with e�Nð0;Is2
eÞ.
Fig 2. Illustration of spatial effects employed in the F5and F6test. In the F5test, we fitted X- and Y-coordinates as
the spatial effect in the model, whereas for the F6test, we included its eight surrounding plots as well in the spatial
effect (as a moving average). The figure was adapted from and originally drawn by Andrea Bellucci (pers. comm.).
For multivariate analysis, we modeled two traits together to estimate all effects, including the marker effects. The testing combinations are detailed inFig 4. Taking Model1as an exam-ple, y1represents yield for F6and y2represents yield for F5. The year, location, and trial (YLT)
serves as a fixed factor represented by bnin the model. The terms Xnand Znare the designed
matrices of the fixed factor and random factor, respectively. The gnterm is the genomic
infor-mation, as described in the statistical model section. We assumed the residual covariance to be zero because yield in F5and F6generation were statistically independent (as they were col-lected from different years and generations).
y1 y2 " # ¼ X1 0 0 X2 " # b1 b2 " # þ Z1 0 0 Z2 " # g1 g2 " # þ e1 e2 " # ð3Þ where g1 g2 " # �Nð0;G�HÞwithH¼ s 2 g1 sg12 sg12 s 2 g2 " #
, wherein H is the variance and
covari-ance matrix of the genomic breeding values of the two traits, and for e1
e2 " # �Nð0;I�RÞwith R¼ s 2 e1 se12 se12 s 2 e2 " #
, R is the residual variance and covariance matrix of the two traits. Residual co-variance did not exist when we performed yield calculations for F5and F6generations, because the traits were collected from different years. When there were missing data for one of the traits, the residual variance was equal tos2
efor the observed trait.
We used the variances to estimate the heritability of line means. The total phenotypic vari-ance (σ2
p) of line means was: s2 p ¼dðGÞs 2 gþ nss 2 s r1 þs 2 e r2 ð4Þ
Heritability was estimated as:
h2 ¼dðGÞs2 g=s
2
p ð5Þ
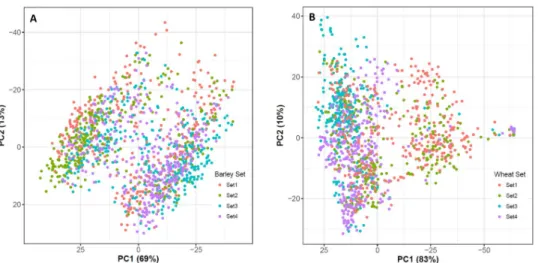
Fig 3. Principal coordinate analysis of (a) spring barley and (b) winter wheat.
where d(G) is the mean diagonal element of the genomic relationship matrix,nsis the number of surrounding plots considered in the spatial effect,rnis the number of replicates of corre-sponding effects for each genotype when estimating line heritability, andrnwas one (1.0) when estimating the narrow-sense plot heritability [33] based on the data of a single plot. The narrow-sense plot heritability was used to consider the random effects from the plot itself, whereas the line heritability was used to calculate the mean of effects from records across all replicates based on the same breeding line [6]. Line heritability is higher than plot heritability when there are more replicates in the experiment.
Fig 4. Comparison of MTGP and STGP approaches for predicting yield in the F6generation of winter wheat and
spring barley. For MTGP, we used a training population, including F5as Trait I, Sets 1, 2, 3 for yield by F6as Trait II,
and Set 4 to predict yield of F6(as a validation population). For STGP, we used Sets 1, 2, and 3 for yield by F6data as
the training population to predict Set 4 for yield by F6(as a validation population). Fig 4c shows the corresponding
models used for MTGP and STGP, respectively. The corresponding models are described in statistical model section in material and methods.
Cross-validation and predictive ability
For our multivariate analysis (MTGP) of the F5and F6yield dataset in particular, we used four sets (Sets 1, 2, 3, and 4) in F5as the first trait, and Sets 1, 2, and 3 in F6as the second trait to pre-dict the yield performance of Set 4 in F6. This strategy helped us test the feasibility of using a multivariate analysis for predicting future traits of interest in the coming year. For univariate analysis (STGP), we used Sets 1, 2, and 3 for yield by F6data as the training population to pre-dict Set 4 for yield by F6(as a validation population). We estimated the predictive ability for future yield performance [ρ(ӯc, gˆ)] by calculating the correlation between the average of
phe-notypic records corrected for the fixed effect (ӯc) and genomic predicted breeding values (gˆ).
The accuracy of predicting additive breeding values we calculated as the predictive ability divided by the square root of heritability of line means:ρ(ӯc, gˆ)/h.
Results
Genomic relationship analysis among breeding lines
The first two principal components of PCoA explained 69% (Axis 1) and 13% (Axis 2) of the total variance in genomic relationships for spring barley, and 83% (Axis 1) and 10% (Axis 2) for winter wheat (Fig 3). In general, most lines were highly genetically associated with others. Based on genomic information, PCoA indicated that there were clearly identifiable groups in spring barley and winter wheat, implying that certain lines were from the same groups. For example, there were some lines from Set 2 segregating in the left area of the PCoA plot in bar-ley, whereas Set 3 also segregated in left area of the PCoA plot in wheat. However, in general, although the PCoA plot showed that there were only two major genetic clusters in both spe-cies, we also found that certain lines came from different crosses, sets, and parents. The heat-map of genomic relationship (using a similar dataset) also highlights the same results for both grain species [6,7].
Descriptive statistics and variance components
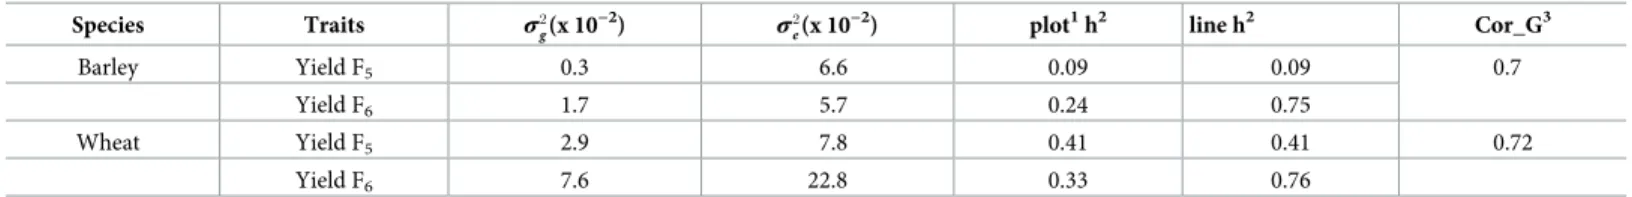
We studied yield traits in spring barley and winter wheat commercial breeding lines. The number of plots and phenotype statistics for each trait are listed inTable 1. The heritability and variance component estimates of traits are given inTable 2. Heritability (using the geno-mic-based method) of yield in F5was 9% for spring barley and 41% for winter wheat, whereas the heritability of yield in F6 was 24% for spring barley, and 33% for winter wheat (Table 2). Table 2. Variance components, narrow-sense plot heritability, and correlation estimation of traits using model1. The column fors2
gands 2 eare given by 10 −2as base unit. Species Traits σ2 g(x 10 −2) σ2 e(x 10
−2) plot1h2 line h2 Cor_G3
Barley Yield F5 0.3 6.6 0.09 0.09 0.7
Yield F6 1.7 5.7 0.24 0.75
Wheat Yield F5 2.9 7.8 0.41 0.41 0.72
Yield F6 7.6 22.8 0.33 0.76
1The plot heritability. For yield F
5, we only have one plot in F5, so rnin the denominator is always one (see Model4) and the plot heritability is equal to line heritability.
For other traits, we have multiple plots from the same breeding line, so we obtained more information based on the same breeding line. Therefore, line heritability is higher than plot heritability. See more descriptions in Model4.
2Line heritability.
3The environmental correlation was set as independent between yield F
6and F5because their records were collected in different years and locations. Therefore, only
genetic correlations (Cor_G) are provided for yield traits.
STGP versus MTGP
For multiple trait analysis, we used yield in F5as the first trait and yield in F6as the second trait to predict the future yield performance for the spring barley and winter wheat breeding lines. Overall, the prediction accuracies of bivariate analyses were higher than for univariate analyses in all scenarios (Fig 4). In using a bivariate analysis, we improved predictive accura-cies by about 7% in spring barley and by about 57% in winter wheat varying from STGP and MTGP. The MTGP model that combined pedigree, the genomic relationship matrix, and spa-tial effects showed higher prediction accuracy than using the genomic relationship matrix only.
Discussion
The goal of this study was to utilize pedigree information, genomic information, and genetic covariance between associated traits to increase the accuracy of prediction of economically important traits in cereal breeding programs. Our main findings were that the prediction accu-racy of yield performance clearly increased when we modeled both yield F5and F6data simul-taneously in the analysis. Furthermore, the prediction accuracy calculated from test data involving both pedigree, genomic and spatial information was clearly higher than data obtained from genomic information.
Genetic correlation is critical for improving accuracy in MTGP
Theoretically, genetic correlation can arise mainly by pleiotropy or, less commonly, by linkage disequilibrium [34]. A high genetic correlation between two traits does not imply that both traits are highly heritable, but neither does a high phenotypic correlation [25]. Several studies using both real and simulated data have suggested that the genetic correlation between geneti-cally-linked traits is important for multivariate genomic selection to be advantageous
[13,15,20,23,25,35]. Therefore, genetic correlations between traits of interest have been recently exploited to increase the statistical power for detecting segregating QTLs [36,37] and to improve accuracy in genomic predictions in plant breeding programs [20,23,35].
To date, there have been only a few published multiple trait studies using field data for plant breeding [15–17,20,23,38]. In a simulation study, Jia and Jannink [23] reported that for two traits with no genetic correlation, the prediction accuracy of STGP was equivalent to or even better than the accuracy of MTGP. In the current study, the genetic correlation between yield in F5and in F6data was approximately 0.7 in both spring barley and winter wheat breed-ing lines. Because we collected phenotypes from different years and locations, the environmen-tal effects on yield in F5and F6were independent. Our results showed that MTGP
outperformed STGP by 7% of yield in spring barley and 57% in winter wheat. A similar improvement rate (60%) using MTGP was also reported from pine breeding data [23]. Nota-bly, the predictive ability for spring barley was generally higher than it was for winter wheat, but the relative improvement was not as dramatic as it was for winter wheat. For winter wheat, the predictive ability for yield was 0.23 for F6generation in our single trait analysis, and 0.37 using yield data from F5and F6generations in the multiple trait analysis. Because the predic-tive ability for spring barley was 0.48 using yield data from F6 with the STGP model, but 0.51 using MTGP, the result clearly shows that, for estimating yield performance, the prediction accuracy of the STGP model for the spring barley line was better than was the MTGP model for the winter wheat breeding lines.
Yield heritability difference between F
5and F
6For spring barley and winter wheat, our results showed that the heritability of yield in F5and F6differed slightly. One reason to cause the differences could be due to the smaller plot size and lower sowing density for F5. In addition, the F5data were tested on one location with one replicate only (compared with F6, there were multiple tested locations and plots), this may cause that the genetic effects included both general additive genetic effects plus specific addi-tive genetic effects due to GxE effect between genotypes and the one location used. These effects cannot be separated for F5data, compared with F6data. As such, the above reason cloud lead to the heritability difference between yield F5and F6.
Genomic information boosts the prediction accuracy
To our knowledge, there are only few major QTLs segregating identified (such as, theMlo
locus), at least for the economically important traits we investigated in this study. A review by Bernardo [39] stated that approximately 10,000 QTLs have been identified by QTL mapping experiments on twelve major crop species. However, only a few QTLs have been exploited in marker-assisted selection in practical breeding schemes, which indicates that most economi-cally important traits in spring barley and winter wheat are highly polygenic in nature. Thus, if sufficient genomic information is available (e.g., segregated SNPs across an entire genome), then genomic predictions can be an efficient tool for capturing genetic variances, much more efficient than relying on pedigree records in plant breeding. Previous studies that applied genomic-based BLUP (GBLUP) approaches show consistent prediction accuracies across vari-ous genetic architectures under simulated scenarios [40]. Additionally, Jia and Jannink [23] indicated that multiple trait GBLUP performed equally as well as Bayesian models (Bayes A and Bayes Cpi) when the traits were controlled by a polygenic genetic architecture. Both authors suggested that BLUP is likely an ideal option for modelling the traits we investigated. In this study, our model involved both genomic and pedigree information, the prediction accuracies were slightly higher than using genomic information only. This result suggests that our evaluation involving pedigree information was less accurate than using a genomic-based method. On the other hand, GBLUP is potentially not as robust as the Bayesian model when there are outliers involved (e.g., the disease traits in spring barley investigated in this study deviated from the normal distribution). The prediction accuracy reported in this study was sufficiently high (e.g., prediction accuracy>0.5) for genomic breeders to make selection deci-sions on favored traits earlier in the breeding cycle, which would enable them to maximize genetic gains [17].
Clear genetic grouping observed in commercial spring barley and winter
wheat breeding lines
Although our principal components analysis (PCoA) indicated that the genetic relationship and degree of variation between all lines in both species we examined differed slightly, the PCoA clearly showed that there were some segregating groups among all breeding lines, thus implying that many lines had strong genomic relationships in certain genetic clusters.
Future perspectives
Simulation studies based on STGP have suggested that when a high SNP marker density is used, a substantial improvement in prediction accuracy can be expected in genomic evalua-tions [41]. Our study used a full set of marker genotypes as well as the total available popula-tion in the MTGP model. However, genotyping cost is still a major concern in plant breeding,
especially for commercial breeders. Therefore, although our approach has been tested using simulation scenarios [13], the effect of marker density and optimization of TP size may require further investigation based on real data. In addition, non-standard phenotypes, such as those obtained from metabolomics data, may assist practitioners in boosting correlations in MTGP. For example, some investigations have involved metabolomics data in multiple trait analyses, aiming to improve accuracy in plant breeding schemes (and in animal breeding) [17,42–45]. Although STGP usually achieves a predictive ability similar to MTGP in some cases (e.g., soy-beans [38], bread wheat [17], durum wheat [18], and African cassava [15]), our study suggests that the predictive ability of certain traits can be improved using MTGP (based on winter wheat and spring barley breeding lines and the large number of lines we included in our study). As such, cereal breeders can apply MTGP, combined with GxE effect, to improve pre-dictive ability for selecting high yielding cultivars with improved resistance and quality by exploiting genetic correlation between the traits.
Conclusion
Our study showed that the MTGP approach is better than STGP for predicting yield traits in spring barley and winter wheat breeding lines when we included yield in F5and yield in F6in the evaluation. We also found that a model fitting pedigree, genomic and spatial information will have better prediction accuracy than using genomic information only. To conclude, pre-diction accuracy clearly increased in both species when we modelled yield data from F5and F6 generations with MTGP, GxE, and spatial effects in the model. Thus, breeders can use the genetic relationship between traits to predict future trait performance, with considerably improved accuracy, by including genetically related traits using multivariate genomic predic-tion approaches.
Supporting information
S1 Data. (GENOTYPE) S2 Data. (YIELD) S3 Data. (PHENOTYPE) S4 Data. (GENOTYPE) S5 Data. (R) S6 Data. (DIR) S7 Data. (DIR) S1 File. (DOCX) S1 Dataset. (XLSX)S2 Dataset.
(XLSX)
Acknowledgments
We greatly appreciate the help of research technicians in Nordic Seed A/S who contributed to the phenotypic and genotypic data collection. We also thank Per Madsen for technical help in the use of DMU software, Andrea Bellucci for his generous contribution (Figs1and2), and anonymous colleagues who read the draft to improve the quality of the manuscript.
Author Contributions
Conceptualization: Ahmed Jahoor, Just Jensen.
Data curation: Jeppe Reitan Andersen, Jihad Orabi, Jens Due Jensen.
Formal analysis: Hsin-Yuan Tsai, Fabio Cericola, Vahid Edriss, Luc Janss, Just Jensen. Methodology: Hsin-Yuan Tsai.
Resources: Jeppe Reitan Andersen, Jihad Orabi, Jens Due Jensen, Ahmed Jahoor, Luc Janss. Supervision: Just Jensen.
Visualization: Hsin-Yuan Tsai.
Writing – original draft: Hsin-Yuan Tsai, Just Jensen. Writing – review & editing: Hsin-Yuan Tsai, Just Jensen.
References
1. Mascher M, Gundlach H, Himmelbach A, Beier S, Twardziok SO, Wicker T, et al. A chromosome con-formation capture ordered sequence of the barley genome. Nature. 2017; 544: 427. Available:http://dx. doi.org/10.1038/nature22043PMID:28447635
2. FAOSTAT. FAO Statistics Division 2016. Rome; 2016. Available:http://www.fao.org/statistics/en/
3. Shewry PR. Wheat. J Exp Bot. 2009; 60: 1537–1553. Available:http://dx.doi.org/10.1093/jxb/erp058 PMID:19386614
4. Appels R, Eversole K, Feuillet C, Keller B, Rogers J, Stein N, et al. Shifting the limits in wheat research and breeding using a fully annotated reference genome. Science (80-). 2018; 361. Available:http:// science.sciencemag.org/content/361/6403/eaar7191.abstract
5. Sreenivasulu N, Graner A, Wobus U. Barley Genomics: An Overview. Int J Plant Genomics. 2008; 2008: 486258.https://doi.org/10.1155/2008/486258PMID:18382615
6. Cericola F, Jahoor A, Orabi J, Andersen JR, Janss LL, Jensen J. Optimizing Training Population Size and Genotyping Strategy for Genomic Prediction Using Association Study Results and Pedigree Infor-mation. A Case of Study in Advanced Wheat Breeding Lines. PLoS One. 2017; 12: e0169606. Avail-able:https://doi.org/10.1371/journal.pone.0169606PMID:28081208
7. Nielsen NH, Jahoor A, Jensen JD, Orabi J, Cericola F, Edriss V, et al. Genomic Prediction of Seed Quality Traits Using Advanced Barley Breeding Lines. PLoS One. 2016; 11: e0164494. Available: https://doi.org/10.1371/journal.pone.0164494PMID:27783639
8. Meuwissen THE Hayes BJ, Goddard ME. Prediction of Total Genetic Value Using Genome-Wide Dense Marker Maps. Genetics. 2001; 157: 1819–1829. PMID:11290733
9. Jensen J, Ma¨ntysaari E, Madsen P, Thompson R. Residual maximum likelihood estimation of (co)vari-ance components in multivariate mixed linear models using average information. J Indian Soc Agric Stat. 1997; 49: 215–236.
10. Henderson CR. Applications of Linear Models in Animal Breeding. Guelph, Canada: University of Guelph; 1984.
11. Hickey JM, Chiurugwi T, Mackay I, Powell W, ParticipantsI GS in CBPW. Genomic prediction unifies animal and plant breeding programs to form platforms for biological discovery. Nat Genet. 2017; 49: 1297. Available:http://dx.doi.org/10.1038/ng.3920PMID:28854179
12. Jannink J-L, Lorenz AJ, Iwata H. Genomic selection in plant breeding: from theory to practice. Brief Funct Genomics. 2010; 9: 166–177. Available:http://dx.doi.org/10.1093/bfgp/elq001PMID:20156985
13. Calus MPL, Veerkamp RF. Accuracy of multi-trait genomic selection using different methods. Genet Sel Evol. 2011; 43: 26.https://doi.org/10.1186/1297-9686-43-26PMID:21729282
14. Heffner EL, Sorrells ME, Jannink J-L. Genomic Selection for Crop Improvement All rights reserved. No part of this periodical may be reproduced or transmitted in any form or by any means, electronic or mechanical, including photocopying, recording, or any information storage and retrieval syst. Crop Sci. 2009; 49: 1–12.
15. Okeke UG, Akdemir D, Rabbi I, Kulakow P, Jannink J-L. Accuracies of univariate and multivariate geno-mic prediction models in African cassava. Genet Sel Evol. 2017; 49: 88.https://doi.org/10.1186/ s12711-017-0361-yPMID:29202685
16. Rutkoski J, Benson J, Jia Y, Brown-Guedira G, Jannink J-L, Sorrells M. Evaluation of Genomic Predic-tion Methods for Fusarium Head Blight Resistance in Wheat. Plant Genome. 2012; 5: 51–61.https:// doi.org/10.3835/plantgenome2012.02.0001
17. Hayes BJ, Panozzo J, Walker CK, Choy AL, Kant S, Wong D, et al. Accelerating wheat breeding for end-use quality with multi-trait genomic predictions incorporating near infrared and nuclear magnetic resonance-derived phenotypes. Theor Appl Genet. 2017; 130: 2505–2519.https://doi.org/10.1007/ s00122-017-2972-7PMID:28840266
18. Haile JK, N’Diaye A, Clarke F, Clarke J, Knox R, Rutkoski J, et al. Genomic selection for grain yield and quality traits in durum wheat. Mol Breed. 2018; 38: 75.https://doi.org/10.1007/s11032-018-0818-x
19. Heslot N, Yang H-P, Sorrells ME, Jannink J-L. Genomic Selection in Plant Breeding: A Comparison of Models. Crop Sci. 2012; 52: 146–160.https://doi.org/10.2135/cropsci2011.06.0297
20. Schulthess AW, Wang Y, Miedaner T, Wilde P, Reif JC, Zhao Y. Multiple-trait- and selection indices-genomic predictions for grain yield and protein content in rye for feeding purposes. Theor Appl Genet. 2016; 129: 273–287.https://doi.org/10.1007/s00122-015-2626-6PMID:26561306
21. Spindel J, Begum H, Akdemir D, Virk P, Collard B, Redoña E, et al. Genomic Selection and Association Mapping in Rice (Oryza sativa): Effect of Trait Genetic Architecture, Training Population Composition, Marker Number and Statistical Model on Accuracy of Rice Genomic Selection in Elite, Tropical Rice Breeding Lines. PLOS Genet. 2015; 11: e1004982. Available:https://doi.org/10.1371/journal.pgen. 1004982PMID:25689273
22. Guo G, Zhao F, Wang Y, Zhang Y, Du L, Su G. Comparison of single-trait and multiple-trait genomic prediction models. BMC Genet. 2014; 15: 30.https://doi.org/10.1186/1471-2156-15-30PMID: 24593261
23. JiaY JanninkJ-L. Multiple-Trait Genomic Selection Methods Increase Genetic Value Prediction Accu-racy. Genetics. 2012; 192: 1513 LP–1522. Available:http://www.genetics.org/content/192/4/1513. abstract
24. Tsuruta S, Misztal I, Aguilar I, Lawlor TJ. Multiple-trait genomic evaluation of linear type traits using genomic and phenotypic data in US Holsteins. J Dairy Sci. 2011; 94: 4198–4204. doi:https://doi.org/10. 3168/jds.2011-4256PMID:21787955
25. Falconer DS, Mackay TFC. Introduction to Quantitative Genetics. 4th ed. Harlow, Essex, UK.: Long-mans Green; 1996.
26. Sukumaran S, Crossa J, Jarquin D, Lopes M, Reynolds MP. Genomic Prediction with Pedigree and Genotype×Environment Interaction in Spring Wheat Grown in South and West Asia, North Africa, and Mexico. G3 Genes|Genomes|Genetics. 2017; 7: 481–495.https://doi.org/10.1534/g3.116.036251 PMID:27903632
27. Petersen RG. Agricultural field experiments: design and analysis. Marcel Dekker, New York.: CRC Press; 1994.https://www.crcpress.com/
28. Emik LO, Terrill CE. Systematic procedures for calculating inbreeding coefficients. J Hered. 1949; 40: 51–55.https://doi.org/10.1093/oxfordjournals.jhered.a105986PMID:18116093
29. Henderson CR. A simple method for computing the inverse of a numerator relationship matrix used in prediction of breeding values. Biometrics. 1976;32.https://doi.org/10.2307/2529339
30. VanRaden PM. Efficient methods to compute genomic predictions. J Dairy Sci. 2008; 91: 4414–23. https://doi.org/10.3168/jds.2007-0980PMID:18946147
31. R Core Team. R: A language and environment for statistical computing. Vienna, Austria: R Foundation for Statistical Computing; 2017.https://www.r-project.org/
32. MadsenP, JensenJ. DMU: A user’s guide. A Package for Analysing Multivariate Mixed Models. Version 6. Release 5.2. Tjele, Denmark; 2013.http://dmu.agrsci.dk/DMU/Doc/Current/dmuv6_guide.5.2.pdf
33. delos Campos G, Vazquez AI, Fernando R, Klimentidis YC, Sorensen D. Prediction of Complex Human Traits Using the Genomic Best Linear Unbiased Predictor. PLOS Genet. 2013; 9: e1003608. Available: https://doi.org/10.1371/journal.pgen.1003608PMID:23874214
34. Conner JK. Genetic mechanisms of floral trait correlations in a natural population. Nature. 2002; 420: 407. Available:http://dx.doi.org/10.1038/nature01105PMID:12459781
35. Montesinos-Lo´pez OA, Montesinos-Lo´pez A, Crossa J, Toledo FH, Pe´rez-Herna´ ndez O, Eskridge KM, et al. A Genomic Bayesian Multi-trait and Multi-environment Model. G3 Genes|Genomes|Genetics. 2016; 6: 2725 LP–2744. Available:http://www.g3journal.org/content/6/9/2725.abstract
36. Xu C, Wang X, LI Z, XU S. Mapping QTL for multiple traits using Bayesian statistics. Genet Res (Camb). 2009/02/01. 2009; 91: 23–37.https://doi.org/10.1017/S0016672308009956PMID:19220929
37. Xue W, Xing Y, Weng X, Zhao Y, Tang W, Wang L, et al. Natural variation in Ghd7 is an important regu-lator of heading date and yield potential in rice. Nat Genet. 2008; 40: 761–767. Available:http://dx.doi. org/10.1038/ng.143PMID:18454147
38. Bao Y, Kurle JE, Anderson G, Young ND. Association mapping and genomic prediction for resistance to sudden death syndrome in early maturing soybean germplasm. Mol Breed. 2015; 35: 128. 1https:// doi.org/10.1007/s11032-015-0324-3PMID:25999779
39. Bernardo R. Molecular Markers and Selection for Complex Traits in Plants: Learning from the Last 20 Years. Crop Sci. 2008; 48: 1649–1664.https://doi.org/10.2135/cropsci2008.03.0131
40. Daetwyler HD, Pong-Wong R, Villanueva B, Woolliams JA. The impact of genetic architecture on genome-wide evaluation methods. Genetics. 2010; 185.https://doi.org/10.1534/genetics.110.116855 PMID:20407128
41. Meuwissen T, B, Goddard M. Accelerating Improvement of Livestock with Genomic Selection. Annu Rev Anim Biosci. 2013; 1: 221–237.https://doi.org/10.1146/annurev-animal-031412-103705PMID: 25387018
42. Guo Z, Magwire MM, Basten CJ, Xu Z, Wang D. Evaluation of the utility of gene expression and meta-bolic information for genomic prediction in maize. Theor Appl Genet. 2016; 129: 2413–2427.https://doi. org/10.1007/s00122-016-2780-5PMID:27586153
43. Riedelsheimer C, Czedik-Eysenberg A, Grieder C, Lisec J, Technow F, Sulpice R, et al. Genomic and metabolic prediction of complex heterotic traits in hybrid maize. Nat Genet. 2012; 44: 217. Available: http://dx.doi.org/10.1038/ng.1033PMID:22246502
44. Ward J, Rakszegi M, BedőZ, Shewry PR, Mackay I. Differentially penalized regression to predict agro-nomic traits from metabolites and markers in wheat. BMC Genet. 2015; 16: 19.https://doi.org/10.1186/ s12863-015-0169-0PMID:25879431
45. Xu S, Xu Y, Gong L, Zhang Q. Metabolomic prediction of yield in hybrid rice. Plant J. 2016; 88: 219– 227.https://doi.org/10.1111/tpj.13242PMID:27311694