저작자표시-비영리-변경금지 2.0 대한민국 이용자는 아래의 조건을 따르는 경우에 한하여 자유롭게 l 이 저작물을 복제, 배포, 전송, 전시, 공연 및 방송할 수 있습니다. 다음과 같은 조건을 따라야 합니다: l 귀하는, 이 저작물의 재이용이나 배포의 경우, 이 저작물에 적용된 이용허락조건 을 명확하게 나타내어야 합니다. l 저작권자로부터 별도의 허가를 받으면 이러한 조건들은 적용되지 않습니다. 저작권법에 따른 이용자의 권리는 위의 내용에 의하여 영향을 받지 않습니다. 이것은 이용허락규약(Legal Code)을 이해하기 쉽게 요약한 것입니다. Disclaimer 저작자표시. 귀하는 원저작자를 표시하여야 합니다. 비영리. 귀하는 이 저작물을 영리 목적으로 이용할 수 없습니다. 변경금지. 귀하는 이 저작물을 개작, 변형 또는 가공할 수 없습니다.
Doctoral Thesis
Enhancing Mechanical Properties
of Nanoporous Gold by Controlling
External and Internal Microstructural Factors
Eun-Ji Gwak
Department of Materials Science and Engineering
Graduate School of UNIST
2019
Enhancing Mechanical Properties of Nanoporous
Gold by Controlling External and Internal
Microstructural Factors
Eun-Ji Gwak
Department of Materials Science and Engineering
i
Abstract
Mechanical integrity becomes a decisive factor to assess applicability of nanoporous materials due to their mechanical fragility in tension. Nanoporous materials with large surface area and physicochemical reactivity by nanoscale open-cell structure have considerable potential for sensing, actuating and catalytic applications. Since scale of constituent material is in nanometer-scale, nanoporous metals show unique mechanical characteristics due to large free surface and confined volume for deformation.
The goal of this research is investigation of mechanical properties of nanoporous gold(np-Au) depending on external and internal microstructure based on the nanomechanics and suggesting process to enhance mechanical reliability of np-Au.
Mechanism of indentation size effect in nanoindentation with sharp tip and spherical tip will be discussed by ligament size dependent plasticity. It has been well-known that indentation hardness is increased with decreasing ligament size similarly to size effect in nanopillar compression where probability of dislocation existence in very small volume determine strength of nanopillar. Nanomechanical modeling and experimental results from uniaxial compression, pure shear test and nanoindentation well-describes mechanism of indentation size effect in np-Au regarding of ligament size.
Fabrication methods for nanocrystalline, prestrained and nanotwinned np-Au is suggested and mechanical properties and deformation behavior is described by interaction of dislocation with internal microstructural factors. Grain boundary, twin boundary and dislocations are important defects which determine mechanical behavior of metals by acting as obstacles of dislocation movement. In np-Au, dislocation motion in ligaments and junctions are responsible for deformation. Nanoindentation, flexural test and in-situ tensile test are conducted to investigate effect of microstructural defects on mechanical behavior of np-Au. Nanomechanical studies reveal that grain boundaries weaken flexural strength of Au, on the other hand, nanotwin structure in ligament improves tensile strength of np-Au.
iii
Contents
List of Figures Introduction 1. Research Background 1.1. Fabrication of Np-Au1.2. Mechanical Properties of Np-Au
2. Mechanical Behavior of Np-Au Depending on External Microstructures
2.1. Indentation Size Effect of Np-Au in Sharp Tip Indentation
2.1.1. Nanomechanical Modeling
2.1.2. Experimental Procedure and Results 2.1.3. Ligament Size Effect and ISE Relation
2.2. Indentation Size Effect of Np-Au in Spherical Tip Indentation
2.2.1. Experimental Results and Nanomechanical Modeling 2.2.2. Relation between ISE Trend of Sharp Tip and Spherical Tip
2.3. Conclusion
3. Mechanical Behavior of Np-Au Depending on Internal Microstructures
3.1. Effect of Grain Size and Initial Dislocation Density on Deformation of Np-Au
3.1.1. Fabrication of Nanocrystalline and Prestrained Np-Au 3.1.2. Nanoindentation on Np-Au Samples
3.1.3. Flexural Test of Np-Au Samples
3.2. Strengthening Effect of Nanotwin Structure in Ligament of Np-Au
3.2.1. Fabrication of Nanotwinned Np-Au
3.2.2. Deformation Behavior during In-Situ Tensile Test 3.2.3. Ligament Plasticity
3.2.4. Bimodal Distribution for UTS of Nanotwinned-normal Np-Au 3.2.5. Relation between UTSs and Relative Density for Np-Au
3.3. Conclusion 4. Conclusion --- v --- 1 --- 25 --- 26 --- 30 --- 40 --- 43 --- 43 --- 49 --- 51 --- 52 --- 53 --- 57 --- 62 --- 67 --- 69 --- 72 --- 79 --- 82 --- 83 --- 85 --- 86 --- 4 --- 17
iv
References Curriculum Vitae
--- 87 --- 94
v
List of Figures
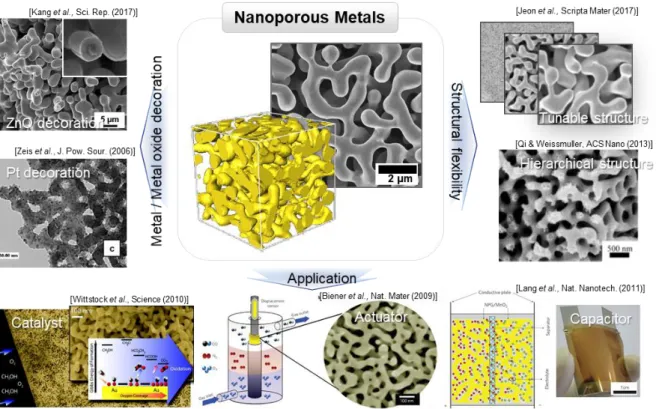
Figure 1 Wide research area of nanoporous metals ranging from structural tunability (adapted from
Jeon et.al., Copyright 2017 Elsevier17 and Qi and Weissmuller Copyright 2013 American Chemical
Society18) , heterogeneous composites(adapted from Kang et.al., Copyright 2017 Nature19 and Zeis et.al.,
Copyright 2006 Elsevier20) to various applications with large surface area(adapted from Wittstock et.al.,
Copyright 2010 Science21, Biener et.al., Copyright 2009 Nature22 and Lang et.al., Copyright 2011
Nature4).
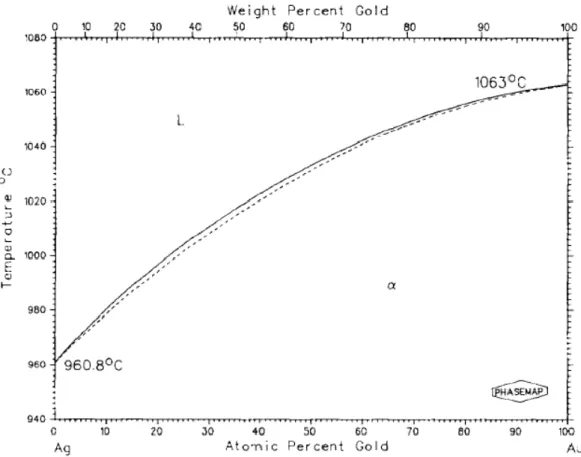
Figure 2-1 Binary phase diagram of gold and silver. Au-Ag alloy exist as solid solution in entire range
of composition (adapted from Elliott and Shunk Copyright 1980 Springer Nature28).
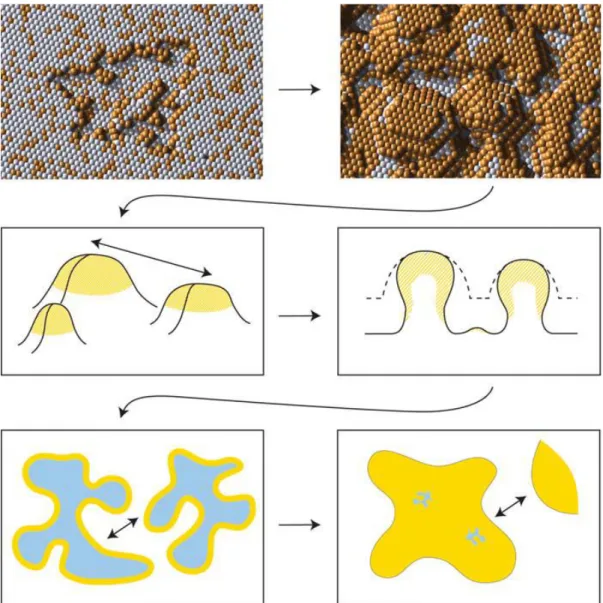
Figure 2-2 Evolution of nanoporosity during dealloying. Dissolution of less noble element (in this case,
silver) and surface diffusion of more noble element (in this case, gold) produce bicontinuous nanoporous structure and further coarsening occurs in more dealloying time. (adapted from Erlebacher and Sechadri Copyright 2011 Cambridge University Press30).
Figure 2-3 Volumetric contraction during dealloying (adapted from Parida et. al., Copyright 2006
American Physical Society31).
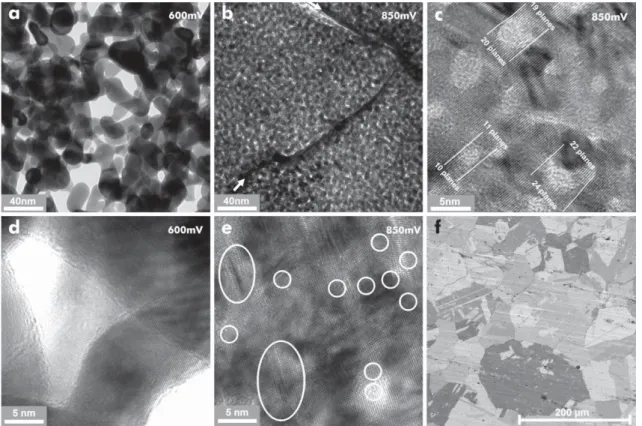
Figure 2-4 TEM images showing volumetric contraction during dealloying. Large amount of lattice
dislocations and stacking faults are generated during dealloying process (adapted from Parida et. al., Copyright 2006 American Physical Society31).
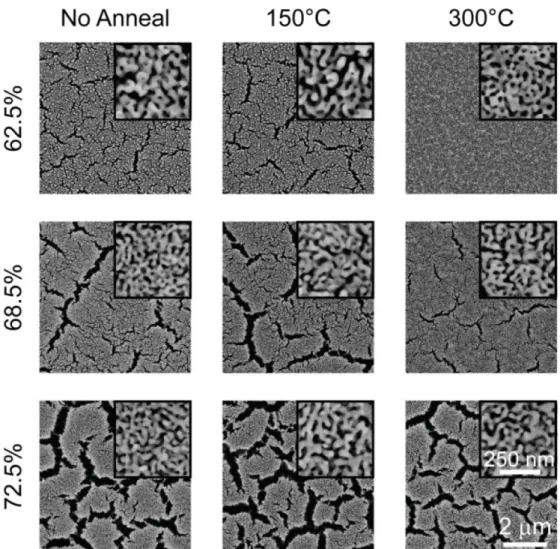
Figure 2-5 SEM images of nanoporous gold thin films with different silver composition and annealing
temperature. Large density of crack in np-Au thin film is produced by constraint of substrate during volume contraction of dealloying (adapted from Seker et. al., Copyright 2009 MDPI32).
Figure 2-6 SEM images of nanoporous gold thin films dealloyed in various temperature and
concentration of nitric acid etchant. Crack free np-Au thin films are formed by delaminating np-Au films from Si substrate during dealloying (adapted from Gwak et al., Copyright 2013 Elsevier7.)
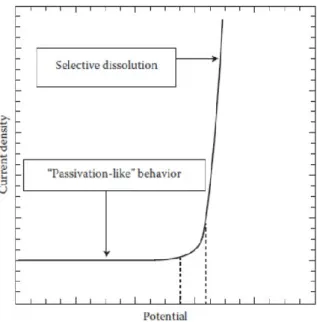
Figure 2-7 Current/potential behavior undergoing selective dissolution of sacrificial element.
Nanoporous structure can be generated above critical potential, Ec (adapted from Sieradzki et al.,
Copyright 2002, The Electrochemical Society36).
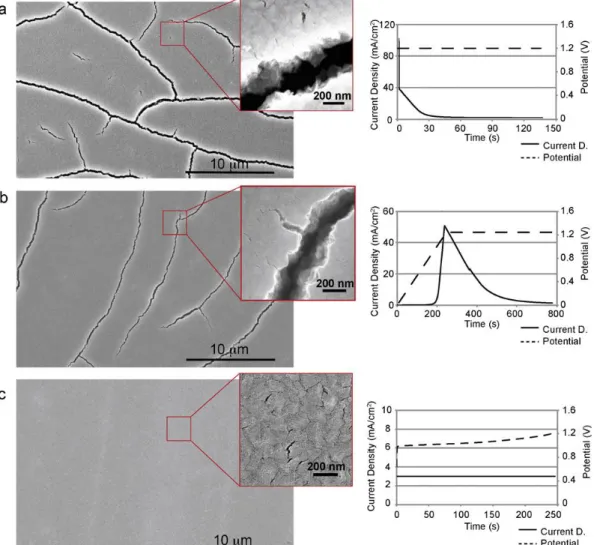
Figure 2-8 Np-Au structures with their dealloying potential and current records. (a) potentiostatic method with stepped potential; (b) potentiostatic method with ramped potential; and, (c) galvanostatic
vi
method with constant current density of 3mA/cm2 (adapted from Okman and Kysar Copyright 2011
Elsevier35).
Figure 2-9 Morphology evolution during coarsening by heat treatment. (a) SEM and (b) 3D
reconstructed images of np-Au samples coarsened under different temperature (adapted from Jeon et al., Copyright 2017 Elsevier17).
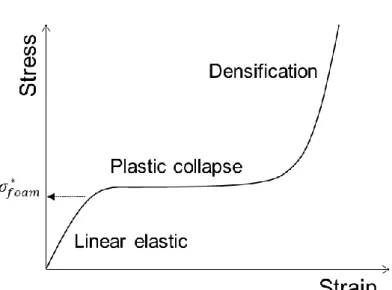
Figure 2-10 Compressive stress-strain behavior of general open cell structured porous materials.
Figure 2-11 SEM image of residual indent after sharp tip indentation and force-indentation depth and
hardness-indentation depth curve on np-Au samples with different ligament size; (a) 60 nm; (b) 160 nm; (c) 480 nm (adapted from Hodge et al., Copyright 2007 Elsevier12).
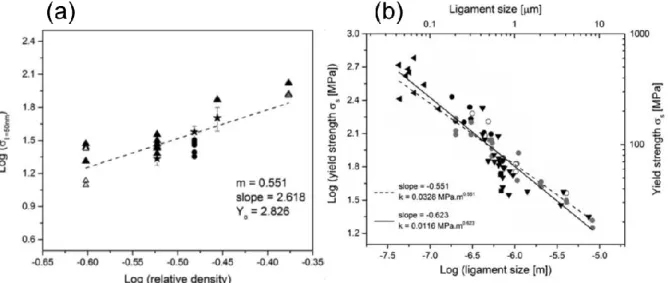
Figure 2-12 Scaling relation of (a) strength-relative density and (b) strength-ligament size (adapted
from Briot and Balk Copyright 2015 Taylor & Francis41).
Figure 2-13 Dislocation motion during nanoindentation on np-Au. Dislocations in ligament (indicated
by arrows) move to ligament junction by indentation (adapted by Sun et al., Copyright 2009 John Wiley and Sons43).
Figure 2-14 (a) Tensile stress-strain curve for np-Au. (b) Fractography of np-Au tensile specimen and
(c) fracture surface (adapted by Hodge and Balk, Copyright 2012 Royal Society of Chemistry44).
Figure 2-1 Nanomechanical model for sharp tip nanoindentation on np-material (adapted from Kim et
al., Copyright 2017 Elsevier49).
Figure 3-2 Surface morphology of np-Au samples from different dealloying conditions and heat
treatment (adapted from Kim et al., Copyright 2017 Elsevier49).
Figure 3-3 (a)-(d) Force-indentation depth curves and (e)-(h) hardness-indentation depth curves on
np-Au samples with different ligament sizes (adapted from Kim et al., Copyright 2017 Elsevier49).
Figure 3-4 Normalized hardness by macroscopic hardness versus normalized indentation depth by cell
size curves of np-Au samples (adapted from Kim et al., Copyright 2017 Elsevier49).
Figure 3-5 Typical hardness-indentation depth curves and fitted curves of np-Au samples (adapted from
Kim et al., Copyright 2017 Elsevier49).
Figure 3-6 Uniaxial compressive stress-strain curves of np-Au samples and compressive yield strength
and ligament size relation (adapted from Kim et al., Copyright 2017 Elsevier49).
vii (adapted from Kim et al., Copyright 2017 Elsevier49).
Figure 3-8 Relation between (a) shear strength/compressive yield strength and ligament size and (b)
constant k and ligament size (adapted from Kim et al., Copyright 2017 Elsevier.)
Figure 3-9 (a) Graphical definitions of contact morphology and typical force-indentation depth curves
for spherical indentation with (b) 4, (c) 12 and (d) 50 μm tip radii (adapted from Kim et al., Copyright 2018 Elsevier14).
Figure 3-10 Relation between indentation hardness and contact radius (adapted from Kim et al.,
Copyright 2018 Elsevier14).
Figure 3-11 Nanomechanical modeling of spherical indentation on np-material (adapted from Kim et
al., Copyright 2018 Elsevier14).
Figure 3-12 (a) Typical compressive stress-strain curve for ligament size of 26 nm (inset of entire curve)
and (b) hardness-contact radius relation comparing with hardness-indentation depth relation in sharp tip indentation (adapted from Kim et al., Copyright 2018 Elsevier14).
Figure 4-1 Schematics of approaches for synthesis of nanocrystalline materials (adapted from Murty
and Venugopal, Copyright 2011 Encycl. Nanosci. Nanotechnol.73).
Figure 4-2 (a)-(i) Grain structure and (j)-(l) surface morphology before and after dealloying of annealed,
prestrained and ball-milled samples (adapted from Gwak and Kim Copyright 2016 American Chemical Society15).
Figure 4-3 (a) Typical and (b) averaged force-indentation depth curves of precursors and (c), (d) np-Au
samples (adapted from Gwak and Kim Copyright 2016 American Chemical Society15).
Figure 4-4 Surface morphology of residual indents after nanoindentation on each samples (adapted
from Gwak and Kim Copyright 2016 American Chemical Society15).
Figure 4-5 EBSD IPF image and SEM image of residual indent on ball-milled np-Au (adapted from
Gwak and Kim Copyright 2016 American Chemical Society15).
Figure 4-6 Still images during 3-point bending test; (a) initial contact; (b) right before fracture; and (d)
after fracture
Figure 4-7 (a) Typical flexural stress-strain curve during 3-point bending test, (b) average flexural strength of each samples, (c)-(e) fracture surface and (f)-(h) enlarged fracture surface of samples with (c), (f) transgranular fracture, (d), (g) intergranular fracture and (e), (h) ball-milled sample (adapted from Gwak and Kim Copyright 2016 American Chemical Society15).
viii
Figure 4-8 (a) Surface morphology and (b) cross-sectional fractured surface showing grain boundary
opening for annealed and prestrained np-Au.
Figure 4-9 Illustration of a CTB in fcc metals. White and gray atoms are on adjacent {110} planes
(adapted from Li and Gao, Copyright 2012 John Wiley and Sons92).
Figure 4-10 Microstructure of precursor alloy and np-Au thin films. (a) (111) textured and (b) columnar
nanotwin structure in nanotwinned precursor foil was confirmed with (c) HRTEM and (d) STEM image and diffraction pattern (inset of (d)). After dealloying, nanotwin structure preserved in np-Au foil and was confirmed with (f) and (g) TEM and diffraction pattern. Rare twin sample has (i) large grain without (k) nanotwin structure (adapted from Gwak et al., Copyright 2018 Elsevier16).
Figure 4-11 Schematics of preparation for tensile specimen using FIB and omniprobe system. (adapted
from Gwak et al., Copyright 2018 Elsevier16).
Figure 4-12 Tensile stress-strain curves of (a) nanotwinned-normal, (b) nanotwinned-inclined np-Au
and (c) np-Au with rare twins. (d) distribution of UTS of np-Au samples (adapted from Gwak et al., Copyright 2018 Elsevier16).
Figure 4-13 (a) Typical stress-strain curves for nanotwinned-normal np-Au with (b), (c) distributed
strain and high strength (black open squares in (a)) and localized strain and low strength (green filled circles in (a)) (adapted from Gwak et al., Copyright 2018 Elsevier16).
Figure 4-14 Fracture morphology and strain distribution for (a), (b) nanotwinned-inclined , (c)-(e) intergranular fractured and (f)-(h) transgranular fractured np-Au with rare twin (adapted from Gwak et al., Copyright 2018 Elsevier16).
Figure 4-15 Relation between UTS, elastic modulus and morphology of fracture surface for (a) all
samples, (b) nanotwinned-normal, (c) nanotwinned-inclined np-Au and (d) np-Au with rare twins (adapted from Gwak et al., Copyright 2018 Elsevier16).
Figure 4-16 Schematics for dislocation motion in ligaments with different microstructures. (a) single
crystal ligament, (c), (d) ligament with 45°-inclined nanotwin structure and (e), (f) ligament with nanotwin structure perpendicular to ligament axis. (b) Possible dislocation path in FCC material with twin boundaries (adapted from Gwak et al., Copyright 2018 Elsevier16).
1
1.
Introduction
Nanoporous metal(np-metal) foams is a cellular material that has three-dimensional bicontinuous porous structure composed with interconnected solid metal ligaments and pores. In general, np-metals exhibit porosity of more than 50% and pore size of several nanometers to micrometers. Random nanoporosity in np-metals leads to high surface-to-volume ratio and unique chemical, physical and mechanical properties. Based on these advantages, np-metals have attracted considerable attentions in various applications such as sensors, catalysts, actuators, capacitors and biomedical fields1-6
.
Np-metals are usually fabricated by selective dissolution of sacrificial element from precursor alloy, which is called dealloying process. In order to obtain uniform nanoporous structure, precursor alloys are preferred to be solid solution or metallic glass of more than two elements with suitable composition for uniform porous structure and there should be difference in chemical reactivity for selective etching. During dealloying, less noble element dissolves into etchant leaving more noble element at dealloying surface and left noble adatoms agglomerate into interconnecting ligaments. Ligament size is the most important factor to determine various properties of np-metals because it is directly related with surface area. We can adjust pore and ligament size in np-metals by controlling dealloying conditions such as temperature and concentration of etchant and dealloying time7. Details of
synthesis for np-Au will be addressed in Chapter 2.
Mechanical properties of np-metals are also dependent on ligament size and relative density. In many previous researches, strength of pillar increases with decreasing diameter since probability of existence of dislocation source becomes rare as sample size decreases8-10. In the same line with size effect in nanopillar compression, strength of np-metal increases with decreasing ligament size11-12. During deformation of np-metals, dislocations are generated neck surface of hourglass-shaped ligament and move to opposite neck surface or thicker junction and slip motions are confined in very small volume of ligaments13. Also, nanopores in np-metal volume could act as stress concentrator that make crack propagation faster than solid material showing brittle failure in tension. Brittleness of np-metals is the most critical issue for practical application where mechanical reliability should be assured. Research background about mechanical properties of np-metals will be addressed in Chapter 2 as well. Though microstructural characteristic lengths such as ligament size, grain size, initial dislocation density and twin spacing, which have played a considerable role in deformation behavior in metals, should be involved in deformation behavior of np-metals, these factors have not been considered comprehensively. In this research, np-gold(np-Au) is chosen as a typical np-metal as it has chemical inertness and ease of fabrication and systematic studies for structure-property relations of np-metals are introduced.
2
In the Chapter 3, indentation size effect in nanoindentation on np-Au is investigated regarding with ligament size14. As ligament size increased, more dislocation sources could exist in ligaments
causing dissimilar response during nanoindentation. Nanomechanical modeling is suggested for indentation size effect in np-metals and deformation mechanism depending on ligament size is discussed based on uniaxial compression and pure shear tests.
In the Chapter 4, effects of internal microstructure in ligaments on mechanical properties and deformation behavior are researched based on nanomechanics. Nanocrystalline np-Au is fabricated by using ball-milled precursor alloy and nanoindentation and flexural test are conducted to investigate mechanical properties by microstructural factors15. Nanotwinned np-Au is synthesized by using
optimized conditions in co-sputtering of precursor foil. By correlating microstructure and mechanical properties, we can design and manufacture np-metals with desirable performance for applications16.
3
Figure 1 Wide research area of nanoporous metals ranging from structural tunability (adapted from
Jeon et.al., Copyright 2017 Elsevier17 and Qi and Weissmuller Copyright 2013 American Chemical
Society18) , heterogeneous composites(adapted from Kang et.al., Copyright 2017 Nature19 and Zeis et.al.,
Copyright 2006 Elsevier20) to various applications with large surface area(adapted from Wittstock et.al.,
Copyright 2010 Science21, Biener et.al., Copyright 2009 Nature22 and Lang et.al., Copyright 2011
4
2.
Research Background
2.1
Fabrication of np-Au
Fabrication strategies for np-metals have been numerously suggested until now from bottom-up method such as self-assemble of nanoparticles23 to top-down method such as template deposition24 and
combustion synthesis25. Among various synthesis technique of np-metals, dealloying is the most notable
fabrication method for np-metals based on corrosion of selective element in precursor26-27. So, precursor
alloy consists of at least two elements and there should be difference in electrochemical potential for selective dissolution. For np-Au, many precursor alloy systems such as Au-Ag, Au-Cu and Au-Ni have been used in researches and Au-Au binary alloy is the most likely used. Au-Ag precursor alloy forms solid solution in entire range of composition, as shown in Fig. 2-1, because gold and silver have FCC structure, similar lattice constant and large difference in chemical activity. Single phase of Ag-Au precursor alloy makes np-Au to produce uniform and homogeneous nanoporous structure during dealloying.
In general, Au-Ag precursor alloy is fabricated in multi-scale using furnace or arc-melting system for bulk-scale sample and sputtering system or thermal evaporator for nano- to micro-scale sample. Bulk-scale Ag-Au alloy is synthesized by melting pure Ag and Au source at very high temperature in furnace. Ag-Au alloy thin film or foil could be fabricated using co-sputtering of highly pure Ag and Au target on desirable substrate. This method has advantages of controlling composition by sputtering power and thickness by sputtering time and working pressure. Microstructure in precursor alloy thin film is also diversified by sputtering conditions such as temperature and deposition rate. After alloying processes above, precursor alloy should undergo homogenization step for uniform solid solution phase and uniform composition in total volume of sample in order to obtain uniform nanoporous structure and ligament size. Homogenization temperature has to be decided considering phase diagrams with substrate material and adhesive layer to block diffusion of those un-wanted elements.
Dealloying is a common process to produce nanoporous structure from precursor alloy using difference in chemical reactivity in electrolyte. It could be conducted by either free corrosion without external potential or electrochemical dealloying with external potential depending on sacrificial element and target microstructure. Competition between selective etching of less noble element and surface diffusion of more noble element generates bicontinuous open-cell nanoporous structure during dealloying. For Ag-Au precursor alloy, less noble Ag element dissolves into nitric acid by reaction below leaving Au adatoms on surface and Au adatoms agglomerate by surface diffusion making Au islands.
5
Figure 2-1 Binary phase diagram of gold and silver. Au-Ag alloy exist as solid solution in entire
6
Ag(s) + HNO3(𝑎𝑞) → 𝐴𝑔𝑁𝑂3(𝑎𝑞) + 1 2𝐻2(𝑔)
As dealloying process continues, Ag element in internal volume is leached and three-dimensional interconnected ligaments are formed.
Uniform nanoporous structure can be formed with sacrificial element of suitable composition in precursor alloy. The critical composition of more noble element for complete dealloying is called parting limit26. For Ag-Au alloy, Au should be contained in range from 20 to 60 at.%. If amount of Au
in precursor alloy is less than 20%, Au nanoparticles are formed rather than interconnected ligament. If composition of Au is higher than 60%, passivation layer of Au is formed at surface halting further dissolution of Ag and formation of nanoporosity. Therefore, atomic proportion of more noble and less noble element in precursor alloy has to be considered to control dealloying process.
Dissolution of half or over half of elements into electrolyte causes change in composition and microstructure and volume contraction during dealloying. Volume contraction leads to generate microcracks and change in relative density, ratio of np-Au density to pure gold density, which is closely related with mechanical properties of np-metals.
It has been reported that defects such as dislocations or twin structure are produced after dealloying because of plastic deformation of ligaments due to surface-induced stress during dealloying. Those plastic deformation in ligament during dealloying could be origin of volume contraction in np-Au. While surface crack generated during dealloying could induce reliability issue by lowering mechanical properties of np-metals, techniques to regulate crack formation have been suggested. For example, surface crack in np-metal could be formed by fast dissolution of Ag by reducing time of surface diffusion of Au. Base on this, researchers have been revealed that volume contraction and crack formation could be reduced by slow dissolution condition or stepped-dealloying process29.
7
Figure 2-2 Evolution of nanoporosity during dealloying. Dissolution of less noble element (in this
case, silver) and surface diffusion of more noble element (in this case, gold) produce bicontinuous nanoporous structure and further coarsening occurs in more dealloying time. (adapted from
8
Figure 2-3 Volumetric contraction during dealloying (adapted from Parida et. al., Copyright 2006
American Physical Society31).
Figure 2-4 TEM images showing volumetric contraction during dealloying. Large amount of lattice
dislocations and stacking faults are generated during dealloying process (adapted from Parida et. al., Copyright 2006 American Physical Society31).
9
Figure 2-5 SEM images of nanoporous gold thin films with different silver composition and
annealing temperature. Large density of crack in np-Au thin film is produced by constraint of substrate during volume contraction of dealloying (adapted from Seker et. al., Copyright 2009 MDPI
10
As mentioned above, dealloying has a huge advantage that microstructure and nanoporosity could be controlled by changing dealloying conditions. In free-corrosion dealloying, immersion of Ag-Au precursor alloy into nitric acid or perchloric acid make nanoporous structure immediately due to large difference in reactivity of Ag and Au for acidic solution. Ligament size is controlled by concentration and temperature of nitric acid and dealloying time in free-corrosion dealloying as they control dissolution rate of Ag and surface diffusion rate of Au. For example, high temperature of nitric acid increase both dissolution rate and surface diffusion rate making coarsened ligament comparing with dealloying in low temperature. Therefore, ligament size ‘𝑑(𝑡)’ could be described by function of temperature ‘T’ as below.
𝑑(𝑡)𝑛= 𝑎𝑡 exp (− 𝐸
𝑅𝑇) , Ds= 𝑑(𝑡)4𝑘𝑇
32𝛾𝑡𝑎4 7
where n is exponent for nanoporosity evolution, a is lattice constant, t is dealloying time, E is activation energy for nanoporosity evolution, R is gas constant, Ds is diffusivity of Au, k is Boltzmann
constant, and γ is surface energy. As described with equation, ligament size is strongly controlled by surface diffusion of Au at interface between alloy surface and electrolyte and ligament size increases with increasing diffusivity of Au33. Regrading with concentration of electrolyte, coarsened ligament is
obtained by decreasing concentration of nitric acid as dissolution rate of Ag is reduced and time for surface diffusion of Au is extended. However, further dilution of nitric acid retards Ag etching and may cause formation of Ag oxides at dealloying surface. Ag oxide might hinder surface diffusion of Au due to poor solubility of Ag oxide to nitric acid. So, it is hard to obtain nanoporous structure from the inside out.
Figure 2-6 shows surface morphology of np-Au thin film samples obtained from different dealloying conditions. As dealloying temperature increases and concentration decreases, ligament size is increased. Nanoporosity isn’t evolved in the case of 20℃, 1:3 (70% HNO3 : H2O) dealloying
condition because of low dissolution rate of Ag and formation of Ag oxides at dealloying interface as described above. Free corrosion dealloying has great advantage of ease of process and controlling microstructure of np-Au by changing process conditions. However, it is hard to produce ligament size under 10 nm and control volume contraction and generation of crack.
11
Figure 2-6 SEM images of nanoporous gold thin films dealloyed in various temperature and
concentration of nitric acid etchant. Crack free np-Au thin films are formed by delaminating np-Au films from Si substrate during dealloying (adapted from Gwak et al., Copyright 2013 Elsevier7).
12
Dealloying process by electrochemical method could make up the weakness of free corrosion dealloying34-35. By introducing external potential, Ag element is removed from Ag-Au precursor alloy
which is served as anode (working electrode) in three-electrode electrochemical cell. Potentiostat could regulate potential and dissolution rate of Ag delicately during dealloying. It provides smaller ligament size and less crack formation than that of free corrosion, however, experimental set-up is more complex. One of the most important factors in electrochemical dealloying is critical potential, Ec.
External potential should be applied in some range where less noble element could be removed, but more noble element doesn’t. In other words, applied potential has to be higher than dissolution potential of Ag and lower than dissolution potential of Au for selective leaching of Ag. If given potential is too low, Ag will not dissolve into electrolyte and passivation layer of Au will be formed at dealloying surface as shown in Fig. 2-7. If potential is increased to critical potential, dissolution current, which is associated dissolution rate, is rapidly increased exponentially.
Morphology of np-Au can be controlled by conditions of electrochemical dealloying such as temperature of electrolyte, applied current and potential similarly to free corrosion dealloying. As temperature of electrolyte increases, ligament size is also increased due to high surface diffusion rate of Au. Regarding with potential and current, dissolution rate of Ag increases with increasing applied potential and current leading to finer ligament size due to shorter time for surface diffusion. Concentration of electrolyte for electrochemical cell does not affect to microstructure evolution because it serves as electron carrier.
Microstructure of np-metals also depends on whether the potential or current is controlled. Potentiostatic method holds potential at constant value as measuring current change and galvanostatic method holds current at constant value as measuring potential change during dealloying. In potentiostatic electrochemical dealloying, current is proportional to dissolution rate of Ag as they flow between working electrode and counter electrode. When constant potential value is provided, dealloying current is decreasing as dealloying continues while dissolution of Ag is faster at surface than at interior of precursor alloy and amount of Ag is decreased by dissolution. Therefore, residual stress and crack is caused by difference in dissolution rate of Ag and surface diffusion time of Au adatoms between surface and interior. On the other hand, galvanostatic method keeps dissolution rate of Ag constant from beginning to end of dealloying. Therefore, crack formation is prevented in galvanostatic method by alleviating residual stress.
13
Figure 2-7 Current/potential behavior undergoing selective dissolution of sacrificial element.
Nanoporous structure can be generated above critical potential, Ec (adapted from Sieradzki et al.,
14
Figure 2-8 Np-Au structures with their dealloying potential and current records. (a) potentiostatic
method with stepped potential; (b) potentiostatic method with ramped potential; and, (c) galvanostatic method with constant current density of 3mA/cm2 (adapted from Okman and Kysar Copyright 2011
15
Post treatments are conducted to further control of microstructure in np-metals. Post-dealloying can lower the residual amount of Ag. Residual Ag element in np-Au is associated with chemical activity and mechanical properties. Even if residual Ag is removed as much as they can, surface diffusion of Au could be occurred in nitric acid causing coarsening of ligament. Ligament coarsening can be occurred up to microscales by post heat treatment (annealing) 37-38. Relation between
ligament size and annealing temperature can be described by the equation 𝑘 ∙ 𝑡 = exp(− 𝑄
𝑅𝑇)
where k is characteristic ligament size, t is time, Q is activation energy of coarsening, R is Boltzmann constant and T is annealing temperature. Previous results show relation between ligament size and annealing temperature and activation energy for coarsening of 34.1 kJ/mol for 2 hours annealing17. This
value is very close to surface diffusion of Au and indicates that ligament coarsening is accomplished by surface diffusion. Also, 3D reconstruction by FIB-tomography of coarsened np-Au has demonstrated np-Au coarsening was carried out in self-similar manner where ligament size distribution, connectivity and surface-to-volume ratio is in similar trend.
16
Figure 2-9 Morphology evolution during coarsening by heat treatment. (a) SEM and (b) 3D
reconstructed images of np-Au samples coarsened under different temperature (adapted from Jeon et al., Copyright 2017 Elsevier17).
17
2.2
Mechanical properties of np-Au
2.2.1
Effect of relative density
Np-metals made by corrosive dealloying are open-cell structure with over 50% porosity in volume. Figure 2-10 shows typical compressive stress-strain curve for open-cell material. It shows three deformation stage; linear elastic region; plateau region by plastic collapse and; densification region. After linear elastic region, plastic collapse is occurred without large increase in stress because it is proceeded by elastic buckling, shearing and fracture of ligaments with pore closing. Densification region appear when pore volume could be shrunk anymore.
Relative density, ratio of density of cellular material (ρ*) to dense solid material (ρ
s), is an
important factor to mechanical properties of cellular material39. In the book of Gibson and Ashby, yield
strength(σ*) and elastic modulus(E*) of open-cell material have been described by the relation with relative density of foam (ρ*/ρs) as
𝜎∗= 𝐶2𝜎𝑠( 𝜌∗ 𝜌𝑠) 1.5 (2-1) 𝐸∗= 𝐶 1𝐸𝑠( 𝜌∗ 𝜌𝑠) 2 (2-2)
where σs and Es is yield strength and elastic modulus of solid material, C1 and C2 is constant.
By these equations, mechanical properties of foam could be expected from solid material. However, this Gibson-Ashby model has been well fitted for cellular material with relative density less than 0.1 and smaller ligament size than pore size. Np-metals have relative density of 0.2 ~ 0.5 and ligament size is similar to cell size. Therefore, new scaling equations for describing np-metal have been studied by many researchers.
18
19
2.2.2
Effect of ligament size
Ligament size effect has been firstly illustrated by flexural test that brittle to ductile transition is occurred by increasing ligament size. As nanomechanical testing methods have been developed, mechanical properties of np-metals have been investigated by nanomechanical testing such as nanoindentation and nanopillar compression. Nanoindentation is a simple and easy technique to measure hardness and elastic modulus from indentation force versus depth curve obtained by indenting surface of materials with hard diamond tip. Previous researches have examined hardness and elastic modulus of np-Au with relative density of 0.25 to 0.42 and ligament size of 10 to 900 nm and have revealed that hardness is increased by decreasing ligament size even if np-Au samples have same relative density11-12, 40.
When plastic constraint factor, Ψ, is assumed to be 1 in Tabor equation, 𝐻 = 𝛹𝜎𝑦, for cellular material, yield strength and elastic modulus of np-Au is in range of 15 to 240 MPa and 7 to 40 GPa, whose yield strength is higher than annealed gold of 2 MPa and cold-rolled gold of 200 MPa. Estimated yield strength of np-Au with same relative density by G-A equation is in range of 7.5 to 16 MPa which is much lower than yield strength obtained by nanoindentation. Therefore, scaling equation considering ligament size effect has been suggested12.
σ∗= 𝐶𝑠[𝜎0+ 𝑘𝐿− 1 2] (𝜌 ∗ 𝜌𝑠) 3/2 (2-3)
Where σ* is yield strength of np-Au, Cs is constant, σ0is yield strength of bulk gold, k is
Hall-Petch coefficient, L is ligament size and ρ*/ρs is relative density of np-Au.
Recent research has suggested revised scaling equation for np-Au considering ligament size effect in nanoindentation, compression and tension and size effect in nanopillar compression41. Based
on empirical fitting, constant Cs, size effect exponents for ligament size and scaling exponent for relative density is obtained as below equation,
𝜎∗= 1.939𝜎𝑠( 𝜌∗
𝜌𝑠) 2.618
with 𝜎𝑠= 0.0328𝑙−0.551. (2-4)
Ligament size effect on strength of np-Au can be explained by dislocation starvation theory in line with size effect in nanopillar compression. Np-Au is composed with interconnected nanowire network in three-dimensional way, thus existence probability of dislocation source decreases with decreasing diameter of ligament.
20
Figure 2-11 SEM image of residual indent after sharp tip indentation and force-indentation depth and
hardness-indentation depth curve on np-Au samples with different ligament size; (a) 60 nm; (b) 160 nm; (c) 480 nm (adapted from Hodge et al., Copyright 2007 Elsevier12).
21
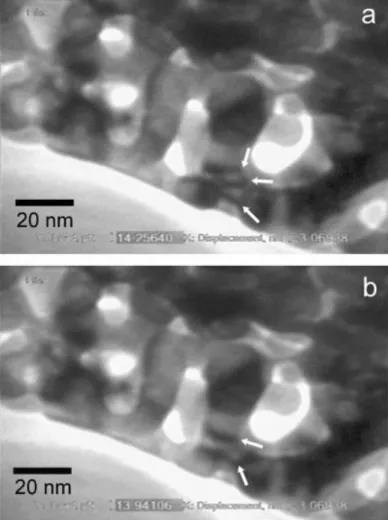
Rare dislocation source in ligament leads to strength of individual ligament obtaining theoretical strength of gold and change in carrier of deformation from use of internal dislocation to surface nucleation of dislocation. Figure 2-13 shows that pre-existing dislocations (indicated in white arrows) in ligament is moved to node and pore closing is occurred by indentation42.
One of important aspects of mechanical characteristics for np-metal is tension-compression asymmetry originated from nanoporous structure. Pores are closed during compression, on the other hand, pores are opened and enlarged during tension. Also, deformation mode in compression is mainly bending and torsion of ligament, whereas tension of ligament aligned with tensile direction is main deformation mode in tension. Pore opening during tension causes brittle fracture of np-Au. Figure 2-14 shows tensile behavior of np-Au that catastrophic brittle failure is occurred right after linear elasticity even though each ligament at fracture surface are ruptured by plastic deformation and necking. Furthermore, plastic deformation is localized at ligaments on outermost fracture surface. This means that crack propagates very fast when the weakest ligament is fractured. Therefore, some research groups have been suggested techniques for alleviating brittle fracture of np-Au such as coating ligament surface with polymers.
22
Figure 2-12 Scaling relation of (a) strength-relative density and (b) strength-ligament size (adapted
23
Figure 2-13 Dislocation motion during nanoindentation on np-Au. Dislocations in ligament (indicated
by arrows) move to ligament junction by indentation (adapted by Sun et al., Copyright 2009 John Wiley and Sons43).
24
Figure 2-14 (a) Tensile stress-strain curve for np-Au. (b) Fractography of np-Au tensile specimen and
25
3.
Mechanical Properties of Np-Au Depending on External Microstructures
3.1
Indentation Size Effect of Np-Au in Sharp Tip Indentation
Recently, mechanical characterization in nanoscale material have been explored significantly because of decrease in size of constituent materials by miniaturization and integration of devices. Among various nanomechanical tests, nanoindentation is a powerful and nondestructive technique to determine mechanical behavior of materials such as indentation hardness, elastic modulus, residual stress and so on. In the case of solid materials, hardness is increased as indentation depth decreases under critical depth, which is called indentation size effect. When hardness is overestimated at shallow indentation, it is hard to affirm that measured hardness is representative hardness value of the material. So, there must be researches for mechanism and estimation of indentation size effect in order to obtain exact mechanical properties.
In general, indentation size effect in solid materials are explained by geometrically necessary dislocation. When indentation depth is very low, affected volume by indentation elastically and plastically is too small to have dislocation source inside, thus new dislocations should be nucleated to carry out deformation. The nucleated dislocations to carry deformation at low indentation depth are called as geometrically necessary dislocations and they requires higher stress because interaction volume is almost defect-free at low depth near surface. As indentation is proceeded into deeper volume, pre-existing dislocation sources are activated by indentation force. These pre-existing dislocations are called as statistically stored dislocations. Therefore, strain gradient generated during indentation causes indentation size effect of solid materials.
Indentation size effect could be explained with numerical explanation45. In geometrically
self-similar sharp tip indentation, total length of geometrically necessary dislocation loops is defined as 𝜆 = 𝜋ℎ𝑝𝑎/𝑏, where angle between sample surface and tip surface is θ, residual plastic depth is hp(=h), contact radius is a and b is Burger’s vector. As interacting hemisphere volume by indentation of hp is 𝑉 = 2π𝑎3/3, density of geometrically necessary dislocations in hemisphere is 𝜌𝐺 =
𝜆 𝑉= 3 2𝑏ℎ𝑝tan 2𝜃 where tan𝜃 =ℎ𝑝
𝑎. Based on Taylor hardening model, shear strength, τ, is described as function of total dislocation density, ρT, as 𝜏 = 𝛼𝜇𝑏√𝜌𝑇 where μ is shear modulus and α is geometric constant. Total dislocation density is summation of statistically stored dislocation,𝜌𝑆, and geometrically necessary dislocation,𝜌𝐺, as described by 𝜌𝑇 = 𝑟̅𝜌𝐺+ 𝜌𝑆 where 𝑟̅ is Nye factor. By the relation between flow stress and shear strength, 𝜎 = √3𝜏, and Tabor factor, indentation hardness, H, is described by 𝐻 = 3√3𝛼𝜇𝑏√𝜌𝑇. Therefore, indentation size effect is represented by equation 𝐻 𝐻⁄ 0= √1 + ℎ∗/ℎ where
26
H is indentation hardness, H0 is macroscopichardness 𝐻0= 3√3𝛼𝜇𝑏√𝜌𝑠, h is indentation depth and
h* is characteristic length ℎ∗= 3𝑟̅tan2𝜃/2𝑏𝜌
𝑠. The macroscopic hardness H0 was found to increase and the indentation size effect characteristic length h* to decrease with increasing plastic pre-strain since initial statistically stored dislocation density is increased by pre-straining.
Indentation hardness of np-Au is increased with decreasing ligament size and decreasing indentation depth. Although there have been several studies about nanoindentation on np-Au, mechanism for indentation size effect in np-Au have not been studied. On the other hand, np-metals have a lot of free volume and surface area which make dislocation can be annihilated easily without multiplication or interaction. So, indentation size effect in np-metals cannot be explained by strain gradient and geometrically necessary dislocation in solid materials.
In this chapter, compressive and shear tests and nanoindentation on np-Au with different ligament size is performed to figure out mechanism for indentation size effect of np-Au. Also, nanomechanical modeling is suggested for numerical description of correlation between indentation size effect and ligament size effect.
3.1.1
Nanomechanical Modeling
I developed nanomechanics model to investigate indentation size effect behavior of np-Au using sharp Berkovich indenter regarding with ligament size. The sharp indenter is assumed to be serial stacking of infinite thin disk-shape flat punches (Fig. 3-1). While nanoindentation progresses to indentation depth of 𝛿ℎ, the circumference area, 2𝜋(𝑟 + 𝛿𝑟)𝛿ℎ, anew penetrates np-Au by shear force inducing plastic collapse. The volume of np-Au in touch with bottom penetrates by 𝛿ℎ in the loading direction with bottom area of π𝑟2 that is the summation of segment 𝜋(𝑟 + 𝛿𝑟)2− 𝜋𝑟2 from 0 to r with respect to r : ∑𝑟 [𝜋(𝑛 + 𝛿𝑟)2− 𝜋𝑛2] 𝑛=0 = ∑𝑟𝑛=0[𝜋 ⋅ 2𝑛𝛿𝑟]= 𝜋 ∫ 2𝑟𝑑𝑟 𝑟 0 = 𝜋𝑟 2. (3-1)
The unit length scale for plastic collapse of np-Au along the loading direction is assumed to be one cell size D, which consists of single ligament and single pore, and cell size is briefly assumed to be three times the ligament size 3l from measurement of average pore size. The relation between D and spacing of individual steps, s, is construed as
𝑡𝑎𝑛 𝜃 =ℎ 𝑟 = 𝛿ℎ 𝛿𝑟= 𝐷 𝑠, 𝑠 = 𝐷𝑟 ℎ, (3-2)
27
where θ is a contact angle between surface of sample and surface of indenter tip (19.7° for a Berkovich indenter) and r and h are contact radius and indentation depth, respectively, as shown in Fig. 3-1. The work introduced by nanoindentation, dW46 by indentation depth of 𝛿ℎ is expressed by
𝑑𝑊 = (𝑤comp+ 𝑤shear)𝑑𝑟𝑠. (3-3)
The work induced by shear and compressive forces, wcomp and wshear, described by 𝑤comp= 𝜎 ⋅ 𝜋𝑟2⋅ 𝐷, (3-4a)
𝑤shear= 𝜏 ⋅ 2𝜋𝑟 ⋅ 𝐷 ⋅ 𝑘𝐷, (3-4b)
where k is a proportional constant which means the number of cells deformed by shear force at the circumferential area 2𝜋𝑟 ⋅ 𝐷 along loading direction when indentation depth increases by D 47-48. σ and τ in Eqs. (3-4a) and (3-4b) are considered with the intrinsic irregularity of np-Au, not for
simplified nanoporous structure in simple stress modes48. The indentation force P can be construed as
𝑃 =𝑑𝑊𝑑ℎ = 𝜎 ⋅ 𝜋𝑟2+ 𝜏 ⋅ 2𝜋𝑟 ⋅ 𝑘𝐷. (3-5)
Relation between indentation hardness H and compressive strength σ can be described with plastic constraint factor Ψ as 𝐻 = 𝛹𝜎. By this relation, σ in Eq. (3-5) can be replaced by (1/𝛹)H0 since
σ is independent of indentation depth. Dividing both sides of Eq. (3-5) with 𝜎 ⋅ 𝜋𝑟2 yields the indentation size effect model for np-Au.
𝐻 𝐻0= 1 𝛹(1 + 𝐾 ℎ/𝐷), (3-6) where 𝐾 = 2 𝑡𝑎𝑛 𝜃 ⋅𝜏 𝜎⋅ 𝑘. (3-7)
H and H0 are the hardness and macroscopic hardness which is convergent with the hardness value at sufficient indentation depth, respectively. Ψ is the plastic constraint factor of np-Au, K is the characteristic length for the indentation size effect for np-Au, and h/D is the indentation depth normalized by cell size. The Eq. (3-6) is an inverse function of indentation depth similar to the Nix-Gao model for solid materials, which is 𝐻
𝐻0= √1 +
ℎ∗
ℎ, where h* is the indentation size effect characteristic length for solid materials45.
28
Figure 3-1 Nanomechanical model for sharp tip nanoindentation on np-material (adapted from Kim et
29
In the suggested indentation size effect model for np-Au, macroscopic hardness, H0, is dependent on 𝛹. At the beginning level of research related with mechanical behavior of np-Au, plastic constraint factor 𝛹was supposed to be 1 as porous materials with very low relative density12, 39. Recent
studies found that np-Au has plastic constraint factor in range of 2.65 to 3 similar to solid metals by comparing tensile and compressive tests41, 50-52. The characteristic length for the indentation size effect
for np-Au, K in Eq. (6) is independent of value of 𝛹.
Self-similarity in np-Au samples obtained from dealloying and post-heat treatment is an important factor to suggest universal indentation size effect model for np-Au with different ligament structure. Np-Au has random irregular ligament structure, thus mechanical properties are altered by connectivity and curvature evolution in np-Au. In this research, nanoporous structure is assumed to be self-similar. Geometrically self-similarity of np-Au is still controversial. Self-similarity in np-Au has been investigated by several researchers using destructive and non-destructive three-dimensional reconstruction, tomography and numerical analysis17, 37, 53-56. Kertis et al. demonstrated the evolution of
self-similar structure of np-Au using SEM analysis with ligament sizes from few nanometer to micrometer-scale obtained by dealloying and annealing treatment37. Hu et al. demonstrated that
ligament connectivity is self-similar in coarsened np-Au with genus parameter53. Chen-Wiegart et al.
measured three-dimensional structures of np-Au samples by X-ray tomographic reconstruction54. The
interfacial normal distribution(IND) and interfacial shape distribution (ISD) analysis suggested that distributions of surface orientation and scaled surface curvature were not self-similar during thermal coarsening. Mechanical self-similarity of np-Au was also discussed with regard to network connectivity55. The connectivity of each ligament was explained by introducing an effective relative
density, which was defined as a ratio of measured elastic moduli from compressive testing and elastic moduli expected by Gibson-Ashby model. According to change in effective density, the network connectivity of np-Au samples was gradually increased by increasing ligament size above ligament size of 150 nm due to volume contraction. Ziehmer et al. conducted three-dimensional FIB-based tomography for np-Au samples with ligament size of 25 nm in as-dealloyed sample to 420 nm in annealed at 300°C and concluded that coarsened np-Au might be self-similar56. Jeon et al., also
conducted 3D reconstruction of thermally-coarsened np-Au, and analyzed evolution of nanoporous structure during thermal coarsening17. In their research, it was found out that np-Au coarsens in
self-similar way in terms of distribution of ligament size, surface-to-volume ratio which means surface roughness of ligament, and scaled connectivity density. In this chapter, self-similarity of np-Au is assumed consistent during coarsening by annealing to simplify the theoretical approach.
30
3.1.2
Experimental Procedure and Results
3.1.2.1
Experimental Procedure
Precursor alloy of Au 30 at.% and Ag 70 at.% were prepared from Au (99.99%) and Ag (99.99%) pellets and liquefied together at high temperature by plasma arc-melting in an Ar environment. Alloyed precursor ingot was homogenized at 800℃ for 72 hours in a tube furnace under N2 environment
and cooled to room temperature in the furnace. Precursor ingot was cut and pressed to make 1 mm-thick plate-like shape. Top and bottom sides of the precursor plate were polished down to 0.25 μm diamond suspension. The samples were annealed in a tube furnace under N2 environment at 800℃ for
24 hours to homogenize and to release residual stress in precursor alloy generated by mechanical machining and polishing.
The np-Au samples were prepared from annealed precursor Au30Ag70 alloys by free-corrosion
dealloying. Dealloying process was executed in diluted nitric acid under different conditions in order to control ligament size: in 35% concentrated nitric acid at 20℃ for 72 hours, producing ligament size (l) 26 nm (hereafter called sample #1 (l = 26 nm)), in 35% concentrated nitric acid at 50℃ for 72 hours, producing ligament size 73 nm (hereafter called sample #2 (l = 73 nm)), and 35% concentrated nitric acid at 80℃ for 72 hours, producing ligament size 127 nm (hereafter called sample #3 (l = 127 nm)). These dealloying conditions were selected to get different ligament sizes based on the previous work57.
Through annealing of sample #3 (l = 127 nm) at 600℃ for 2 hours, ligament size 630 nm were obtained (hereafter called sample #4 (l = 630 nm)). Each np-Au samples were examined in field emission scanning electron microscopy (FE-SEM, FEI Nanonova 230). Average ligament sizes were measured from thickness of the thinnest necks at the ligament center from at least 100 measurements in SEM images. Surface morphology of four np-Au samples of ligament sizes 26 (±4.0), 73 (±8.8), 127 (±12.8), 630 (±61.4) nm is presented in Figs. 3-2(a)−(d).
Nanoindentations using sharp Berkovich indenter were performed on all four samples. Reproducible force versus indentation depth curves were obtained from over 12 tests. The maximum indentation depth in each sample was determined to be 40 times the size of the ligament, where cell size
D consists of single ligament and single adjacent pore, assuming a ligament size of three, 3l; that is, intended maximum indentation depth = 13.3D = 40l. The volume indented into maximum indentation depth contains 27000 cells approximately, and convergent trend in hardness was confirmed with increasing indentation depth as far as maximum indentation depth of 40l. Nanoindentations were carried out using continuous stiffness measurement (CSM) by XP module with load capacity 500 and DCM II module with load capacity 30 mN in a Nanoindenter G200 (KLA). All nanoindentation tests were
31
conducted at constant indentation strain rate 0.05 s-1, with allowable thermal drift limit of 0.05 nm/s.
Relative densities of the np-Au samples were calculated from direct measurements of external volume and weight. Np-Au cuboids of dimensions 0.8 mm × 0.8 mm × 1.2 mm for testing in both uniaxial compression and pure shear were prepared. Uniaxial compressive tests and pure shear tests were performed at constant displacement rate of 0.05 s-1 using a micro universal testing machine (Instron
5948) using custom-designed jigs. For each sample, reproducible force-displacement curves more than 4 time were obtained from compression and shear tests.
32
Figure 3-2 Surface morphology of np-Au samples from different dealloying conditions and annealing
33
3.1.2.2
Nanoindentation Results
Typical indentation force-depth curves for np-Au samples are shown in Fig. 3-3(a)-(d) and typical indentation hardness versus indentation depth for four np-Au samples are shown in Fig.3-3(e)-(h). Figure 3-3(a)-(d) show that higher force is required to penetrate certain indentation depth as ligament size decreases. That is conforming to previous researches that np-Au with smaller ligament size has higher indentation hardness12. Figure 3-3(e)-(h) show that hardness increases by decreasing
indentation depth for all np-Au samples, i.e. an indentation size effect in np-Au. Macroscopic hardness
H0 is convergent hardness value as increasing indentation depth. The macroscopic hardness for np-Au
samples were measured by averaging hardness values between indentation depths 30l and 40l where 40l is the maximum indentation depth; 106.1 (±4.52) MPa for sample #1 (l = 26 nm), 55.8 (±1.62) MPa for sample #2 (l = 73 nm), 26.5 (±1.34) MPa for sample #3 (l = 127 nm), and 3.0 (±0.11) MPa for sample #4 (l = 630 nm).
To compare trend in indentation size effect for np-Au with different ligament size, normalized hardness (H/H0) against normalized indentation depth (h/D) for np-Au samples relation are shown in
Fig. 3-4. By Fig. 3-4, it revealed that trends of indentation size effect for np-Au samples #1 (l = 26 nm), #2 (l = 73 nm) and #3 (l = 126 nm) are almost identical, whereas sample #4(l = 630 nm) shows enhanced indentation size effect above the other three. These results mean that np-Au obviously shows indentation size effect with ligament size of 26 nm to 630 nm and their trend of indentation size effect has transition depending on ligament size since indentation size effect curve for np-Au with coarsened ligament size doesn’t overlap to those of np-Au with smaller ligament size.
Indentation hardness versus indentation depth curves were fitted with Eq. (3-6) to examine consistency to np-Au samples and Fig. 3-5(a)-(d) show that Eq. (3-6) successfully explains the typical relation of hardness vs indentation depth for all four samples. The characteristic constant K in Eq. (3-6) is 0.52 (±0.15) for sample #1 (l = 26 nm), 0.54 (±0.20) for sample #2 (l = 73 nm), 0.52 (±0.30) for sample #3 (l = 126 nm), and 1.86 (±0.47) for sample #4 (l = 630 nm), respectively. Measured K values indicates that np-Au samples #1-#3 have almost identical indentation size effect propensity, on the other hand, indentation size effect behavior for sample #4 is increased over the other three as shown in Fig. 3-4.
34
Figure 3-3 (a)-(d) Force-indentation depth curves and (e)-(h) hardness-indentation depth curves on
35
Figure 3-4 Normalized hardness by macroscopic hardness versus normalized indentation depth by cell
size curves of np-Au samples (adapted from Kim et al., Copyright 2017 Elsevier49).
Figure 3-5 Typical hardness-indentation depth curves and fitted curves of np-Au samples (adapted from
36
A parameter in Eq. (3-7) is the ratio of shear strength over compressive strengths, 𝜏/𝜎, of np-Au which need to be measured. To get this strength ratio, uniaxial compressive tests and pure shear tests were performed for np-Au samples. Figs. 3-6(a) show typical compressive stress to compressive strain curves and Fig. 3-6(b) is enlarged graph of (a) at low strain and low stress range. In general, compressive stress-strain curves for np-Au samples show similar trend with compressive stress-strain behavior of cellular materials with three stages: linear elastic, plastic collapse, and densification39. Compressive
yield strengths, 𝜎 in Eqs. (3-4a) and (3-7), were determined by 0.2% offset method. Measured 𝜎 values were 122.6 (±1.16) MPa for sample #1 (l = 26nm), 41.5 (±4.30) MPa for sample #2 (l = 73nm), 22.9 (±0.96) MPa for sample #3 (l = 126nm), and 5.3 (±0.05) MPa for sample #4 (l = 630 nm). In Fig. 3-6(c), the relation between compressive strength and ligament size is presented in log-log scale. There is linear scaling relation in four np-Au samples about ligament size with slope of 0.98 where slope is size effect exponent, mcomp in 𝜎 = 𝑙−𝑚𝑐𝑜𝑚𝑝.
Typical pure shear stress to shear strain curves of np-Au samples are presented in Figs. 3-7(a) and (b). Samples #1~#3 show almost linear elastic deformation and catastrophic fracture. On the contrary, sample #4 (l = 630 nm) shows continuous strain-hardening after linear elastic region. And strain-softening with increasing shear strain after shear strain of 0.18 as partial cracks are generated. Shear strength 𝜏 in Eqs. (3-4a) and (3-7) are considered as measured shear yield strength : 52.0 (±10.56) MPa for sample #1 (l = 26 nm), 7.6 (±1.36) MPa for sample #2 (l = 73nm), and 1.5 (±0.34) MPa for sample #3 (l = 126nm), respectively. The shear yield strength of sample #4 (l = 630nm) determined by the 0.2% offset method is 0.3 (±0.06) MPa. The shear yield strength also shows strong ligament-size effect tendency with slope, which is size effect exponent for shear mode, mshear, is calculated as 1.60 in
𝜎 = 𝑙−𝑚𝑠ℎ𝑒𝑎𝑟., as seen in Fig. 3-7(c).
For samples #1~#3, deformation is concentrated at thinnest neck of ligament and cross-sectional area of ligament decreases during shear deformation of np-Au while nucleated dislocations from ligament surfaces are pile-up at thicker ligament junction. By necking of ligament, given stress is larger than load-carrying ability of ligament causing catastrophic failure in np-Au.
The shear stress-strain curve for sample #4 (l = 630nm) shows strain-hardening behavior that is ductile behavior on the contrary to other three samples. This indicates that there exist a transition in shear deformation mechanism from brittle to ductile between ligament size 126 nm (sample #3) and 630 nm (sample #4). In line with our results of ligament-size-dependent brittle to ductile transition in shear testing, it has been reported that transition of ductile and brittle fracture of np-Au is shown depending on ligament size in flexural testing58.
37
Figure 3-6 Uniaxial compressive stress-strain curves of np-Au samples and compressive yield strength
and ligament size relation (adapted from Kim et al., Copyright 2017 Elsevier49).
Figure 3-7 Shear stress-strain curves of np-Au samples and shear strength and ligament size relation
38
Fig. 3-8(a) shows the ratio of shear strength to compressive strength, 𝜏/𝜎, as a function of ligament size. The ratio 𝜏/𝜎 of four samples are less than one, in other words, shear strength is lower than compressive strength. Np-Au has random irregular nanoporous structure containing many dangling ligaments. During compression, these dangling ligaments might contact and support nanoporous structure additionally from external compressive loading inducing strengthening. On the other hand, ligaments are separated and become far from neighbors in shear testing and could not enhance strength of np-Au. This difference between pore closing during compression and pore opening during shear deformation could be attributed to that the ratio 𝜏/𝜎 is less than one. This asymmetry in strength have been noticed by some researchers. Balk et al., conducted milli-meter scale tension and compression test for polycrystalline np-Au with ligament size about 30 nm and reported a compressive strength of 15.5 MPa and a tensile strength of 11.5 MPa whose ratio of tensile strength to compressive strength was 0.7459. In tensile loading, pore opening mode is dominated while many separated neighboring ligaments
are further separated without any strengthening role, and grain boundaries might also weaken tensile strength of np-Au15. The ratio of tensile to compressive strength could be less than one for the same
reason. Whereas, it has been presented that single-crystalline np-Au with ligament size of 55.9 nm have a compressive strength of 22.5 MPa and a tensile strength of 25.3 MPa. This result yields a ratio of tensile strength to compressive strength of 1.1260.
Based on measured the ratio 𝜏/𝜎 and characteristic constant K, calculated values of k are presented in Fig. 3-8(b) and it shows that k values are dependent on ligament size. Figs. 3-8(a) and (b) give clue to understand ligament-size related indentation size effect trend in np-Au. For samples #1~#3, as ligament size increases, the ratio of shear strength to compressive strength, 𝜏/𝜎, decreases and k
increases, and multiplication of 𝜏/𝜎 and k yields almost same characteristic constant K in Eq. (3-7). Sample #4 (l = 630 nm) has much higher k value than other three samples since the constant K is higher than three samples and the ratio of 𝜏/𝜎 of sample #4 is similar to sample #3. In other words, sample #4 shows enhanced indentation size effect behavior comparing with np-Au with smaller ligament size.
39
Figure 3-8 Relation between (a) shear strength/compressive yield strength and ligament size and (b)
40
3.1.3
Ligament Size Effect and Indentation Size Effect Relation
As discussed in previous section, both compressive and shear strength have ligament size dependency shown in Figs. 3-6(c) and 3-7(c). But the ratio of shear strength to compressive strength decreases as ligament size increase and slightly alleviate for sample #4 (l = 630 nm) described in Fig. 3-8(a). This trend comes from difference in the size effect exponents m, i.e. the slope of strength vs ligament size curve in log-log scale in Figs. 3-6(c) and 3-7(c). The size effect exponent for compressive strength, mcomp, is 0.98 (Fig. 3-6(c)) and that for shear strength, mshear, is 1.60 (Fig. 3-7(c)). The size
effect exponent for shear strength is 39% greater than that for compressive strength, which is caused by difference in deformation mode for shearing and compression.
It has been reported from many studies that yield strength of nanostructured materials indicates powerlawtype dependence on characteristic length. Briot and Balk reported power law exponent of -0.551 function of ligament size on yield strength obtained from converted yield strength from nanoindentation hardness, which reported by Hodge et al., with a plastic constraint factor 𝛹 of 2.6512, 41. McCue et al., analyzed the power law exponents calculated from experimental data obtained by 6
different mechanical tests reported by 17 previous research articles51. Upper and lower boundaries for
the power law exponents are -0.97 and -0.73, respectively. Obtained mcomp of -0.98 for compressive
yield strength in this study is in good agreement with this trend. Li and Sieradzki have reported ligament size dependent change in fracture stress with power law exponent of -0.2 from three-point bending tests58. Badwe et al., recently reported the power law exponent of -0.23 for tensile fracture stress for
brittle fracture region corresponding to ligament size smaller than about 220 nm61. Mameka et al.,
recently found that phenomena that strength and hardness of np-Au increase as ligament size decreases is universal, but the power law exponents that had reported are quite diverse depending on materials and mechanical tests62.
Greer et al., measured compressive flow stress at 10% strain for Au micropillars with diameters ranging from 300 nm to 7450 nm9. They found that the relation between flow stress and
micropillar diameter can be described with two power-law exponents in transition at critical pillar diameter of about 1000 nm. Brinckmann et al., showed that size-dependent compressive strength of Au nanopillars is described with the power law exponent of -0.9763. The Hall-Petch relationship describing
dependence of yield strength on grain size for nanocrystalline metals shows the power law exponent of -0.564. Deformation mechanism in np-Au might be similar to that of Au nanopillars in terms that mobile
dislocations can escape at free surface due to external size of sub-micron scale, whereas dislocations can pile up at grain boundaries in nanocrystalline metals65. While entire volumes of nano- and
micro-pillars are in uni-axial stress and strain conditions, ligaments in np-Au have surface curvature and irregular distribution in size and orientation introducing complex stress and strain in the ligaments, hence power-law exponents could be different from Au nano- and micro-pillars.