Investigating the Relationship between faculty perception of
educational technology and the level of technology integration into
teaching and learning
By
Ahmed I Fallatah
© 2019Submitted to the graduate degree program in Educational Leadership and Policy Studies and the Graduate Faculty of the University of Kansas in partial fulfillment of the requirements for the
degree of Doctor of Philosophy.
Chair: Dr. Yong Zhao
Dr. Bruce Frey
Dr. Suzanne Rice
Dr. John L Rury
Dr. Robert Isaacson
,
The dissertation committee for Ahmed I Fallatah
certifies that this is the approved version of the following dissertation:
Investigating the Relationship between faculty perception of
educational technology and the level of technology integration into
teaching and learning
Chairperson, Dr. Yong Zhao
Abstract
There are three main research goals of this study. The first one is to examine the level of technology integration into teaching by Saudi university faculty members. The second goal of
this study is to investigate Saudi university faculty members’ perceptions of educational
technology. The third and most important one is to investigate whether there is a relationship between faculty perception of educational technology and the level of technology integration into
teaching and learning. A quantitative approach was employed to organize, collect, test and analyze
the data.
Analysis of self-report survey data from 306 Saudi university faculty members showed that Saudi university faculty members use technology in their teaching at three different levels of the T3 technology integration model; the most used level is the translational level (M = 5.35, SD = .499), the second most used is the transformational level (M = 4.8, SD = .84), and the third most used is the transcendent level (M = 4.6, SD = 1.10).
Five educational technology concepts were examined to investigate Saudi university faculty members’ perceptions of educational technology. The overall trend of the findings of this section suggests that there is no definite answer. Therefore, we cannot conclude whether there is misconception or not. For the first four concepts, the mean of the answer centered around 3 (somewhat disagree). Onley the fifth concept confirmed a trend toward the disagreement, meaning that there is misconception or misunderstanding about this concept.
Regression analysis found that there is a relationship between the perceptions of educational technology and educational technology integration by faculty members in Saudi Arabia. By and large, all regression models in this study were statistically significant, indicating that perception concepts are good at predicting the level of technology integration into teaching.
Dedication
This study is wholeheartedly dedicated to;
My inspiring father and mother, who have been my source of inspiration and who continually provide their moral, spiritual, emotional, and financial support.
To my beloved wife Mona whose unconditional encouragement, support and patience made it possible for me to complete my PhD degree. You are my life partner, and I am so thankful we did this together. Thank you for being my wife.
To my kids, Azzam, Alaa, and Ghaidaa who have been a source of joy, happiness, and enthusiasm.
Also, I would like to dedicate this study to my brother, sisters, nieces, and nephews who supported me in my academic journey.
Acknowledgment
In the name of Allah, the Most Gracious and the Most Merciful. All praises to Allah for providing me with the strength and His blessing to complete this study. Special appreciation goes to my supervisor, Professor, Yong Zhao for his supervision and constant support and
collaboration. I very much appreciate his invaluable help in reading, revising, editing, and strong feedback to produce this study.
I would like to extend my sincere thanks to the distinguished faculty members who served on my committee: Dr. Bruce Frey, Dr. Suzanne Rice, Dr. Robert Isaacson, and Dr. Young-Jin Lee for their insightful criticism, encouragement and suggestions that aided the writing of this work in innumerable ways. Not forgotten, my appreciation also goes to my
previous advisor Dr. Ron Aust for his support and knowledge during my academic journey in the University of Kansas.
Last but not least, I would like to express my deepest gratitude to my family and friends. This study would not have been completed without their warm love, continued patience, and endless support.
Table of Contents Abstract ... iii Dedication ... iv Acknowledgment ... v CHAPTER I: INTRODUCTION ... 1 Introduction ... 1
The purpose and research questions ... 4
Significance of the Study ... 4
CHAPTER II: LITERATURE REVIEW ... 6
Introduction ... 6
Technology impact on education ... 6
Non-transformative use of educational technology ... 8
Transformative use of educational technology? ... 11
What effects does the transformative use of educational technology have: Barriers to technology integration? .. 15
Faculty belief and technology integration ... 16
Diffusion of innovation theory ... 19
CHAPTER III: METHODOLOGY ... 21
Introduction ... 21
The purpose of the study ... 21
Research design ... 22
Research questions ... 22
Research Hypotheses ... 23
Research hypotheses’ connection to literature review ... 23
Data collection procedures ... 24
Description of the Variables ... 25
Research Sampling ... 25
Human Subjects’ Committee Approval ... 26
Instrumentation ... 26
Reliability and validity ... 28
Translation of the instrument ... 29
Data Analysis ... 29
CHAPTER IV: RESULT ... 30
Introduction ... 30
Description of Population and Sampling ... 30
Demographic Description ... 32
Participants’ sex ... 32
Participants’ Academic Ranks ... 32
Participants’ Years of Teaching Experience ... 33
Participants’ college ... 33
Participants’ nationality ... 34
Participants’ Graduation country ... 35
Reliability Analysis ... 35
Findings of the Research Questions ... 36
Question one ... 37 Question Two ... 39 Question three: ... 42 Chapter Summary ... 48 CHAPTER V: DISCUSSION ... 49 Introduction ... 49
The purpose of the study ... 49
Research Hypotheses ... 50
Interpretation of the Findings ... 50
Implications ... 60
Limitations of the Study ... 62
Suggestions for Future Research ... 63
Conclusion ... 64
References ... 66
Appendix ... 75
Appendix A: Study Survey ... 75
Appendix B: IBR approval of initial study ... 84
Appendix C: Sample information statement ... 85
Appendix D: T3 Framework ... 86
Lis of Table
Table 1. Number of Participants Based on sex ... 30
Table 2. Number of Participants Based on academic ranks ... 32
Table 3. Years of teaching experience ... 33
Table 4. school/college ... 34
Table 5. Nationality ... 35
Table 6. Participants’ Graduation Country ... 35
Table 7. Current Reliability Coefficients ... 36
Table 8. Technology integration level ... 39
Table 9. Technology integration level ... 42
Table 10. Regression model – Question 3-a. ... 43
Table 11. Regression model – Question 3-a. ... 43
Table 12. Regression Coefficients – Question 3-a. ... 44
Table 13. Regression model – Question 3-b ... 45
Table 14. Regression model – Question 3-b. ... 45
Table 15. Regression Coefficients – Question 3-a. ... 46
Table 16. Regression model – Question 3-c. ... 47
Table 17. Regression model – Question 3-c. ... 47
CHAPTER I: INTRODUCTION Introduction
As technology use continues its steady growth in educational practice, educational technology has not yet transformed or fulfilled its full potential to improve education (Bottino, Forcheri, & Molfino, 1998; Ginserb & McCormick 1998; Keengwe, Onchwari, & Wachira, 2008). In other words, Technology has not yet solved many significant educational problems, especially on the large scale (Zhao, Zhang, Lei & Qiu, 2015).
There is a growing concern about the missing benefits of educational technology. For example, on the higher education level, Geoghgan (1994) noted that despite the greater
availability of technology at reasonable prices, a growing familiarity with technology by faculty, and the large investments in technology for student and faculty use, instructional technology is not being used in the classrooms of higher education at the level of early
expectations. Broad, Matthews, & McDonald (2004) argued that higher education is slowly embracing the opportunities that educational technology offers. It is believed that despite the adoption of educational technology in higher education since the
mid-1990s, no significant change in learning and teaching has occurred as many had anticipated (Kirkup, Kirkwood, 2005).
There are two issues related to why technology does not improve learning outcomes: the quantity and the quality of technology use (Lei & Zhao, 2007). The quantity of technology use in education deals with how much technology is available in the classrooms and how frequent teachers use those technologies in their instruction. Currently, students and teachers have an adequate access to technology in classrooms, which is attributed to the great investment in online learning and educational technology.
Governments worldwide are investing heavily in online learning and educational
technology (Amiel, 2008). In 2003, researchers have estimated that more than 70 billion dollars was spent on educational technology infrastructure and training in the past ten years in the United State alone (Dickard, 2003). In Saudi Arabia, the government has allocated 3.1 billion Saudi Riyals (SAR) to develop the technological and scientific facilities in Saudi universities (27 universities) (Alharthi, Alassafi, Walters, & Wills, 2017). In 2008/2009, UK schools spent £880 million (or 3.2% of overall spend) on educational technology (Livingstone, 2012).
In recent years, the field of education in the United States, Britain, Europe and elsewhere has seen a wide spread of digital and networked technology in the classroom (Rudd et al., 2009; Korte & Husing, 2006; Paige, Hickok, & Patrick, 2004). Interactive whiteboard, virtual learning environment, educational computer games, and educational internet applications are more presently used in classrooms (Sheard & Ahmed, 2007). Generally, the mainstream of literature concerning technology use in education focused on the quantity of technology use (Lei & Zhao 2007).
On the other hand, over the last several years, the quality of technology use has gained more recognition and attention. Educators has recognized or realized that technology does not make difference unless it is utilized properly (Lei & Zhao, 2007). According to King (2002), "The public and educators alike have realized that just having the technology in place does not immediately result in it being used to further educational attainment" (p. 284). Educational technology can be used effectively depending on how it is used, by whom, and for what purposes (Burbules & Calister, 2000). Even though the quantity of technology use has increased,
we cannot conclude that the quality of education has improved. Abrahams (2010) stated that "infusion of educational technology on college and university campuses for faculty and student
use does not always result in its successful integration into either instruction or the campus" (p. 35).
Although educational technology is being used in the classroom more frequently than ever, it has not been utilized properly or effectively. Factors leading to such improper use and poor adoption by teachers and faculty members include organization policy and support, time availability, and teachers and faculty preparation. Additionally, many research teams (Blin, Munro, 2008, Keller, 2005, Kirkup, Kirkwood, 2005, Selwyn, 2007, Senik, Broad, 2011, Watty, McKay & Nago, 2016) have reported teachers and faculty personal resistance and personal attitude as fundamental barriers to technology adoption.
Ertmer (2005) argued that teachers and faculty beliefs is the largest barrier to technology integration. Kagan (1992) defined teacher beliefs as “tacit, often unconsciously held assumptions about students, classrooms, and the academic material to be taught” (p. 65). In order to help teachers and faculty use technology to enhance the curriculum, teachers' and faculty' values and beliefs need to be included on conversations on best educational technology practices
(Ottenbreit-Leftwich, Glazewski, Newby, & Ertmer, 2010). Also, it is important to understand the context of technology and education in the large culture including the perceptions of faculty, students, and other stakeholders, and understanding the real reasons for technology use and the lack thereof(Nicolle, 2005).
Zhao (2015) claims that technology has not transformed education due to five educational technology mistaken conceptional approaches that dominated the practice of educational
technology field. Technology failed to transform education because of the prevalent mindset of using technology to improve the traditional paradigm of education. In order to use technology to transform education we need to examine the prevalent mindset among faculty members and its
relation to the level of technology integration. Thus, we can answer the question: does perception matter?
The purpose and research questions
The purpose of this study is to examine the level of technology integration into teaching and learning by Saudi university faculty members. Another goal of this study is to investigate
Saudi university faculty members’ perceptions of educational technology. This study will also
investigate whether there is a relationship between faculty perception of educational technology
and the level of technology integration into teaching and learning.
Significance of the Study
The dynamic and the growing speed of education technology give educators and researchers limited time to reflect and investigate this technology. That is why we missed the potential power and opportunities of educational technology. Pointing out to educational technology, Zhao (2015.p1) stated, " Every cycle started with amazing euphoria and then ended with disappointing outcomes. But somehow, we managed to forget the failures. We did not even stop to reflect what went wrong because new technology emerged, with more power and thus more hope". Therefore, understanding the faculty perception of educational technology and their technology skills level in relation to technology integration would be an important step in the right direction to successfully integrate technology into instruction.
Gaining the best educational technology practices that lead to the development of educational outcomes helps to preserve state resources and not waste money in failed
experiments and projects. As noted above, Governments around the world are investing heavily in online learning and educational technology (Amiel, 2008). For example, In the Middle East, where this study will be conducted, governments have been authorizing almost 19% of their countries' government expenditure to education (“School of the Future," 2018). Saudi Arabia
education system budget is expected to augment to about USD 15 Billion by 2021. UAE education sector is expected to grow at a CAGR (CompoundAnnual Growth Rate) at 4.74 % between 2018-2022 (“School of the Future," 2018).
Many Middle Eastern countries have ambitious goals for utilizing technology to transfer education. However, the lack of teachers and faculty capable of using technology in innovative ways is one barrier that is standing in their way (Cavanagh, 2017). Understanding faculty perceptions of technology helps in designing professional development programs targeting faculty and classroom teachers and assisting in deducting value beliefs associated with professional needs. Educators are under pressure to integrate technology into teaching and learning by the media, accreditation organizations, teachers’ administrations, state department of education, and ministry of education. Literature has provided educators with ideas and guidelines to effectively integrate technology into teaching and learning, but it falls short of providing cohesive guidelines for teachers and faculty professional development (King, 2002).
CHAPTER II: LITERATURE REVIEW Introduction
This dissertation is concerned with faculty perception of educational technology in relation to technology integration level. This chapter is divided into five sections that address the components of the study: (1) technology impact on education, (2) non-transformative use of educational technology, (3) transformative use of education technology, (4) what affects transformative use of education technology - barriers to technology integration, and (5) faculty belief and technology integration.
Technology impact on education
Despite the fact that technology has impacted every aspect of our lives, there is no robust evidence technology is enhancing and transforming education. Goodchild (2018) argues that there is a lack of systematic evidence supporting the enhancement offered by technology, and "technology enhanced learning is predicted on the promise of potential and purported
transformation of teaching and learning" (P. 1). The argument that educational technology has not yet transformed education and has not yet fellfield its potential to improve education has been there for years (Bottino, Forcheri, & Molfino, 1998; Ginserb & McCormick 1998; Keengwe, Onchwari, & Wachira, 2008). According to Zhao, Zhang, Lei & Qiu (2015) the impact on education has been extremely limited, and technology has not solved many significant educational problems on a large scale.
Furthermore, some believe that the rapid and heavy communication technology use in the classroom has negative effects on students' academic performance. For example, a study (Lei, & Zhao, 2007) found that students can benefit from spending up to 3 hours per day using a
computer. However, if they spend too much time (more than 3 hours a day) on computer, their GPA will likely decrease. A qualitative study by Chou (2001) with Taiwanese students shows
that heavy internet use is correlated with poor academic performance. Chen and Peng (2008) found that students who are heavy internet users (more than 34 hours per week) had lower grades and lower learning satisfaction than non-heavy users. Fried (2008) reported a negative effect of laptop use in class on academic performance due to distraction.
Technology has introduced a new kind of instruction. In the last two decades, online and distance learning became a prominent part of the higher education system. However, the
question remains whether online and distance learning are transforming education. Summers, Waigandt & Whittaker (2005) examined differences between online distance education and traditional classroom learning for undergraduate statistics course in terms of final grades and student satisfaction. The result indicated that there was not significant differences in grades between online students and face-to-face students. However, online students were significantly less satisfied with the course than face-to-face course students. York (2008) compared students' educational outcomes for a social work course that was offered in 3 formats: face-to-face, online, and hybrid. Course materials, assignments and time were the same for each group. The results showed no differences among these 3 groups in final grade, course content self-efficacy gain, or student satisfaction. The results from those study suggested that online instruction has no advantages over traditional instruction.
On this basis, one could argue that even when new technology tools are used, classroom practice remains fundamentally unchanged (Bottino, Forcheri, & Molfino, 1998). That is because technology has not changed what is taught, but merely the mode of delivery has reformed.
According to Kirkwood, & Price (2013, p. 333) " Despite much talk about the potential of technology to transform teaching and learning in Higher Education, very often the reality is different with much university teaching remaining fundamentally unchanged"
Non-transformative use of educational technology
Technology has been widely used in classrooms; however, it is being used in a non-transformative way or it is being used at only a fraction of its potential. For the most part, teachers and faculty who use technology in their teaching do so by having electronics simplify tasks, not by fundamentally changing how the subject is taught. For example, they translate lecture notes into PowerPoint presentations, and use course management tools to distribute course materials, assignments, and grades (Zemsky, Massy, 2004). On this regard, there is a gap between faculty and students use of technology on higher education. Faculty use of technology in instruction does not meet the students' expectations. Most faculty use technology more for administrative and research tasks. They mostly use technology such as word processing and email for communication and research rather than using technology such as the use of multimedia, course management system, asynchronous communication and social media for instruction (Kazley, A., Annan, D., Carson, N., Freeland, M., Hodge, A., Seif, G., & Zoller, J.
(2013). Zhao, Zhang, Lei, & Qiu, (2015) argued that what is being done in the educational
practice with technology is just assigning some current routine teaching responsibilities to technology. The teacher still "serves as the authority of knowledge and transfer their knowledge to students" (p. 36).
Magana (2017) introduced the T3 framework, which classifies technology integration into three domains: translational (automation, consumption), transformational (production, contribution), and transcendent (inquiry design, social entrepreneurship). The translational level is the lowest level of technology integration in the T3 framework, in which the technology is used to do old tasks in a new way using a digital tool. Most of today education technology practice fall in the lowest level of technology integration. This is unfortunately a factor why technology has a limited impact in our teaching and learning (see appendix D: T3 framework).
Megana (2017) defines translational level as " transferring or bearing something or some task across two different temporal modalities" (p. 27), such as the translation of a message from one language into another. In this case, we just use a different method to generate the meaning while the meaning of the message stays the same. The translational integration level consists of two steps: T1.1: automation and T1.2: consumption. Both levels can be used as a guide to utilize educational technology tool in administrative, instructional or learning tasks (Megana,2017).
The translational level is classified into two domains. Automation is the step where a teacher or student use technology to automate the instructional or learning tasks. For example, instead of using pencil and paper to write an essay, students can be asked to use word processing software. The values of such automation are saving time, increasing efficiency, and improving accuracy. Regarding educational technology practice, most teachers fall in automation level (Thornburg, 2013). This is a very low level of integration. However, this level is important and can add value to the teaching and learning experience, but it does not directly affect the process of teaching and learning. It is more important in terms of increasing the speed, the efficiency, and the accuracy of administrative tasks. If the teachers need to improve their technology practice in the classroom, they are going to have to go through to the next step (Megana,2017).
The second step in this level is consumption where the technology is used to consume information in a digital medium. Megana (2017) defines consumption in the context of education as " the task of accessing some digital form of content-related information of knowledge" (p. 31). The digital form could be any type of media such as textual, auditory, visual or in some
combined multimedia format. Because of the availability of digitally accessible content
information in a variety of forms, teachers no longer need to depend on a textbook as a source of information (Megana,2017). In order to witness a crucial impact, we need to move beyond the
translational level to transforming current practice then approaching and adopting transcendent uses of technology.
Zhao, Zhang, Lei, & Qiu, (2015) considered using technology for consuming existing knowledge one of the mistaken approaches that prevent transformative use of technology and therefore prevent transforming education. Using technology to consume knowledge is based on the traditional assumption about how students learn, which assumes that students learn by absorbing and consuming existing curriculum. Therefore, technology is there to help them learn the existing knowledge better.
Also, we used to focus our practice in the classroom around the medium, therefore, we blame the medium for any failure. These kinds of practices are based on displacement theory and media comparison studies. The idea of displacement theory and media comparison studies are driven by an assumption that media are a hierarchy and that we better rank them to use the best of them in our teaching (Zhao, Zhang, Lei, & Qiu, 2015).
A large body of research in the field of educational technology was conducted based on the view of displacement theory and media comparision studies. This type of studies commonly compares tow type of educational technology such as comparing a TV with a radio and a computer with a tablet (Zhao, Zhang, Lei, & Qiu, 2015). However, according to Zhao, Zhang, Lei, & Qiu, (2015) employing a specific technology to deliver instruction will not improve teaching and learning. Richard & Clark (1983) pointed out that " Based on this consistent evidence, it seems reasonable to advise strongly against future media comparison research. Five decades of research suggest that there are no learning benefits to be gained from employing different media in instruction, regardless of their obviously attractive features or advertised superiority" (p. 450).
Non-transformative use of educational technology is centered around the definition of educational outcomes, which is broadly represented by test scores. Test scores play a crucial role in most aspects of schooling, such as school funding, teacher evaluation, and student recruitment. In other words, higher test scores mean the student has more opportunities to be admitted to university or college, teachers get merit pay, and administrators get better funding and attracting qualified teachers. While this is the case, technology is treated and expected by many to improve student test scores. If technology failed to significantly improve test scores, the doubt and
disappointment will be directed at educational technology (Zhao, Zhang, Lei, & Qiu, 2015). For example, Richtel, M (2011) in his article in New York Times questioned whether investments in educational technology were worth it. Richtel reported a case of the Kyrene School District, which is considered an exemplary school district for technology integration by the National School Boards Association and has earned widespread praise. However, the test scores were unfortunately disappointing, so the Kyrene School District cast doubt about educational technology investment. Some school districts have abandoned one-to-one laptop programs since those programs showed “little, if any, measurable effect on grades and test scores” (Hu, 2007.p.7).
Transformative use of educational technology?
Transformative use of educational technology that transfers education requires a new way of thinking about educational technology adoption and classroom practices, which go beyond current traditional practice. It is important to reconsider the relationship between human and technology. For decades, questions about the relationship between technology and teacher have been posed, such as: will TV replace teachers? Will computers replace teachers? Will online education replace teachers? Will tablets replace teachers? A large body of research is focused on
asking whether certain educational technologies are better than or could potentially replace teachers. These types of questions are based on displacement theory and media comparision studies. The idea of displacement theory and media comparison studies are driven by an
assumption that media are a hierarchy and that we better rank them to use the best of them in our teaching (Zhao, Zhang, Lei, & Qiu, 2015).
The ideal use of technology includes all components of the educational environment. Each component of the ecosystems has its own role to play. On top of that, in the learning environment each component has its important role, especially the teacher, who has a particular function that other components in the system do not have or cannot replace (Zhao, Zhang, Lei, & Qiu, 2015). The idea of viewing learning environment as an ecosystem is to focus on the
strengths and weaknesses of each component in the system taking into consideration the
interrelationship among those components. Zhao, Zhang, Lei, & Qiu (2015) stated that " we need to first analyze the strengths/niches of computers and humans and then construct a learning environment that taps the strengths/niches of both" (p. 13). The central idea according to Levy and Murnane (2013) is "to let computers (i.e., robots) do what they are good at, and humans should be trained to do what computers don’t do" (p. 6).
Therefore, what are the things the computer can do better and what are the things the human can do better? the human mind's strengths are flexibility and the ability to process and integrate complex tasks, while the computer’s strengths are speed and accuracy (Levy, Murnane, 2013). Also, technology is better at mechanical repetitive tasks as well as creative ways of presentation and interaction. On the other hand, humans are better at critical thinking and social and emotional interaction (Zhao, Zhang, Lei, & Qiu, 2015).
Transformative use of educational technology views students as knowledge creators. Students learn better by constructing their own knowledge, creating projects, initiating communication, and sharing their experiences and feelings (Zhao, Zhang, Lei, & Qiu,
2015). Magana (2017) classified in his T3 framework of technology integration technology use to create and share knowledge as the second level of technology integration (transformational level).
In transformational level, “technology must give rise to dramatic or substantive changes in both the task to which the technology tool is applied and the person enacting the task” (Magana 2017, p. 38). According to Magana (2017) "transformational technology use in education is the intentional application of digital technologies to unleash students' learning expertise, in a way not possible without technology, to achieve ever higher levels of knowledge and mastery" (p. 39). Put differently as Magana stated, " How can students use technology to represent what they know, what they are able to do, how they think, in ways that are not possible without the technology" (p. 41). The transformational integration level consists of two steps: production and contribution.
Production: the production step refers to the use of technology to produce a digital
representation of students' knowledge and the path to this knowledge. Magana (2017) argues that the definition of production in educational context must be broad to include three critical
elements: (1) “student production of authentic evidence of growth and mastery using digital tools,” (2) “the quality of knowledge artifacts that students produce with digital tools,” and (3) “the thought pathways students have followed to create those artifacts” (p.42).
Magana (2017) suggested three strategies teachers can use to implement production steps. The first step is for students to produce personal mastery goals. In this strategy, teachers help students to establish meaningful learning goals and then keep track of their progress. Second,
students track and visualize their growth and mastery. In this strategy, teachers motivate students by giving them the opportunity to regularly track their own progress towards mastery. The third and final step is for students to produce and archive authentic knowledge and thought artifacts. This strategy involves " students using digital tools to create an authentic multimedia
representation of their declarative and procedural knowledge and to make their thinking regarding both explicit" (p. 47).
Contribution: In this level, students use technology to produce and present digital
artifacts to others. It is important in this stage to develop an interdependent learning environment that functions as a learning community. It is also important to express to students from the beginning that the goal of designing and creating knowledge products is to contribute their own perspective and understanding to the knowledge gains of others.
With a transformative use of educational technology students can achieve something well above and beyond the normal range of expectations, outcomes, and experiences in traditional classrooms. This level of technology use is represented in the third level of Megana T3 framework of technology integration، which is the transcendent level. In transcendent level student's passion is a key element. What students deeply care about is what pushes them to exceed their expectations and to enable maximum growth in the learners' cognitive capabilities (Megana,2017: Wang, 2018). The transformational integration level consists of two steps: inquiry design and social entrepreneurship.
Inquiry design: in this level students use technology to design their own learning journeys guided by their passion to solve real-life problems they deeply care about. In this step, students use technology to investigate the problem that matters most to them by asking the proper
questions that precisely address the problem, hypothesizing plan and goals, then finding a robust digital solution (Megana,2017).
Social entrepreneurship: in this step, students engage in "social entrepreneurship activities may serve to unleash learners’ latent leadership potentially by framing the generation of value within the context of solving wicked problems that matter" (Megana,2017, p. 67). To implement this stage of technology use Megana (2017) suggested three strategies: (1) " student imagine, design, and create new tools or platforms to solve wicked problems that matter"(p. 77), (2) " student beta test., Iterate, and generate robust versions of their digital solutions"(p. 80), and (3) students scale the implementation of their robust digital solutions" (p. 82).
What effects does the transformative use of educational technology have: Barriers to technology integration?
Technology integration is a leading trend in contemporary education practice (Tsai, Chai, 2012). However, there are many factors that affect faculty technology integration into
instruction. According to Compeau, and Higgins (1995) these factors have been an issue since the 1970s. Researchers use different definitions of barriers and classification schema to
understand how barriers influence technology adoption, and to explain how faculty and administration react to emerging technology and changing learning environment (Abrahams, 2010).
Ertmer (1999) developed a framework that divided technology integration in education barriers into first and second order barriers. The model built upon Fullan and Stiegelbauer (1991) concept of first and second order models of change. Some refer to these barriers as internal and external barriers (Minshew, Anderson. 2015). The first-order barriers represent the external factors that may constrain technology integration. The second-order barriers represent internal factors that affect technology integration.
First-order barriers are those barriers related to institutional resources such as technical support, technical infrastructure, having access to available technology, time with technology,
and training and development programs (Hew & Brush, 2007). External barriers can be classified into three categories: connectivity, establishing a reliable technical infrastructure that guarantees permeant accessibility to technological services; professional development, which is needed to be structured to fit the technology needs of teachers; application acquisition, which encompasses the policies and procedures that exist within the institution to organize technology practice (Hew, Brush, 2007).
Internal barriers are much more personal and intrinsic and more deeply ingrained to instructors. The internal barriers can prevent instructors from utilizing technology in teaching even if there are no external barriers. According to Hew and Brush "These barriers included, but were not limited to, teachers’ knowledge about technology, a perception of their technology practice and the value of the technology itself" (2007. p3).
Tsai (2012) suggested discussing and adding one more barrier that is the teacher's design thinking. Tsai argues that " if both first-order and second-order barriers have been removed, will technology integration happen" (2012. p2). Even if the instructor was provided with a well-built facility, an acceptable technical infrastructure, digital resourses, positive attitude and strong beliefs in technology, and appropriate technical skills, he/she may not necessarily have
successful technology integration. This is due to the lack of design thinking, which is crucial to reorganizing and creating instructional materials and activating that fit varying group of learners in this dynamic learning environment.
Faculty belief and technology integration
The past thirty years have seen an increasingly rapid discussion among educators regarding technology integration into instruction (Lowther, Strahl, Inan, & Ross, 2008). Considerable articles and books have been published proposing effective strategies to promote meaningful integration. A great portion of these articles focus on how to approach and eliminate
barriers that instructors and educational institutes encounter during the process (Ertmer, et al., 2012).
Ertmer (2005) argues that key components of technology integration barriers have been nearly addressed and resolved. Becker (1949) identified fours conditions that the teacher should meet to successfully integrate technology into instruction: (a) have convenient access, (b) are adequately prepared, (c) have some freedom in the curriculum, and (d) hold personal beliefs aligned with constructivist pedagogy. According to Ertmer (2005), the first three of these conditions appears to be in place. The National Center for Education Statistics reported that the ratio of students to an available computer has reached 1.7 across all public schools (Gray, Thomas, & Lewis, 2010). One-on-one laptop initiatives aiming to provide constant access to at least one computing device for every student in a classroom have advanced across multiple states (Zheng, et al., 2016).
However, recent researches have shown that the current level of technology integration is still surprisingly low, (Ertmer, 2005), and yet not advanced to the best practice advocated in the literature (Dede, 1998: Ertmer, 2005). Increasing access to the technology does not mean higher quality technology integration (Ertmer & Ottenbreit-Leftwich, 2010). Ertmer (2005) attributed that to additional barriers, specifically related to instructors' pedagogical beliefs which is much less understood and, consequently, less readily resolved. According to Ertmer, “Previous researchers have noted the influence of teachers’ beliefs on classroom instruction specifically in math, reading, and science, yet little research has been done to establish a similar link to
teachers’ classroom uses of technology" (2005. p 25).
Instructors' beliefs have not yet been understood due to in part the fact that changing instructors' beliefs confronts instructors' fundamental belief, and thus, requires new ways of both seeing and doing things. Nevertheless, changing first-order barriers requires adjusting current
practice in an incremental fashion without chaining existing structures or beliefs. Additionally, first-order changes are reversible, while second-order changes are irreversible, and it is hard to return to the previous routines and habits once you begin a new one (Brownlee, 2000). These types of "changes are riskier for teachers, as well as more difficult to achieve" (Ertmer 2005. p 26). Furthermore, staff developers are much less familiar with how to facilitate and support these types of changes (Garet, Porter, Desimone, Birman, & Yoon, 2001).
Instructors’ beliefs, attitudes, and perceptions of education technology was found to be a fundamental factor in the level and quality of technology integration in the classroom
(Ottenbreit-Leftwich et al., 2010). In 2007, Hew and Brush conducted a study that analyzed technology integration barriers that have been identified in the literature over ten years (1995-2006). Based on the analysis of 48 empirical studies, the three most frequently cited barriers to technology integration are recourses, teachers' knowledge and skills, and teachers' attitudes and beliefs (Hew, & Brush, 2007).
The beliefs teachers hold affect their practice in the classroom. Those who hold more positive attitudes toward educational technology are more likely to use technology in delivering curricular contents (Mueller, Wood, Willoughby, Ross, & Specht, 2008), restructure learning goals (Miranda and Russell, 2012) and adopt more student-centered and cognitively stimulating instructional approaches (Hixon and Buckenmeyer, 2009, Hsu, 2016). The researcher suggested that teachers with more positive value beliefs maximize their resource to overcome other
external barriers to technology integration (Ertmer, et al., 2012).
There is a lot of confusion in the literature regarding the definition of teacher beliefs. Part of this confusion centers on how to differentiate teacher beliefs from teacher knowledge (Ertmer, 2005). Calderhead (1996, p. 715) suggested a distinction between these two concepts: beliefs generally refer to “suppositions, commitments, and ideologies,” while knowledge refers
to “factual propositions and understandings”. That means even if you have knowledge about how to use specific technology such as a spreadsheet for student record keeping, yet still do not believe that technology is an effective tool for the classroom use. For more specification, when we refer to teachers’ beliefs we focus on teachers' educational beliefs about teaching and learning, and the beliefs they have about how technology can help to translate those beliefs into classroom practice (Ertmer, 2005).
If we need to achieve fundamental changes in the use of educational technology in everyday teaching and learning practice, we need to pay attention to teachers' beliefs about teaching, learning, and technology. Marchinkiewicz (1993) concludeed, “Full integration of computers into the educational system is a distant goal unless there is reconciliation between teachers and computers. To understand how to achieve integration, we need to study teachers and what makes them use computers” (p. 234).
Diffusion of innovation theory
The field of educational technology has suffered from a lack of transformative use of technology. Professionals in the field have used the theory of innovation diffusion to increase the meaningful adoption of technology. Diffusion is defined as “the process by which an innovation is adopted and gains acceptance by members of a certain community” (Surry,1997). According to Rogers (1995, p.5) Diffusion is “the process by which an innovation is
communicated through certain channels over time among the members of a social system”. Rogers (1995) suggested four factors that affect the diffusion process: the innovation itself, how information about the innovation is communicated, time, and the nature of the social system into which the innovation being introduced.
Diffusion of innovation theory has been incorporated into the field of educational technology to investigate how technology is adopted or not and why some technologies are
adopted at a faster or slower rate than other, and to examine a range of organizational and information systems adoption processes (Tabata, & Johnsrud, 2008). Surry (1997) argued that the study of diffusion of innovation theory is valuable to education technology field for three reasons: first, the reason why many technologies are, or are not, adopted or integrated into teaching remains a mystery to the field. Second, educators who understand the innovation process will be more prepared to utilize technology effectively. Third, the study of diffusion theory could lead to the development of a systematic model of technology integration and diffusion.
CHAPTER III: METHODOLOGY Introduction
The major purpose of this quantitative study is to investigate if there is a relationship between faculty perception of educational technology and technology integration into higher education instruction. This chapter describes the research procedures that have been used to design a reliable instrument, and the statistical procedures used to analyze the collected data in the following sections:
1. The purpose of the study. 2. Research design.
3. Research questions. 4. Research hypotheses.
5. Research hypotheses’ connection to the literature review. 6. Data collection procedures.
7. Description of the Variables. 8. Research Sampling.
9. Instrumentation.
10. Reliability and validity. 11. Translation of the instrument. 12. Data analysis.
The purpose of the study
As stated in the first chapter, the purpose of this study is to examine the level of technology integration into teaching and learning by Saudi university faculty members.
Additionally, another goal of this study is to investigate Saudi university faculty members’
investigate whether there is a relationship between Saudi university faculty members’ perception of educational technology and the level of technology integration into teaching and learning.
Research design
In this study, data were collected, organized, tested, and analyzed through quantitative research methods to investigate the relationship among variables: (1) faculty integration of technology and (2) faculty perception of educational technology. To achieve the research objectives, three research questions and three hypotheses were generated and stated as the null hypotheses. The hypotheses were tested at the .05 level of significance.
Research questions
In order to investigate the variables and the relationship among them the following research questions were created:
1. To what extent do Saudi university faculty members use, or integrate, technology in teaching?
2. What are Saudi university faculty members’ perceptions of educational technology? 3. Is there a significant relationship between the perceptions of educational technology
and educational technology integration by Saudi university faculty members? The third question consists of the following sub-questions:
a) Is there a significant relationship between the perceptions of educational
technology and the translational level of technology integration Saudi university
faculty members?
b)Is there a significant relationship between the perceptions of educational technology and the transformational level of technology integration by Saudi
c) Is there a significant relationship between the perceptions of educational technology and the transcendent level of technology integration by Saudi
university faculty members?
Research Hypotheses
The following hypotheses were created in order to test the research questions: H1. Saudi university faculty members have a low-level of technology integration. H2: Saudi university faculty members have misperception of educational technology.
H43: There is a relationship between the perceptions of educational technology and educational technology integration by Saudi university faculty members.
Research hypotheses’ connection to literature review
The review of literature addressed technology impact on education, improper use of technology education, proper use of educational technology, what affect the proper use of educational technology, and faculty’ belief and educational technology integration. In the following the researcher will address the points of agreement, which guided the researcher to draw the research hypotheses:
1. Faculty use technology for demonstrative and research tasks more than they use it for educational transformation. They mostly use technology, such as word processing and email for communication and research rather than using technology such as the use of multimedia, course management system, asynchronous communication and social media for instruction ( Kazley, A., Annan, D., Carson, N., Freeland, M., Hodge, A., Seif, G., & Zoller, J. (2013).
2. Technology has not transformed education because several mistaken approaches related to faculty’ fundamental belief. Faculty’ beliefs, attitudes, and perceptions of education technology were found to be a fundamental factor in the level and quality of technology
that faculty’s' attitudes and beliefs are considered one of the three most frequently cited barriers to technology integration. Due to those mistaken approaches, Zhao (2015) call for a
reconceptualization of educational technology.
3. Even though the key components for successful technology integration have been nearly addressed and resolved, the current level of technology integration is still surprisingly low. Ertmer (2005) attributed that to additional barriers, specifically related to instructors' pedagogical beliefs which is much less understood and, consequently, less readily resolved. For this reason, the researcher assumes that there is a relationship between the perceptions of educational technology and educational technology integration by faculty members in Saudi Arabia.
Data collection procedures
The researcher has developed a survey, especially for this study. The integration section of the survey was developed based on the concept of the T3 technology integration model created by Megana (2017) in his book Disruptive classroom technologies: A framework for innovation in education. The perception section of the survey was developed based on the concepts of the top 5 EdTech mistakes that were explained in the book Never Send a Human to Do a Machine's Job: Correcting the Top 5 EdTech Mistakes by Zhao, Zhang, Lei, & Qiu, (2015). The participants were asked to complete an electronic survey (Qualtrics) after they read and electronically signed the consent letter that informs them about the nature of the study and informs them that their information and responses will be confidential. The survey was e-mailed to the faculty members in Saudi Arabia.
Both Arabic and English versions of the survey were distributed to the participants, because among those participants were faculty members who do not speak/read English. The survey was sent to the school of education graduate studies at King Abdul-Aziz University, then
through the college email system the survey was sent to all faculty emails.The researcher also, sent personal emails to more than 700 faculty members in King Abdul-Aziz university.
Description of the Variables
There are six variables to this study, one dependent variable and five independent variables:
Dependent variables (DV)
1. Level of education technology integration among faculty members in Saudi Arabia. This construct consists of 6 dependent variables:
1. Translational Level: automation and consumption 2. Transformational Level: production and contribution
3. Transcendent Level: inquiry design and social entrepreneurship Independent variables (IV)
1. Faculty members’ in Saudi Arabia perception of educational technology. This construct consists of 5 independent variables:
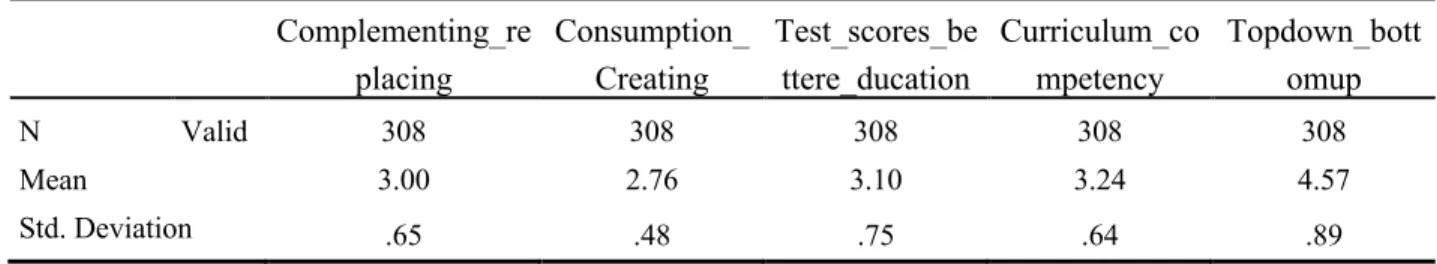
1. Complementing in an Ecosystem Versus Replacing in a Hierarchy
2. Technology as Tools for Consumption Versus Tools for Creating and Producing. 3. Technology to Raise Test Scores Versus Technology to Provide Better Education 4. Technology as Curriculum Versus Digital Competence
5. Top Down Versus Bottom Up
Research Sampling
The participants of this study will be faculty members in Saudi universities from both male and female campuses, from all academic rankings (professor, associate professor, assistant professor, lecturer, teaching assistant), from all colleges and schools.
Human Subjects’ Committee Approval
Institutional Review Board (IRB) approval to conduct this study was requested from the KU Human Subjects Committee, at Lawrence, Kansas campus. The approval was granted to collect the data on 3/11/2019 (See Appendix B). Following that, sample information statement, explaining the study and how it would be conducted was sent to the participants with the survey (see Appendix C).
Instrumentation
A survey is designed specifically for this study. The survey is designed after reviewing several existing surveys that have been used with the related subject matter. The researcher created most of the survey’s items, and some items were compiled from the literature review and modified. The survey consists of three sections: demographic information, technology
integration levels, and faculty perceptions of technology. The first section of the survey will include several demographic checkbox questions that are outlined to collect data regarding faculty’s professional ranks (Professor, Associate Professor, Assistant Professor, Lecturer, and Teaching Assistant), years of teaching experience, gender, and age.
The researcher designed the technology integration section based on the T3 framework of technology integration by Magana (2017) to measure faculty technology integration level. The technology integration section is composed of 6 dimensions (automation, consumption,
production, contribution, inquiry design, and Social Entrepreneurship) derived from the Magana
T3 framework (see Appendix D).
Magana (2017) introduced several questions in each stage of his framework. These questions help educators identify in which stages of technology use they are. The researcher utilized and modified some of these questions into response Likert scale items. These six-point Likert scale items will be coded 1= strongly disagree, 2 = disagree, 3 = somewhat disagree,
4 = somewhat agree, 5 = disagree, 6 = strongly agree. This section consists of 19 items. Some of the survey questions are as follows:
• I use technology to communicate with other faculty, administrators, and students. • I use digital tools to present new content information.
• My students use digital tools to consume interactive content-related resources.
• My Students use technology to accomplish things that they could not have done without the technology.
• I use and direct my students to use technology to create tutorials/learning materials. • I use technology to engage my students in social entrepreneurship tasks that are driven by
authentic passion and need.
The perception section is designed to identify the main perceptions that faculty members have of educational technology. This section is designed based on the ideas that Zhao et al. (2015) presented in their book Never Send a Human to Do a Machine's Job: Correcting the Top 5 EdTech Mistakes. Zhao et al. (2015) illustrated the top 5 EdTech mistakes in five chapters. The researcher read the book and extracted the main concepts of each chapter then he came up with survey items that represent the comprehension of these concepts.
The faculty perception section is composed of 5 dimensions, each dimension represents one EdTech conceptual mistake (complementing in an ecosystem versus replacing in a hierarchy, technology as tools for consumption versus tools for creating and producing, technology to raise test scores versus technology to provide better education, technology as curriculum versus digital competence, and top-down versus bottom up). These five concepts will be measured by six-response Likert scale items. These six-point Likert scale items will be coded 1= strongly disagree, 2 = disagree, 3 = somewhat disagree, 4 = somewhat agree, 5 = disagree, 6 = Strongly
• I often hold reservations toward the use of technology in the classroom.
• I need to rank technology tools to find out which is better in instruction.
• Technology can solve any educational problem.
• The main goal of using technology is to help students access existing knowledge.
• Teachers must use technology to help students get high scores on standardized tests.
• The university mandates the use of technology.
Reliability and validity
Reliability is the degree to which a survey instrument consistently measures whatever it is designed to measure (Slavin, 1992). In other words, reliability is to what extent the test score is dependable, consistent, and precise when it is used more than one time. One way to report
evidence of internal reliability is to measure coefficient alpha or Cronbach’s alpha, which is a number that ranges from .00 to 1.00. The higher the number, the more internally consistent a test’s items behave (Frey, 2006). To evaluate the reliability of the instrument used in this study, the researcher will conduct a pilot study in order to calculate the internal consistency coefficient (Cronbach’s Alpha). Cronbach’s Alphas for Each section (perception and integration) will be calculated separately in order to measure the consistency of scores across items.
Validity is the extent to which the instrument measures what is intended to measure (Frey, 2006). To make sure the survey is valid and accurate in measuring faculty’ perceptions of technology and technology integration level, the researcher works closely with professor Zhao the author of the book Never Send a Human to Do a Machine's Job: Correcting the Top 5 EdTech Mistakes to review and edit the survey. Also, the researcher will consult a panel of experts (faculty members and doctoral students) to review and modify the items as suggested. All the experts either specialize in education technology or educational psychology and research.
Translation of the instrument
As I stated earlier, among the participants are faculty members do not speak English as their first or second language; therefore, they might not understand the survey accurately. The researcher will translate the survey into Arabic and reword the instruments adopted in this study.
To ensure the validity of the survey, four Experts in both language (English/Arabic) will be consulted and will revise both versions of the survey. Among those experts are a linguistic professor and TESOL doctoral students. Forward and backward translation method will be conducted to ensure the accuracy of the instrument. The researcher will match the two versions and make sure there is no significant differences.
Data Analysis
Different statistical methods will be used to analyze the data depending on the types of the questions. Descriptive statistics will be computed to analyze demographic data. The means, frequencies, modes, standard deviations, and percentages will be computed to form a better understanding of the population of the study. A multiple linear regression will be conducted to examine how the independent variables predict the dependent variable. The Statistical Package for Social Sciences (SPSS) will be employed to analyze the data. All analysis of the study will be conducted using p < .05 as the level of statistical significance.
CHAPTER IV: RESULT Introduction
This chapter describes the analysis of data that were collected to identify, describe, and measure (a) the extent of technology integration in teaching by faculty members in Saudi universities, (b) Saudi university faculty members’ perceptions of educational technology, and (c) the relationship between the perceptions of educational technology and educational
technology integration by faculty members in Saudi universities. The chapter includes the description of population and sampling, descriptive statistics of the data, reliability analyses, research question results, and a chapter summary.
Description of Population and Sampling
The participants in this study were both male and female Saudi university faculty
members. The study was conducted the second week of March 2019. A total of 4,000 emails that contained two links (Arabic and English versions) were sent to Saudi university faculty
members. A total of 391 responses were returned while 83 incomplete responses were excluded. The sample size was adjusted to 308. The sample consisted of 308 participants, 45.5 % of them were males (n = 140), and 54.5 % (n = 168) were females. Table 1 reports the frequencies and percentages associated with sex categories.
Table 1. Number of Participants Based on sex
Frequency Percent Valid Percent
Valid Male 140 45.5 45.5
Female 168 54.5 54.5
Research Questions
The data of this study were collected using two versions (Arabic and English) of the electronic survey. The surveys were designed and distributed by Qualtrics. The research
questions and hypotheses were analyzed using descriptive statistical methods and multiple linear regression. All analyses conducted used p < .05 as a level of statistical significance. The
Statistical Package for Social Science (SPSS) software (Version 25) was used to analyze the data in this study. This study included three questions and three sub-questions as follows:
1. To what extent do faculty members in Saudi Arabia use, or integrate, technology in teaching?
2. What are Saudi university faculty members’ perceptions of educational technology? 3. Is there a significant relationship between the perceptions of educational technology
and educational technology integration by faculty members in Saudi Arabia? The third question consists of the following sub-questions:
d)Is there a significant relationship between the perceptions of educational technology and the translational level of technology integration by faculty members in Saudi Arabia?
e) Is there a significant relationship between the perceptions of educational technology and the transformational level of technology integration by faculty members in Saudi Arabia?
f) Is there a significant relationship between the perceptions of educational technology and the transcendent level of technology integration by faculty members in Saudi Arabia?
Demographic Description
The following descriptive results define the demographic characteristics of the study participants. Demographic information includes sex, academic rank, years of teaching experience, college or school of teaching, nationality, and country of graduation.
Participants’ sex
The sample consists of 308 participants, 45.5 % of which were male (n = 140), while 54.5 % (n = 168) were female. Table 1 reports the frequencies and percentages associated with sex categories.
Participants’ Academic Ranks
Participants’ academic ranks were categorized into 6 ranks (full professor, associate professor, assistant professor, lecturer, teaching assistant, and others). This categorization was based on the regulations governing the academic affairs of the Saudi university faculty members. Table 2 shows the frequencies and percentage associated with the academic rank categories. The greatest number of participants were lecturers (129, i.e. 41.9 %). The smallest group was the teaching assistants (16, i.e. 5.2 %).
Table 2. Number of Participants Based on academic ranks
Frequency Percent Valid Percent Cumulative Percent
Valid Full Professor 28 9.1 9.1 9.1
Associate Professor 41 13.3 13.3 22.4 Assistant Professor 93 30.2 30.2 52.6 Lecturer 129 41.9 41.9 94.5 Teaching Assistant 16 5.2 5.2 99.7 other 1 .3 .3 100.0 Total 308 100.0 100.0
Participants’ Years of Teaching Experience
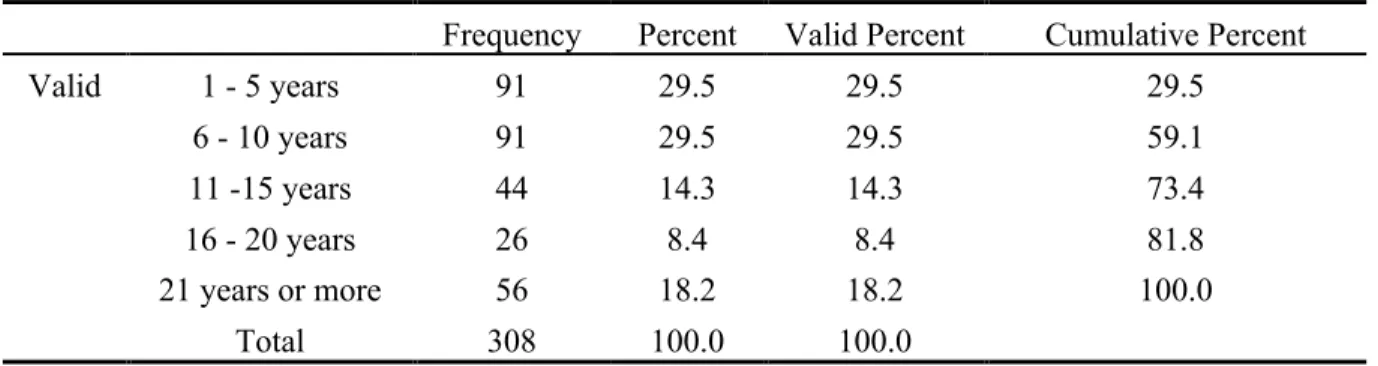
Table 3 reports the frequencies and percentage associated with participants’ years of teaching experience. 91 of the participants had 1-5 years of teaching experience, which represented 29.5 % of the total number of participants. Also, 91 of the participants had 6-10 years of teaching experience, which represented 29.5 % of the total number of the participants. 56 of the participants, or 18.2 %, had 21 years or more of teaching experience.
Participants’ college
The largest group of participants was from the School of Liberal Arts and Humanities (48 participants, 15.6%). The second largest group was from the School of Environmental Designs (37 participants, 12%). There were 35 participants (11.4%) from the School of Education, and 29 participants (9.4%) from the School of Applied Medical Science. Table 4 represents the
frequencies and percentage associated with participants’ schools.
Table 3. Years of teaching experience
Frequency Percent Valid Percent Cumulative Percent
Valid 1 ‐ 5 years 91 29.5 29.5 29.5 6 ‐ 10 years 91 29.5 29.5 59.1 11 ‐15 years 44 14.3 14.3 73.4 16 ‐ 20 years 26 8.4 8.4 81.8 21 years or more 56 18.2 18.2 100.0 Total 308 100.0 100.0
Participants’ nationality
As shown in table 5, 83.8% of participants (n = 258) were Saudi citizens, and 16.2% of participants were Non-Saudi (n = 50).
Frequency Percent Valid Percent Cumulative Percent Valid Liberal Arts and
Humanities 48 15.6 15.6 15.6 Engineering 17 5.5 5.5 21.1 Sciences 36 11.7 11.7 32.8 Family Sciences 8 2.6 2.6 35.4 Education 35 11.4 11.4 46.8 Law 4 1.3 1.3 48.1 Medical 5 1.6 1.6 49.7 Medical Rehabilitation 2 .6 .6 50.3 Sciences 2 .6 .6 51.0
Computing and Information Technology
21 6.8 6.8 57.8
Nursing 5 1.6 1.6 59.4
Dentistry 10 3.2 3.2 62.7
Pharmacy 10 3.2 3.2 65.9
Applied Medical Science 29 9.4 9.4 75.3
Economics and
Administration/Business Administration
10 3.2 3.2 78.6
Marine Sciences 7 2.3 2.3 80.8
Communication and Media 6 1.9 1.9 82.8
Home Economics 7 2.3 2.3 85.1
Meteorology, Environment and Arid Land Agriculture
4 1.3 1.3 86.4
Environmental Designs 37 12.0 12.0 98.4
Others: 5 1.6 1.6 100.0
Participants’ Graduation country
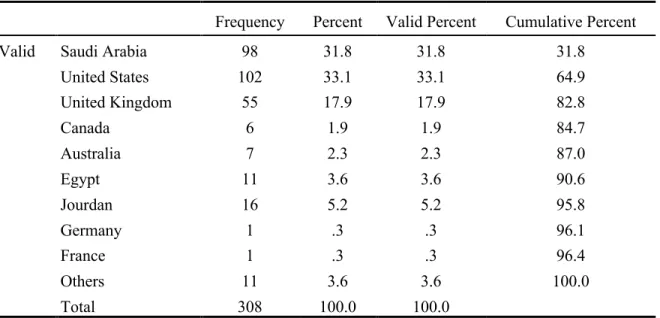
The results show that 102 faculty members earned their highest degree from The United States (33.1%). 98 of the participants earned their highest degree from Saudi Arabia (31.8%). 55 participants earned their highest degree from the United Kingdom (17.9%). Table 6 represents the frequencies and percentage associated with participants’ country of graduation.
Reliability Analysis
Cronbach’s Alpha was calculated to measure the internal consistency across sets of items as a group. There were two main sections for the survey. The first section measured the current level of educational technology integration into teaching by faculty members. In this section,
Table 5. Nationality
Frequency Percent Valid Percent Cumulative Percent
Valid
Saudi 258 83.8 83.8 83.8
Non-Saudi 50 16.2 16.2 100.0
Total 308 100.0 100.0
Table 6. Participants’ Graduation Country
Frequency Percent Valid Percent Cumulative Percent
Valid Saudi Arabia 98 31.8 31.8 31.8
United States 102 33.1 33.1 64.9 United Kingdom 55 17.9 17.9 82.8 Canada 6 1.9 1.9 84.7 Australia 7 2.3 2.3 87.0 Egypt 11 3.6 3.6 90.6 Jourdan 16 5.2 5.2 95.8 Germany 1 .3 .3 96.1 France 1 .3 .3 96.4 Others 11 3.6 3.6 100.0 Total 308 100.0 100.0
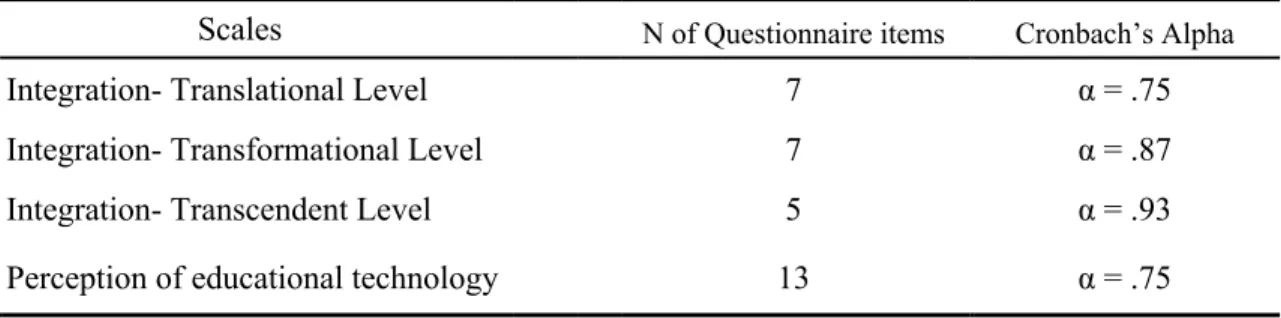
there were three constructs to be measured: (a) integration – translational level, (b) integration – transformational level, (c) integration – transcendent level. The second section measured faculty members’ perception of educational technology. There were five sub-constructs under this section. However, the researchers considered the whole section to be one construct because they were measuring the same level of perceptions, and some sub-constructs consisted of two items, which is not enough to test internal consistency. As illustrated in Table 7, Cronbach’s Alpha coefficients for translational level of technology integration was .75, .87 for transformational level of technology integration, and .93 for transcendent level of technology integration. Cronbach’s Alpha coefficients for the second section “faculty members’ perception of educational technology” was .75. The values of the Cronbach’s Alpha coefficients for these constructs were relatively high enough to conclude that there was a sufficient consistency among the survey items in each construct.
Table 7. Current Reliability Coefficients
Scales N of Questionnaire items Cronbach’s Alpha
Integration- Translational Level 7 α = .75
Integration- Transformational Level 7 α = .87
Integration- Transcendent Level 5 α = .93
Perception of educational technology 13 α = .75
Findings of the Research Questions
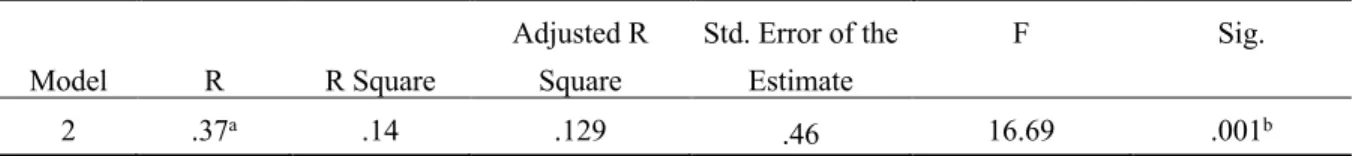
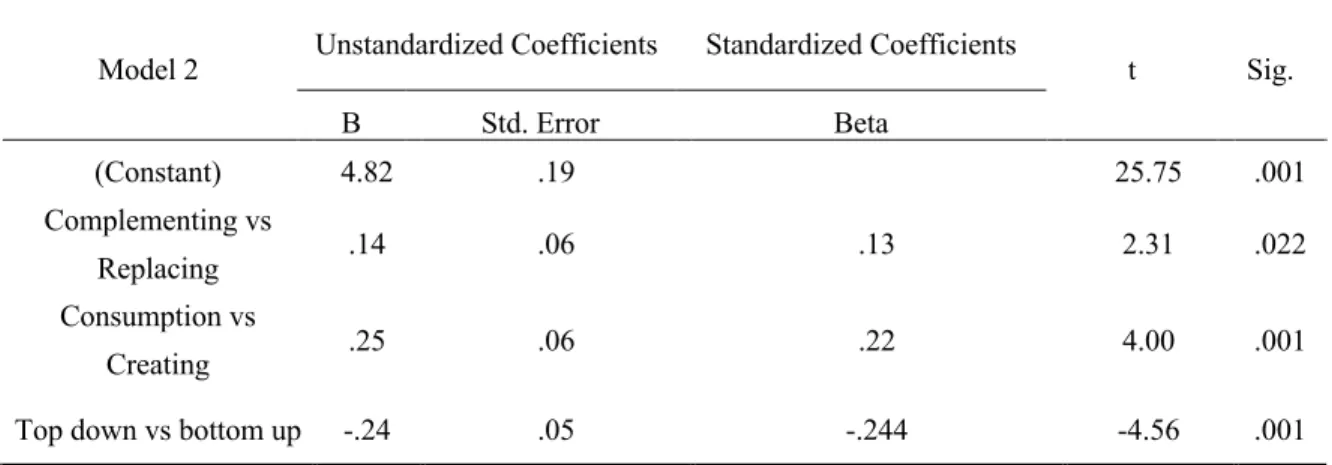
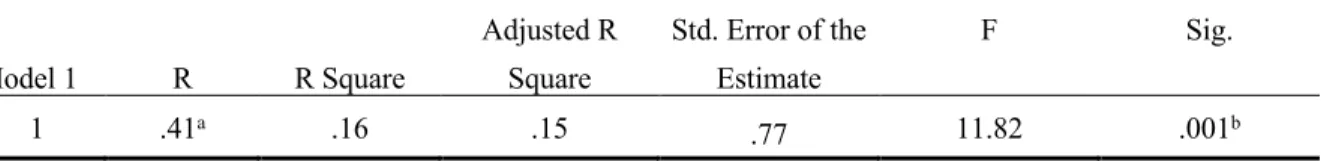
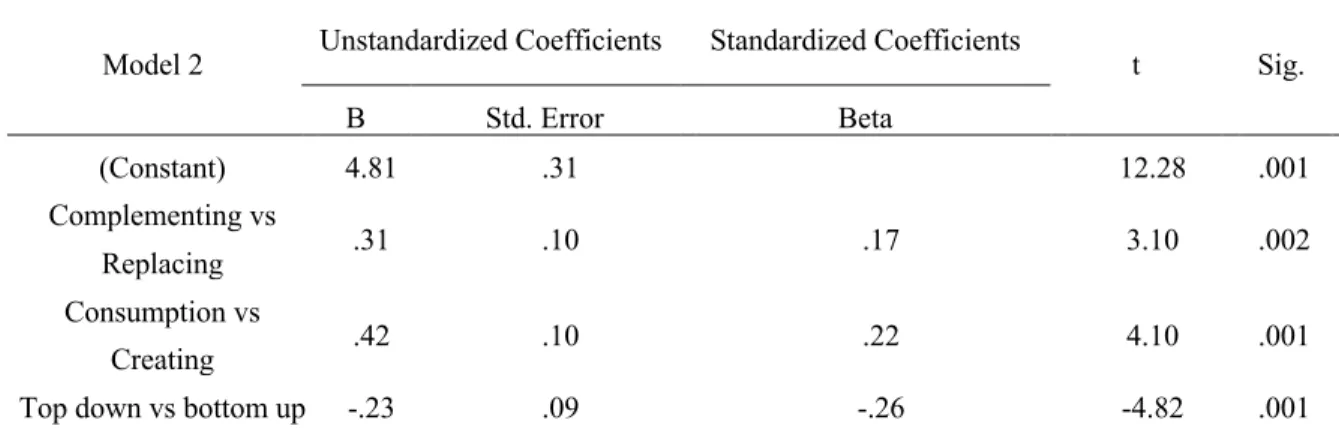
Question one and question two were analyzed by using descriptive statistical methods. Question number three, which consisted of three sub-questions, was analyzed by using multiple regression analysis. The following section illustrates in detail how data were analyzed to answer each of the research questions.