Econometric and Network Analysis
by
Mateusz Gątkowski
A thesis submitted for the degree of Doctor of Philosophy
Centre for Computational Finance and Economic Agents
Department of Computer Science and Electronic Engineering
University of Essex
Summary
Since the Global Financial Crisis, the literature of financial networks analysis has beentrying to investigate the changes in the financial networks structure, that led to the instability of the financial system. The Global Financial Crisis followed by the Great Recession costed taxpayers an unprecedented $14 trillion (Alessandri and Haldane, 2009), austerity and downturns in GDP. The dynamics of the financial networks transferred the collapse of a US housing market bubble into a large meltdown of the financial systems globally.
The study of systemic risk and macro-prudential policy has come to the forefront to model and manage the negative externalities of monetary, fiscal and financial sector activities that can lead to system wide instabilities and failure. The dimensions of crisis propagation have been modelled as those that can spread cross-sectionally in domino like failures with global scope, or build up over time, as in asset bubbles. The cross sectional propagation of shocks that occur due to non-payment of debt or other financial obligations with the failure of a financial intermediary or a sovereign leading to the failure of other economic entities, is called financial contagion. Cross sectional analysis of financial contagion can be done using statistical methods or by network analysis. The latter gives a structural model of the interconnections in terms of financial obligations. This dissertation uses both approaches to model financial contagion. The applications include the study of systemic risk in Eurozone Sovereign crisis, the US CDS market and the global banking network. This is organized in three self-contained chapters
Our contribution to the literature begins with the study of the dynamics of the market of the Credit Default Swap (CDS) contracts for selected Eurozone sovereigns and the UK. The EWMA correlation analysis and the Granger-causality test demonstrate that
there was contagion effect since correlations and cross-county interdependencies increased after August 2007. Furthermore, the IRF analysis shows that among PIIGS, the CDS spreads of Spain and Ireland have the biggest impact on the European CDS spreads, whereas the UK is found not be a source of sovereign contagion to the Eurozone.
Next we perform the empirical reconstruction of the US CDS network based on the real-world data obtained from the FDIC Call Reports, and study the propagation of contagion, assuming different network structures. The financial network shows a highly tiered core-periphery structure. We find that network topology matters for the stability of the financial system. The “too interconnected to fail” phenomenon is discussed and shown to be the result of highly tiered network with central core of so called super-spreaders. In this type of network the contagion is found to be short, without multiple waves, but with very high losses brought by the core of the network.
Finally we study a global banking network (GBN) model based on the Markose (2012) eigen-pair approach and propose a systemic risk indices (SRI) which provide early warning signals for systemic instability and also the rank order of the systemic importance and vulnerability of the banking systems. The empirical model is based on BIS Consolidated Banking Statistics for the exposures of 19 national banking systems to the same number of debtor countries and the data obtained from Bankscope for the equity capital of these 19 national banking systems. The SRI is based on the ratio of the netted cross-border exposures of the national banking systems to their respective equity capital. The eigen-pair method stipulates that if the maximum eigenvalue of the network exceeds the capital threshold, there is cause for concern of a contagion. This is compared with the loss multiplier SRI proposed by Castrén and Rancan (2012). The latter is found to have no early warning capabilities and peaks well after the onset of
the crisis in 2009 while the eigen-pair SRI gives ample warning by late 2006 that the cross border liabilities was unsustainable in respect of the equity capital of the national banking systems. We contribute to the literature by highlighting the efficacy of the network approach to systemic stability analysis of GBNs. In particular we develop an eigen-pair approach for GBNs and prove its usefulness in an early warning context.
Acknowledgements
I would like to thank foremost my supervisor prof. Sheri Markose, whose constant support, patience and insights were vital for completion of this thesis. She has been very supportive and her enthusiasm for research were lifting me up in the moments of doubts and personal difficulties.
Thanks to my colleagues and friends Ali Rais Shaghaghi, Simone Giansante, Alesia Kalbaska, with whom I had a pleasure to work with. I am especially indebted to Ali, for countless hours of discussions over the research and his valuable insights and for simply being a good friend. Thanks also to my other friends at The Centre for Computational Finance and Economic Agents (CCFEA): Neil Rayner and Imon Palit who helped make CCFEA and Essex a pleasure.
Many thanks to Marisa Bostock, Sheila Pill and other staff from the CSEE Department and the Registry, the director of CCFEA prof. Edward Tsang and the Head of my Supervisory Board dr. Anthony Vickers, all of whom have been very helpful in the moments of personal difficulties, when the administrative support was needed.
This thesis would have not been completed without patient and unquestioning support of my parents: Antoni and Maria, and my sister Joanna. This is by no means an exaggeration if I say that they have actually carried me through the difficulties. I want to mention also my uncle prof. Eugeniusz Rosołowski, who’s been a rolemodel of a professor for me.
I will be eternally indebted to Agata Borek, my love, who had to go through a lot with me, when I was writing the thesis. She never complained, was cheerful and full of hope, even in the moments of my doubts. She has been patiently waiting for me to finish and putting her own plans aside. Thank you!
I have received also invaluable support from Cichecki family, during the last year they have created a home for me in the UK and a proper environment for work. My dear friend Kacper Cichecki, has been to me like a brother during the years in Essex.
There is a long list of friends who’s been important for me in the years of the doctoral research. It’s impossible to list all of them but I must mention, in a random order: Danuta Dróżdż, for her support in all areas, everlasting smile and humour; Magdalena Jeżewska-Lewińska, for her professionalism and support; Robert Małyniak, who spend long days with me in the less cheerful moments; Tomasz and Gosia Jarzębowicz, who often hosted me in London for almost two years, and proven themselves to be amazing friends; Łukasz Polański, for his goodness, smile, good word and hospitality in Rome and for always being there for me; Marek Dietl for his professionalism and being a role model of a young researcher, who has been able to successfully merge the business, academia, family and spirituality in one and consistent picture; all the friends from expedition to Puna de Atacama (Dominik, Iwona, Andrzej, Rafał, Michał, Wojtek Lewandowski and Wojtek Jankowski, Jacek, Piotrek, Edek, Tomasz); Anna Karbownik, for giving me a push forward; Jagoda Mytych, for her uncompromising attitude and faith, and many, many others.
I also want to commemorate late Jose Cordoba – a friend from the doctoral programme at CCFEA and late Tomasz Kosicki – who died before finishing his doctoral degree, he was my climbing partner and dear friend for the last 4 years.
Finally, as Emilio Previtali in his acknowledgements speech said (Previtali, 2014) – “when you already thank to everybody, you take a step back and in silence you think gratefully about all of those who did not believe in you and this way motivated you to go forward”.
Declarations
The work presented in Chapter 2 was published in collaboration with Alesia Kalbaska, in a paper published at:
Kalbaska, A., Gątkowski, (2012) M., Eurozone sovereign contagion: Evidence from the CDS market (2005-2010). Journal of Economic Behavior & Organization, 83(3), 657-673.
The results presented in Chapter 3 were published as a working paper in University of Essex, Department of Economics Discussion Paper Series in collaboration with prof. Sheri Markose, Simone Giasnante and Ali Rais Shaghaghi.
Markose, S., Giansante, S., Gątkowski, M., Shaghaghi, A. R. (2010). Too interconnected to fail: financial contagion and systemic risk in network model of CDS and other credit enhancement obligations of US banks. University of Essex, Department of Economics, Discussion Paper Series, 683, February 2010. The work on this paper has been funded from the EC COMISEF project FP6-034270-2.
For the research for Chapter 3 and Chapter 4 I use the network simulator developed by dr. Simone Giansante.
Table of contents
Summary ... 2
Acknowledgements ... 5
Declarations ... 7
Chapter 1 Introduction ... 11
Chapter 2 Eurozone Sovereign Contagion: Evidence from the CDS Market (2005-2010) ... 16
2.1 Introduction ... 16
2.2 Data Analysis ... 22
2.2.1 The BIS data on cross-border exposures ... 26
2.3 Econometric Analysis of CDS Spreads ... 29
2.3.1 EWMA Correlations of CDS Spreads ... 29
2.3.2 Granger-causality analysis ... 35
2.3.3 Impulse Response Analysis ... 39
2.3.4 Adjusted Correlation Analysis of CDS Spreads Before and After the Greek Bailout ... 45
2.4 Concluding remarks ... 50
Chapter 3 Financial Contagion: Evidence From the US CDS Market (2007) ... 54
3.1 Introduction ... 55
3.1.1 Financial Networks Approach ... 55
3.1.2 CDS Market Analysis of Financial Contagion ... 58
3.2.1 Some Properties of Socio-Economic Networks ... 62
3.2.2 Some technical notes on network statistics and stability analysis ... 65
3.2.3 May Condition for Network Stability ... 69
3.3 The Network Topology of US CDS Financial Interrelations ... 71
3.4 Model Stress Tests ... 77
3.4.1 Model Stress Tests Results ... 80
3.4.2 Comparisons of Contagion between a CDS Network with Clustered Small World Properties and a Random Graph ... 82
3.1 Conclusion ... 86
Chapter 4 Network Analysis of Core Global Banking System: Systemic Risk, Vulnerabilities and Early Warning Indices ... 89
4.1 Introduction ... 90
4.2 Literature review on Global Banking Networks, systemic stability and early warning signals ... 93
4.3 Description of the network model ... 99
4.3.1 Eigen-Pair Method for systemic risk analysis ... 101
4.4 Description of data ... 105
4.4.2 Data on equity of banking systems ... 106
4.5 Description of the topology of the Core Global Banking Systems Network 111 4.5.1 Network statistics ... 116
4.6 Cross-border exposures in the Core Global Banking System Network ... 120
4.6.1 Cross-border exposures of PIIGS and the rest of Eurozone ... 125
4.7 Stability Analysis of the Core Global Banking System Network ... 128
4.7.1 Maximum eigenvalue and network stability ... 128
4.7.2 Stability analysis ... 130
4.7.4 Systemic Risk Index with Greek bankruptcy ... 135
4.7.5 Systemic importance and vulnerability of nodes in the Core Global Banking System Network ... 136
4.8 Conclusion ... 145 Appendix A ... 148 Appendix B ... 154 Appendix C ... 157 Appendix D ... 162 Appendix E ... 168 Appendix F ... 170 Appendix G ... 171 List of Figures ... 172 List of Tables ... 176 References ... 179
Chapter 1
Introduction
The research on financial networks gained the momentum after a catastrophic Global Financial Crisis. The crisis cast waves of shock through financial markets, brought many banking superpowers to its knees and threatened the solvency of others. It was a shock therapy for the supervisory authorities who did not pay enough attention to the structure of financial networks and were concentrated on solvency of individual financial intermediaries. Both financial market practitioners and economists working in academia largely failed to predict such a disastrous course of events perhaps lulled by the “volatility paradox” of the type envisaged by Minsky (1986), who argued that markets become tranquil before the burst of volatility. The state of complacency was dubbed The Great Moderation by Stock and Watson (2003) and most probably the authors of the term were surprised as the most of economists by what had happen.
Financial markets are prone to crises, and this was already brought to public attention by the Minsky’s (1982) comments on the “disruptive internal processes of the economy”. This does not mean, however, that the crises cannot be foreseen or, at least, that some early warning signals of the building-up market instability cannot be found. As Alan Kirman noticed: “The economic crisis is also a crisis for economic theory. Most analyses of the evolution of the crisis invoke three themes – contagion, network and trust – yet none of these play a major role in standard macroeconomic models” (Kirman, 2011). Since the Global Financial Crisis the research on systemic risk measures brought to attention of macro-prudential profession many competing models (see Markose (2013) for the review of the literature of the systemic risk metrics), some of which are based on the analysis of financial networks.
We believe that data-driven approach to the macro-prudential questions is the correct way of dealing with these challenges. The analysis of the system as a whole gives us an insight into the complex dependencies between economic agents. Recreating the network of financial intermediaries or banking systems from the real world data we make a small step towards the modelling of economy as a complex adaptive system, which is the way the economy should be modelled as noted by Kirman (2011).
This thesis contains three interrelated papers organized into chapters, which are self-contained. Each chapter incorporates abstract and all of the necessary literature, data analysis, results and conclusions needed for the full coverage undertaken for the research question in hand.
Firstly in Chapter 2 we analysed the Eurozone Sovereign Contagion by looking at dynamics of the credit default swaps (CDS) market of PIIGS, France, Germany and the UK for the period of 2005-2010. We employ econometric methods such as Exponentially Weighted Moving Average analysis, the Granger-causality analysis and the Impulse Response analysis in order to answer the question about the causality of the contagion effect in the network of sovereigns. We discover that:
• Sovereign risk mainly concentrates in the EU countries. • France, Germany and the UK are heavily exposed to PIIGS. • The Global Financial Crisis triggered the sovereign debt crisis.
• PIIGS have lower capacity to trigger contagion than core EU countries.
• Portugal is the most vulnerable, whereas the UK is the most immune to shocks. We are the first in the literature of the topic to combine the real world datasets from different sources and to use a wide array of different statistical methods to analyse it.
Secondly in Chapter 3 we reconstruct the US CDS network based on the FDIC 2008Q4 data in order to conduct a series of stress tests to investigate the consequences
of the fact that top 5 US banks constitute 92% of the CDS activity of US banks. We also construct a random graph which is equivalent to the empirically based CDS network in terms of connectivity and the same aggregate gross CDS buy and sell levels as given by the data. Next we use the Furfine (2003) approach to model the cascade of bank failures for both, the actual small world topology of the CDS network and for the equivalent random graph. Our results show that the propagation of the shock in both types of network is radically different and the less interconnected system is in some respects more dangerous. The contribution to the literature of this chapter is the confirmation of differences in contagion characteristics in different network topologies. It is based on real world data from the FDIC, it shows that the CDS market has core-periphery structure.
Finally in the Chapter 4 we recreate the Core Global Banking Network of cross-border exposures of the BIS reporting banking systems to the counterparty countries and collect the data on the total equity of the banking systems from Bankscope. We investigate the empirical topological structure of global banking by focusing on the foreign claims. We use the eigen-pair approach introduced in Markose (2012) and Markose et al. (2012) and develop systemic risk early warning indices, that combine the assessment of the banking network structure with the banking systems’ total equity, which acts as a buffer against negative shocks in the system. The proposed indices are one of the major contributions of this study, providing a single and elegant metric for global systemic risk with early warning capability. The indices are then used to assess the stability of the Core Global Banking System Network. Our main findings are, that the proposed indices have early warning capabilities:
• We show that the Core Global Banking System Network was increasingly unstable before the Global Financial Crisis, with systemic risk index peaking by the end of 2006.
• We detect the vulnerability of the Portuguese banking system at the end of the 2013, that is when our data set finishes. The vulnerability has been confirmed in 2014 by the bankruptcy of Espirito Santo, the major Portuguese bank.
• The proposed vulnerability index peaks for Belgium well in advance of the Global Financial Crisis and bankruptcy of the Fortis Group and Dexia.
Moreover our findings indicate that French, Spanish, Dutch and Swiss banking systems are found to be most vulnerable banking systems and potential propagators. There can also be seen a growing systemic threat from other countries like India and Turkey. Findings of the network analysis performed in Chapter 4 confirm and broaden the results of Chapter 2. We find that the core Eurozone countries more vulnerable than they seem when analysing information from the market-price based source, which are CDS premia.
With network analysis the CGBSN we are able to detect the overexposure of the European (mainly core Eurozone) banking systems to the US. The amount of exposure was called “surprising” by authors of the report on cross-border banking in Europe (Allen et al., 2011), who recommended the inclusion of this problem into an agenda of the European Systemic Risk Board.
The novelty of approach used in the last chapter, with respect to the existing literature, relies on combination of an extensive data analysis of the real world datasets from BIS and Bankscope and systemic risk application involving the bank capital and exposures of banking systems. We are performing analysis on the true network of cross-border exposures, with the true, not reconstructed topology and heterogeneity of the network
and links’ weights. We propose systemic risk indices: Systemic Importance, Systemic Vulnerability and Systemic Risk Index, measures, we claim, provide early warning signals for the distress of the dynamic systems based on the networks of cross-border exposures normalised by the capital.
Chapter 2
Eurozone Sovereign Contagion: Evidence
from the CDS Market (2005-2010)
Abstract
This chapter analyses the dynamics of the credit default swap (CDS) market of PIIGS, France, Germany and the UK for the period of 2005-2010. The study is performed on the basis of the Datastream and DTCC data on CDS spreads and the BIS data on cross-border exposures. The EWMA (Exponentially Weighted Moving Average) correlation analysis and the Granger-causality test demonstrate that there was contagion effect since correlations and cross-country interdependencies increased already after August 2007. Furthermore, the IRF analysis shows that among PIIGS the CDS markets of Spain and Ireland have the biggest impact on the European CDS market, whereas the CDS market of the UK does not cause a big distress in the Eurozone. The adjusted correlation analysis confirms that Greece and other PIIGS (even Spain and Italy) have lower capacity to trigger contagion than core EU countries. Besides, Portugal is the most vulnerable country in the sample, whereas the UK is the most immune to shocks.
2.1
Introduction
The global financial crisis of 2007-2009 led to the demise of several global banks and institutions. Some of the banks that were “protagonists” of the crisis were so called “too big and too interconnected to fail”. Therefore, states all over the world “sponsored” them by taking on the risk in the banking system and for a year they contained it. Yet, insolvencies that marked the crisis were passed on to sovereign states because of their
excessive debt issue to save the financial industry. Thus, the global financial crisis has grown into a full sovereign debt crisis.
In 2010 the Eurozone became strongly distressed by the series of events starting with the problems of Greece being unable to repay its debt and eventually being bailed out by the EU and the IMF. Greek problems fostered the fear about the fate of other European economies, especially heavily indebted countries such as Portugal, Ireland, Italy and Spain that along with Greece are usually referred to as PIIGS. Eventually, the EU and the IMF agreed on the bailout packages for Ireland and Portugal and one more bailout package for Greece. However, these bailouts do not make the risk disappear. They simply transfer the risk to the governments and taxpayers of other European countries. Thus, the current sovereign debt crisis for the first time seriously tests the Eurozone since its start in 1999.
Our study focuses on the credit default swap (CDS) market of PIIGS along with so called “core” countries such as France, Germany and the UK sincethey bought a large share of the debt of PIIGS. CDS spreads are a good data source to test for contagion as they can serve as a proxy for the default probability of a counterparty on which a CDS contract is written. Observing co-movements of CDS spreads of different countries can help to understand how the market estimates correlations of their default probabilities and also the direction of future defaults.
The major studies on the sovereign CDS market were performed by Longstaff et al. (2011) and Pan and Singleton (2008), however, they were not focused on the Eurozone countries. Recently, as a result of the rapidly worsening situation in the Eurozone the focus has changed dramatically and a number of empirical papers have addressed the issues of the sovereign risk in the Euro area. We touch upon a few contributions made by Alter and Schuler (2011), Aizenman et al. (2011), Acharya et al. (2011), Dieckmann
and Plank (2011), Delatte et al. (2011), Fontana and Scheicher (2010), Ejsing and Lemke (2009).
One strand of the recent empirical literature focuses on the joint dynamics between the sovereign and bank CDS market. Thus, Alter and Schuler (2011) study the relationship between the sovereign CDS of seven EU countries and the CDS of their banks. The authors analyse the period between June 2007 and May 2010 and look at differences in the market before and after government interventions. They find that before the government rescue interventions contagion spills over from the banking sector to the sovereign CDS market, whereas after the interventions sovereign CDS spreads largely determine the price of banks’ CDS series. The authors also highlight the short-term impact of the financial sector on sovereign CDS spreads and its insignificance in the long run.
Dieckmann and Plank (2011) also find evidence for a private-to-public risk transfer in the countries with government interventions. Moreover, the authors argue that this transfer is larger for the European Monetary Union (EMU) countries that are more sensitive to the health of the financial system than non-EMU states.
Ejsing and Lemke (2009) examine co-movements between CDS spreads of ten Euro area countries and CDS of their banks for the period from January 2008 to June 2009. The authors find that the government rescue packages led to a decrease in the CDS spreads of the banking sector at the cost of the increase in the price of sovereign CDSs. Furthermore, the bailout schemes made sovereign CDSs even more sensitive to any future shocks. Likewise, Acharya et al. (2011) find empirical evidence for the direct two-way feedback between the banking and sovereign CDS market of the Eurozone countries for the period of 2007-2011.
Another strand of the recent empirical literature investigates the relationship between the sovereign CDS and bond market. Fontana and Scheicher (2010) identify the main determinants of the bond and CDS spreads of ten Euro area countries and explain which factors drive the differences in pricing between the two markets. The authors suggest that “flight to liquidity” effects and limits to arbitrage may explain why CDS spreads exceed bond spreads. They also show that common factors are the main reason for the repricing of sovereign credit risk.
Similarly, Delatte et al. (2011) use a non-linear approach to analyse the influence of CDS premia on underlying bond spreads for PIIGS and five core European countries. The authors conclude that CDS spreads are a better indicator of the probability of default during the periods of turmoil.
Furthermore, there are studies that investigate the relationship between the sovereign CDS market and economic fundamentals. Thus, Aizenman et al. (2011) compare the market pricing of CDSs in the Eurozone (and PIIGS in particular) and the pricing of risk in the rest of the world. They find evidence that in 2010 CDSs of PIIGS are priced much higher than CDSs of other countries with similar fundamentals. As a possible interpretation the authors suggest negative expectations of the market about the future fundamentals of PIIGS and their exchange rate inflexibility.
Thus, the research to date has tended to focus either on interactions between the sovereign CDS market and the financial sector or on the joint dynamics between the CDS and bond markets. However, far too little attention has been paid to the discussion of contagion between sovereigns.
The aim of this study is to examine sovereign risk and the occurrence of financial contagion in Europe. In order to explain the long-term dynamics of the CDS market of PIIGS and core EU countries we carried out our analysis on an extended time period
spanning from August 2005, well before the global financial crisis, until September 2010. In the literature there is a considerable amount of ambiguity concerning the precise definition of contagion and how we should measure it. There exists no theoretical or empirical definition on which researchers agree. Broadly contagion can be referred to as the cross-country transmission of shocks or general cross-country spillover effects. However, in order to capture the phenomenon of contagion quantitatively we used a very restrictive definition suggested by the World Bank. It assumes that contagion occurs when cross-country correlations increase during “crisis times” relative to correlations during “tranquil times”1. The relation between contagion
and correlation has to be understood properly: contagion indicates that the cause of a shock in one country is the shock in another country and correlation – co-movement of markets in two countries can be result of a common shock, i.e. both movements can be triggered by an external, common cause.
This study contributes to the empirical literature in several ways. Firstly, we used the multiple sources of data. The Datastream, DTCC2 and BIS3 data analysis showed that investors protected themselves from the possible adverse effects that the current sovereign debt crisis can have on Germany, France and the UK. Thus, there may be a two-tier structure of contagion – problems that emerge on the peripheries of the European economy may create a distress at the core of the EU.
Secondly, we applied a wide array of quantitative methods that provide a more complete picture of the situation in the CDS market of the studied countries over long period of time.
1http://econ.worldbank.org/WBSITE/EXTERNAL/EXTDEC/EXTRESEARCH/EXTPROGRAMS/EXTMACROE
CO/0,,contentMDK:20889756~pagePK:64168182~piPK:64168060~theSitePK:477872,00.html.
2 Data are weekly published on the DTCC (Depository Trust and Clearance Corporation) website.
3 Data on the amount of bank exposures are taken from the Bank for International Settlements. More
The main idea behind Exponentially Weighted Moving Average (EWMA) is that moving average is calculated by weighting components with exponential factor, which makes recent values far more important to the final result than the older ones. EWMA correlation is a method with which we can see how the correlation between CDS spreads of different sovereigns changed in time and see if it increased during the crisis. Another employed method is Granger-causality test, which shows causal dependence in data. Granger causality is based on the assumption that if additional information improves the prediction accuracy of a time series (lowers the mean square error) then the additional information causes the original time series. We test if time series of CDS spreads of one sovereign Granger-causes the other. Impulse Response Analysis permits to analyse the impact of change in one variable on other variables in the system. It is a method often combined with Granger-causality test to establish the extent to which variables influence each other.
Finally adjusted correlation can be interpreted as a correlation adjusted for the bias resulting from an increase in volatility during crisis period. It is conditional on one of the sovereigns in pair being in distress.
The EWMA correlation analysis found that there were several waves of contagion and correlations increased already after the credit crunch in August 2007. Besides, it confirmed the role of the global financial crisis in triggering sovereign risk. Similarly, the Granger-causality test revealed that cross-country interdependencies increased after the global financial crisis as compared to the pre-crisis period. The adjusted correlation analysis confirmed that Greece and other PIIGS have lower capacity to trigger contagion than core EU countries. Moreover, Portugal is the most vulnerable, whereas the UK is the most immune to shocks.
The rest of the chapter is organized as follows. Section 2 analyses the Datastream and DTCC data on credit default swaps and the BIS data on cross-border exposures. Section 3 describes the main techniques and discusses the empirical results of the econometric analysis of CDS spreads. The last section concludes.
2.2
Data Analysis
The Datastream data was gathered on five-year CDS contracts issued on the bonds of nine sovereigns: Portugal, Ireland, Italy, Greece, Spain (PIIGS), France, Germany, the UK and the U.S. A credit default swap is a bilateral financial instrument that allows lenders to pass on the risk that a borrower will default. CDS spreads are quoted in basis points. Higher spreads indicate growing market expectations of a default on the underlying debt with a jump to a default spike at the time of the credit event.
The dataset under study spans from the period of August 2005 until September 2010. The first turmoil on credit derivatives markets took place in August 2007. The paths of CDS spreads from December 2007 are shown in Figure 2.14.
It is possible to identify four phases. Between December 2007 and September 2008 the CDS spreads of different countries were growing simultaneously, even though the range remained rather narrow. Between October 2008 and March 2009 the market was undergoing the consequences of the collapse of one of the largest American investment banks Lehman Brothers. CDS spreads widened considerably since the problems in the banking sector started spreading to sovereigns. Between April and September 2009 CDS spreads were narrowing in response to the taxpayer bailout that subsidized the risk. Nevertheless, bad debts of banks led to the rise of sovereign risk and since November 2009 CDS spreads were steadily growing again. In March 2010 they jumped
to very high levels and the significant differentiation between countries could be observed.
Figure 2.1 CDS spreads of PIIGS, France, Germany, the UK and the U.S. from December 2007.
Source: Datastream
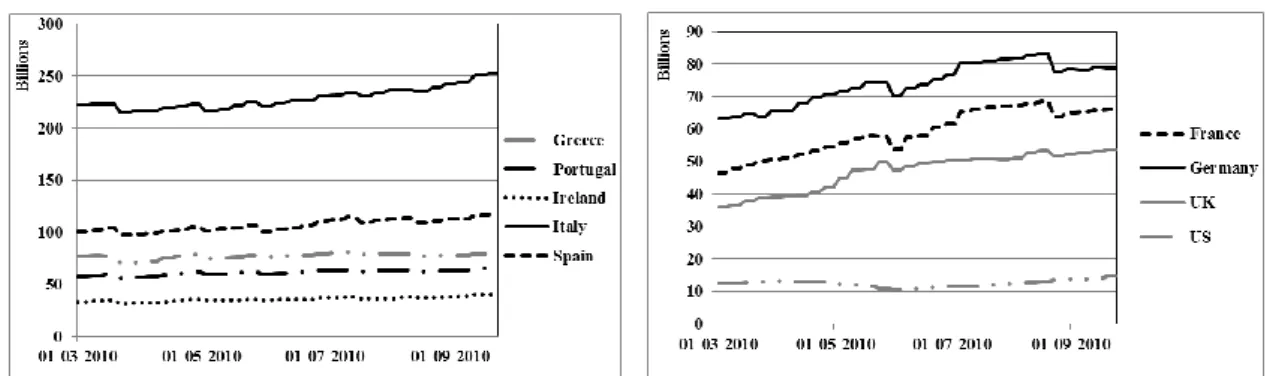
Figure 2.2 presents the movements of CDS spreads for PIIGS and core EU economies along with the U.S. from March to September 2010. Investigating the development of CDS spreads as the Eurozone sovereign crisis unfolded we clearly see that at the moment of the crisis investors were uncertain about the ability of Greece to repay its debt and the Greek CDS spreads surged in April 2010. However, investors continued valuing the riskiness of the Greek debt at high level even after its first bailout in May 2010 since the price of the Greek CDSs started growing again and peaked at the end of June 2010. The pattern of the Italian, Spanish, Portuguese and Irish CDS spreads is similar to that of the Greek, but the amplitude of movements is smaller. Moreover, since August 2010 with the Irish debt becoming more and more at risk we can see a clear rising trend in the Irish and Portuguese CDS markets.
For core European countries the behaviour of CDS spreads was not uniform. Thus, for Germany spreads returned to the previous values, for France they doubled, whereas the price of the UK CDS spreads considerably dropped. This may suggest that investors
did not worry about the influence of the Greek problems on Germany and the UK, whereas they seemed to anticipate some negative changes in France because of the turmoil in PIIGS. At the same time, for the U.S. we do not observe any major changes.
Figure 2.2 CDS spreads of PIIGS (left) and core EU countries and the U.S. (right) for March-September 2010.
Source: Datastream
The gross notional value of CDS contracts is reported on Figure 2.3. It is a sum of all notional values of CDS contracts issued on a given underlying asset. It represents the number of CDS trades and thus informs about the size of the market. The gross notional rose for all PIIGS, but the rise ranged between 10% for Greece and 25% for Ireland. The largest gross notional of CDS contracts was written on Italy (around $250bn) and Spain ($116bn), whereas the smallest value was recorded on Ireland and Portugal.
Figure 2.3. Gross notional of CDS contracts of PIIGS (left) and core EU countries and the U.S. (right) for March-September 2010. In bn$
What is interesting is that gross notional for core EU economies grew much stronger than for PIIGS. The increase for Germany, France and the UK was 20%, 30% and 38% correspondently. The largest gross notional value was recorded on Germany (around $80bn) and France ($67bn). What is also noteworthy is that within the same time period the gross notional value of the American CDS contracts increased only by 11%. This may suggest that Greek problems are mainly confined to the European Union and do not seem to cause much fear among American investors.
Figure 2.4 presents the sum of the net notional (NetN) positions of banks that hold CDSs on the underlying sovereign debt from March to September 2010. The net notional is calculated summing up the net position in an instrument of a single market player. The position is negative when more CDS are sold than bought and positive when more CDS are bought than sold. When NetN values grow it means that the positions of the market players are more unbalanced and investors increase their exposure to the CDS market. On the contrary, falling NetN values indicate that investors try to hedge more their positions.
Figure 2.4. Net notional of CDS contracts of PIIGS (left) and core EU countries and the U.S. (right) for March-September 2010. In bn$
Source: DTCC
For Greece, Portugal and Ireland the NetN fell after the first bailout decision in May 2010 by 16%, 15% and 13% correspondingly, whereas for Italy and Spain it first fell and then started increasing again. For France, Germany and the UK we see a clear
growing trend for the NetN which ranged between 23% and 33%, whereas for the U.S. again there were no considerable changes.
Thus, it can be observed that the problems of Greece triggered a surge in the CDS market activity of almost all of the countries under analysis. However, there are some differences between PIIGS, core European countries and the U.S.
Firstly, we can observe the withdrawal from the excessive exposure of PIIGS to one another since the net notional for these countries fell while the gross notional increased. This may suggest that the market players tried to hedge their open positions on the market by buying reverse contracts, which would decrease the net notional and simultaneously increase the gross notional and the number of signed contracts.
Secondly, investors buy/sell more protection on core EU players. Even though between March and September 2010 CDS spreads significantly increased only on France, there was a big market demand not only for the French CDS contracts, but also the German and the UK CDSs, since investors wanted to insure the debt they hold. This led to an increase in the net notional along with a fairly strong rise in the gross notional value.
Thirdly, the American CDS market was not significantly affected by the Greek problems – there was no major increase in spreads and gross and net notional values as a result of the turmoil in Greece.
2.2.1 The BIS data on cross-border exposures
The BIS data on cross-border exposures5 show how much banking systems of different countries are exposed to PIIGS and the UK and thus may incur losses as a
5 Bank For International Settlements' Consolidated Banking Statistics. Table 9C
The analysis of the cross-border exposures derived from the BIS data is pursued also in Chapter 4 section 4.6, but on a wider time span. The description of cross-border exposures is an important part of analysis here and thus is kept in place.
result of default of any of them. We use the data on an ultimate risk basis (i.e. contractual lending net of guarantees and collateral – see Appendix A for details on BIS data).
From Figure 2.5 we see that PIIGS hold the debt of one another. However, it appears that the banking systems that are mostly exposed to them are those of France, Germany and the UK. For instance, the joint claims of only these three countries’ banking systems on Greece, Ireland, Italy, Portugal and Spain constitute 69%, 60%, 71%, 43% and 62% of total claims of 24 reporting countries respectively6. We also see that almost all of the debt of PIIGS is held by the European banks. Its share ranges between 79% for Ireland and 95% for Portugal. The situation is slightly different for the UK where French and German banks hold smaller amounts of debt whereas the American banks holds 24% of total claims on the UK.
The exposure of the European banks to PIIGS has been growing since March 2005 for three consecutive years. After that, especially following the collapse of Lehman Brothers in September 2008 cross-border lending started decreasing. According to the BIS, at the beginning of 2010 for the first time since the Lehman Brothers collapse cross-border lending by banks rose again. Nevertheless, in the second quarter of 2010 it dropped considerably implying the outflow of capital from the European economies towards more stable regions.
6The joint claims of French, German and British banks on Portugal are slightly lower than on other
Figure 2.5. Cross-border banking sector exposures to PIIGS and the UK on the ultimate risk basis (2011Q1)
Source: BIS
The above findings suggest that the problems of Greece can trigger contagion that may affect not only other PIIGS but also core European countries since German, French
and British banks are highly exposed to PIIGS. Thus, we may have a two tier structure of contagion – problems that emergeon the peripheries of the European economy may create a distress at the core of the EU.
Moreover, the current sovereign debt crisis seems to be entirely European since the exposure of American and other countries’ banking systems to PIIGS is not particularly high. Besides, as we noticed before, the American CDS market did not significantly react to the problems of Greece. For this reason we excluded the U.S. from our further analysis.
2.3
Econometric Analysis of CDS Spreads
Since the data on CDS premia have a unit root we made them stationary by using log first differences.
)
log(
)
log(
ti ti1 i ts
s
x
(1)where
s
tiis the CDS spread of country i, i=1,…8 in periodt
andx
tirepresents log returns.2.3.1 EWMA Correlations of CDS Spreads
We started our econometric analysis by estimating correlations of daily CDS spreads between countries. The analysis of correlations to test for contagion was employed by Caporale et al. (2005). Moreover, several studies (Lopez and Walter (2000), Ferreira and Lopez (2005)) suggested that models based on the Exponentially Weighted Moving Average (EWMA) perform quite well and can be used instead of other more complex methods. Furthermore, Gex and Coudert (2010) showed that there is very little difference between EWMA correlations and DDC-GARCH (Dynamic Conditional Correlation GARCH) models.
The main idea of the EWMA is that the moving average is calculated by weighting components with an exponential factor. Recent values are of higher importance in the EWMA scheme. Thus, the further the data point is from the time for which the average is calculated the less influence it has on its value.
When the number of periods tends towards infinity the EWMA conditional correlations (𝑝̂𝑡 ) and EWMA variance (𝜎̂𝑡2) can be expressed in the following autoregressive form: 𝑝̂𝑡𝑖𝑗 (1 − ) j t i t x x1 1 𝜎̂𝑡−1𝑖 𝜎̂𝑡−1𝑗 + 𝑝̂𝑡−1 𝑖𝑗
, (2)
𝜎̂𝑡2 = (1 − )𝑥 𝑡−12 + 𝜎̂𝑡−12 , (3)where i is a triggering country; j is a given country in the sample; 𝑥𝑡𝑖and 𝑥𝑡𝑗 are the log first differences of CDS premia of country i and country j; is a parameter between 0 and 1;
tis the EWMA standard deviations of 𝑥𝑡.Parameter is a key parameter in the EWMA scheme as it affects the decay of weights. The parameter should be such as to minimize the root mean square errors of forecasts. Estimation method for is suggested in RiskMetrics by JP Morgan7. The procedure is following:
1. Compute returns for each CDS in the sample.
2. Initialize
0 and compute the EWMA variance for each CDS at each date, using0
(unique for the whole sample). The problem is to compute recursively variance on the first date. The solution is to use the squared return on day one as a proxy for the variance on day two. This has a drawback that variance has
to stabilize before converging to proper values, thus first few weeks of computations should be disregarded.
3. Compute the forecasting error (using the root mean square errors (RMSE) for each CDS in the sample).
4. Minimize the sum of RMSE using as a parameter. In our case is equal to 0.939.
Figure 2.6. EWMA correlations between Greece and other sovereigns (08.2005 – 09.2010)
Source: own calculations
Note: Since the data for the UK are available from November 2007 its correlation with Greece is shown as a straight line before this date
From Figure 2.6 we can see that the lowest correlations were observed before the “credit crunch” that occurred in August 20078. For pairs Spain”,
8 Since the data for the UK are available from November 2007 its correlation with Greece is shown as
Ireland” and “Greece-Italy” the correlations were strongly negative in a run-up to the financial crisis. This indicates that the CDS spreads of abovementioned spreads move in the opposite directions. After the “credit crunch” correlations increased for almost all of the pairs. However, the European Central Bank saved the banks that were infected by the American “disease”, and thus Europe survived the “credit crunch”. Nevertheless, after the Lehman Brothers collapse in September 2008 correlations clearly spiked again. This could possibly be explained by the high costs of the financial sector bailout that has been transferred to sovereign risk.
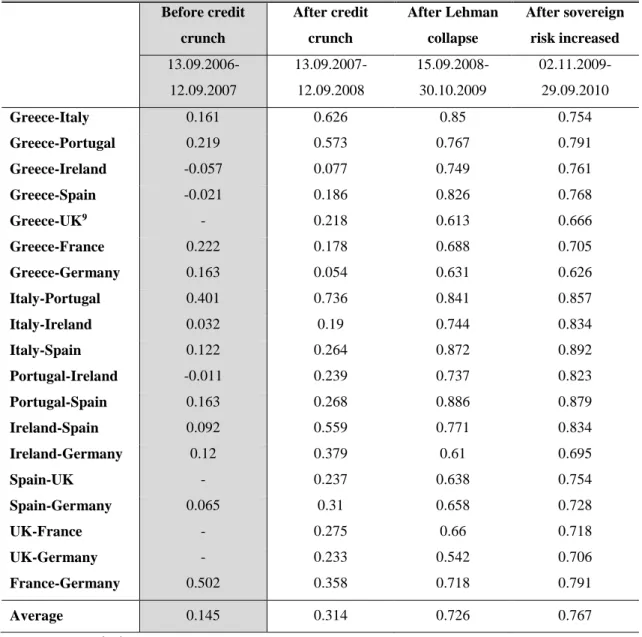
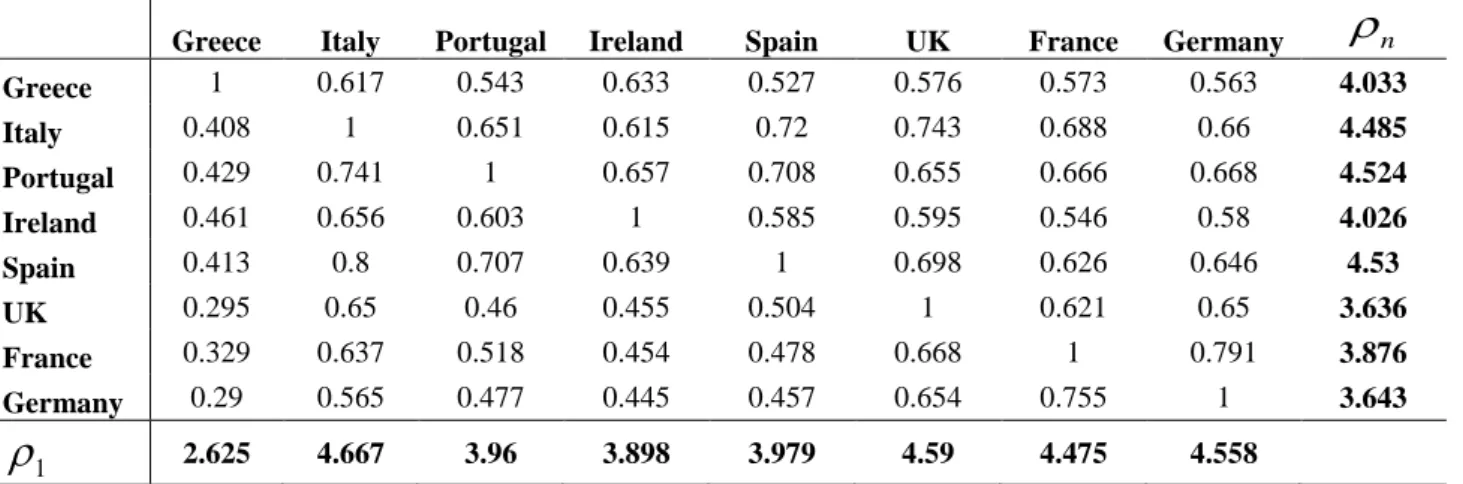
Since November 2009 when sovereign risk increased correlations between CDS markets grew further for most of the pairs. Table 2.1 shows that CDS markets of Portugal and Spain, Portugal and Ireland, Portugal and Italy, Italy and Ireland, Italy and Spain, Ireland and Spain were correlated the most, whereas correlations between CDSs of Greece and Germany, Greece and the UK, Ireland and Germany were the lowest. The analysis shows that the German CDS market was the most correlated with CDSs of France and the UK at the beginning of April 2010 when these core EU countries were taking a decision whether or not tobailout Greece. Besides, correlations between CDSs of Greece and Portugal, Italy and Ireland, Portugal and Ireland, Ireland and Spain, Ireland and Germany reached their maximum values after the bailout of Greece in May - June 2010.
The average values of correlations before the credit crunch were much lower (0.145) than after credit crunch (0.314) and again, these were more than twice lower than after Lehman Brothers collapse (0.726). Exceptions are correlations for CDS pairs France-Germany and Greece-France, Greece- France-Germany that were higher before the credit crunch than after the credit crunch. In case of the pair France-Germany this would suggest that investors treated the core countries alike before the credit crunch event (the
correlation was 0.502 which is relatively high to the average). In case of pairs Greece and France and Germany, the differences are not very big between periods (0.222 to 0.178 and 0.163 to 0.054 respectively), so it is difficult to conclude that differences are meaningful. What is important is the hike in all the correlations after the Lehman collapse. The significance of the changes can be tested with a model with dummy variables.
Table 2.1 Average correlations between chosen countries for different periods. The shaded “Before credit crunch” column is where average correlations are in general of lower values Before credit crunch After credit crunch After Lehman collapse After sovereign risk increased 13.09.2006-12.09.2007 13.09.2007-12.09.2008 15.09.2008-30.10.2009 02.11.2009-29.09.2010 Greece-Italy 0.161 0.626 0.85 0.754 Greece-Portugal 0.219 0.573 0.767 0.791 Greece-Ireland -0.057 0.077 0.749 0.761 Greece-Spain -0.021 0.186 0.826 0.768 Greece-UK9 - 0.218 0.613 0.666 Greece-France 0.222 0.178 0.688 0.705 Greece-Germany 0.163 0.054 0.631 0.626 Italy-Portugal 0.401 0.736 0.841 0.857 Italy-Ireland 0.032 0.19 0.744 0.834 Italy-Spain 0.122 0.264 0.872 0.892 Portugal-Ireland -0.011 0.239 0.737 0.823 Portugal-Spain 0.163 0.268 0.886 0.879 Ireland-Spain 0.092 0.559 0.771 0.834 Ireland-Germany 0.12 0.379 0.61 0.695 Spain-UK - 0.237 0.638 0.754 Spain-Germany 0.065 0.31 0.658 0.728 UK-France - 0.275 0.66 0.718 UK-Germany - 0.233 0.542 0.706 France-Germany 0.502 0.358 0.718 0.791 Average 0.145 0.314 0.726 0.767
Source: own calculations
9There are no values for the UK before the ‘‘credit crunch’’ since the data for the UK are available
In order to see whether there was contagion we have to verify whether correlations increased significantly during the crisis. We estimated regressions linking the EWMA conditional correlations (
t) to their lagged values and different crisis dummy variables as in Gex and Coudert (2010) and Chiang et al. (2007)10:t t t
t
D
0 1 1 2 (4),where
t is normally distributed error term and Dt is a dummy variable for the specified crisis period (equal to 1 during the crisis and 0 before):1 t
D
= 1 after 13.11.2007,D
t1 = 0 elsewhere; 2 tD
= 1 after 12.09.2008,D
t2= 0 elsewhere; 3 tD
= 1 after 02.11.2009,D
t3 = 0 elsewhere; 4 tD
= 1 after 15.04.2010,D
t4 = 0 elsewhereThe first dummy represents a hypothesis that the crisis started after the “credit crunch” in August 200711. The second dummy states that the crisis started after the
Lehman Brothers collapse. The third dummy assumes that the crisis period started when sovereign risk increased in November 2009. The fourth dummy states that the crisis started shortly before the EU-IMF bailout of Greece in May 2010. Using various dummy variables allows us to identify which of the above periods is the most significantly represented as the crisis period in the data.
The 2
R coefficient for all regressions we estimated with OLS methods remains above 90%. The coefficient for the lagged endogenous variable is always significant
10 It is important to underline that with the equation (4) we use following the abovementioned
papers, we can theoretically obtain estimates outside the range [-1, 1], which is a range within which the correlation values are kept.
11 Since we have data for all the sovereigns starting from 13.11.2007, we used this date as a starting
and close to 1 – this corresponds to the high value of we used12. The most interesting
result is the behaviour of the dummy variables as their statistical significance confirms the contagion effect13. D3 and
D
4 are the most significant (in 10 and 12 out 28 experiments respectively) which assumed that the crisis started in November 2009 and when the problems of Greece worsened respectively.D
1 is significant only in six cases, whereasD
2is significant in eight cases.Taking into account 28 experiments pursued for each dummy variable we can draw a conclusion that there were several waves of contagion defined in terms of an increase in conditional correlations14. Firstly, the global financial crisis played its role in passing on the risk in the banking system to sovereigns, even though PIIGS and core EU countries survived the “credit crunch” and the default of the financial giants like Lehman Brothers. Secondly, the persistent transfer of the costs of the financial sector bailout to the sovereign risk led to the high debt and deficit in the Eurozone and thus created a new wave of contagion in November 2009. Thirdly, the further deteriorating situation in Greece in March - April 2010 made financial markets extremely nervous and finally led to the EU-IMF bailout first of Greece and later of Ireland and Portugal.
2.3.2 Granger-causality analysis
In order to identify a causal relationship and its strength between CDS markets of different countries we constructed a vector autoregression (VAR) model. We applied the Granger-causality test and analysed impulse responses to see how long a shock introduced into the system may persist and what influence it has on the countries that are not directly affected by the shock. The analysis of VAR and Granger-causality to
12 By definition of moving averages EWMA correlations are strongly autocorrelated.
13 Results and significance levels can be found in Appendix D, Table D.6
assess financial spillovers was applied by Galesi and Sgherri (2009), Gray (2009), Khalid and Kawai (2003) and Sander and Kleimeier (2003).
The main idea of the Granger-causality test is the assumption that if one variable causes the other it should help to predict it, by increasing the accuracy of forecasts. In mathematical terms we may say that y fails to Granger-cause x if:
MSE[𝐸(𝑥𝑡+1|𝑥𝑡, 𝑥𝑡−1, … )] =MSE[𝐸(𝑥𝑡+1|𝑥𝑡, 𝑥𝑡−1, … , 𝑦𝑡, 𝑦𝑡−1, … )] (6) In order to test for the existence of Granger-causality we need to estimate an autoregressive model with lag p:
𝑥𝑡 = 𝛼0+ 𝛼1𝑥𝑡−1+ 𝛼2𝑥𝑡−2+ ⋯ + 𝛼𝑝𝑥𝑡−𝑝+ 𝛽1𝑦𝑡−1+ ⋯ + 𝛽𝑝𝑦𝑡−𝑝+ 𝜀𝑡15 (7)
and then do an F-test of the null hypothesis:
𝐻0 ∶ 𝛽1 = 𝛽2 = ⋯ = 𝛽𝑝 = 0
If coefficients by y are not statistically significant, it means that y does not bring any new information into forecasting of x and thus is not Granger-causing x16.
One of the important issues in constructing a VAR model is a proper choice of the lag length. Some researchers choose it arbitrarily allowing just enough lags to ensure that the residuals are white noise but maintaining the precision of estimates. There are also some procedures that determine the appropriate lag length such as the Akaike information criteria (AIC), the Schwartz information criteria (SIC) and the likelihood ratio (LR) test17. In our case the LR test is inconclusive, whereas the AIC and SIC tests
find different optimal lag lengths to be employed. We think that just one lag suggested by the SIC test may not be enough to investigate the causal relationship over long periods. Therefore, we used the lag length suggested by the AIC test (three lags for the period before the crisis and six lags for the period after the crisis). In order to better
15Our diagnostic tests reveal that the series have unit roots but are not cointegrated. Thus, we
perform the analysis on first differences of CDS spreads.
16 The idea of Granger-causality is explained further in Hamilton (1994).
check for the robustness, the test of the model with different lag values should be considered as well.
In order to see changes in the existence of causality between CDS markets of different sovereigns we investigated two periods: a pre-crisis period (August 18, 2005 – August 15, 2007)18 and a crisis period (November 14, 2007 – September 29, 2010)19.
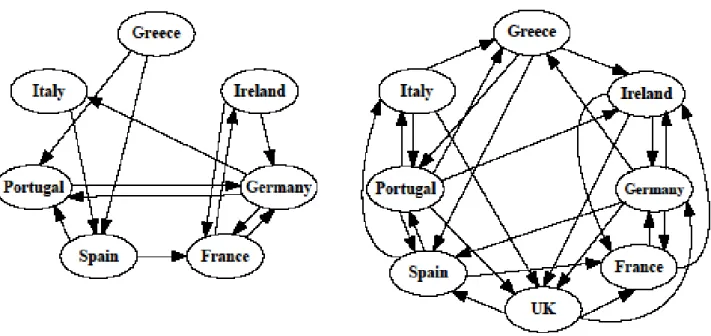
Figure 2.7 presents the results of the Granger-causality test. In the pre-crisis period we identify 13 cross-country causations. There are three interesting findings here. Firstly, changes in the Greek CDS market cause changes in the CDS markets of other Southern European countries (ex. Portugal and Spain), whereas the CDSs of Greece are not Granger-caused by CDSs of any other country. It can thus be suggested that the Greek CDS market could be the source of the problems even before the crisis started. Secondly, the CDSs of Spain affect the CDSs of Portugal but with no reciprocal effect. Thirdly, in the pre-crisis period there is a significant interdependence between the CDS markets of France and Germany.
In the crisis period interdependencies between countries increased compared with the pre-crisis period (27 statistically significant casual relationships, at a probability level 0.1)20. It is interesting to note that during the crisis changes in the CDS spreads of
Greece affect not only the CDS markets of Portugal and Spain as in the pre-crisis period, but also the CDSs of Ireland. The pre-crisis CDS market of Ireland Granger-causes only the CDSs of core EU countries with no reciprocal effect. Unexpectedly, changes in the Irish CDSs do not cause changes in the CDS markets of other PIIGS and only CDSs of Portugal and Greece have a significant causal effect on the Irish CDS market.
18 Since the data for the UK are available only for the period after November 2007 we did not perform
the test on the UK for the pre-crisis period.
19 To have a greater number of observations to determine causality we considered that the crisis
period started after the credit crunch in August 2007 through the sovereign debt crisis.
Figure 2.7. Granger-causality for the pre-crisis (left) and crisis period (right)
Source: own calculations
What is surprising is that among PIIGS the Portuguese CDS market Granger-causes changes in the CDS spreads of all the countries in the sample apart from France and Germany. The pre-crisis CDS spreads of Spain cause changes in the Italian, Portuguese and French CDS spreads. Besides, in contrast to the pre-crisis period the test reveals Granger-causality between CDS spreads of Portugal and Spain in both directions in the crisis period (one-third of the Portuguese debt is held by Spain).
Among core EU countries the German CDS market exerts the highest impact and Granger-causes the CDSs of all the countries apart from Italy and Portugal. The CDS market of France affects only the CDSs of Ireland and Germany which along with Spain and the UK Granger-cause the French CDS market. The CDSs of the UK have a significant effect on the CDSs of Spain, France and Germany with the reciprocal effect of the German CDS market on the UK. The CDSs of the UK are also affected by some of the PIIGS (Italy, Portugal and Ireland).
2.3.3 Impulse Response Analysis
Impulse response analysis is often combined with Granger causality in order to understand the impact of one variable on the rest of variables in the system. In impulse response we introduce a shock to one of the variables of the model and examine how this shock spreads throughout the system in consecutive periods of time. In other words we are trying to understand the response of variables of the model to a shock on the value of a particular variable. In our case impulse response analysis can be informative in terms of understanding which country’s CDS market has the biggest impact on the rest of the countries and when the impact lasts the longest.
We start from stationary K-dimensional VAR(p) model21, where p is a number of lags and number of dimensions (k) is equal to the number of countries in the sample,
𝑦𝑡 = 𝐴1𝑦𝑡−1+ ⋯ + 𝐴𝑝𝑦𝑡−𝑝 + 𝑢𝑡, (8)
where 𝑦𝑡is a (K x 1) vector of observable time series variables, the 𝐴𝑗 (j = 1…p) are (K x K) coefficient matrices and 𝑢𝑡 is (Kx1) error term with 𝑢𝑡~ (0, Σ𝑢), where Σ𝑢 = {𝜎𝑖𝑗, 𝑖, 𝑗 = 1,2 … , 𝐾}. When we represent the above process as a MA process we can obtain so called forecast error impulse responses 𝜙𝑠.
𝑦𝑡 = 𝑢𝑡+ 𝜙1𝑢𝑡−1+ 𝜙2𝑢𝑡−2+ ⋯, (9) where:
𝜙𝑠 = ∑𝑠𝑗=1𝜙𝑠−𝑗𝐴𝑗, 𝑠 = 1,2 …. (10) and 𝜙0 = 𝐼𝐾 (11)
21 The classic handbook about the time series analysis, where a VAR models are well explained is
If we introduce a shock to the system by setting jthvariable to a unit and the rest of
variables to zero (for example if j = 2 then we set 𝑦0 = [ 0 1 ⋮ 0
]), then 𝜙𝑠 tells us the
response of the whole system in the sth period after the introduction of the shock to the
jth variable22.
The main problem of the above approach to the impulse response function is the assumption that we introduce a shock only to one variable at a time. This assumption disregards possible correlations between shocks in variables and as we investigate contagion, cross-correlations are essential to us by definition. Thus, the problem is how to isolate the effect of a shock on a variable of interest from the influence of all other shocks. The most common approach is an orthogonalisation of a covariance matrix of error terms Σ𝑢. By orthogonalisation we obtain a new matrix, which has zero
non-diagonal elements and thus solves the problem of the correlation of errors between variables.
Unfortunately, simple orthogonalisation, such as the most common procedure – Choleski factorisation, cannot be a solution in our case as it is sensitive to the ordering of variables23. The first variable of the system, by construction, explains the other variables and hence the variable the least influenced by other variables should be chosen. Problem arises in case of contagion and financial systems as we assume that they constitute a highly interconnected network and it is very difficult to conclude a priori which country is the least influenced by the others. There is also a weak assumption that a shock hits the system only through a triggering variable and that there is no correlation between the initial shock in one country and another.
22 Forecast error impulse response is treated thoroughly in Lütkepohl (2005).
23 More on Choleski orthogonalisation and non-orthogonal impulse response analysis in: Wang (2009),
To address this issue we use the generalized impulse response function (GIRF) developed by Pesaran and Shin (1998), which is invariant to changes in ordering of variables. Generalized impulse response function (GIRF) is equal to:
(𝜙𝑛∑ 𝑢𝑗
√𝜎𝑗𝑗 ) (
𝛿𝑗
√𝜎𝑗𝑗)
, n=0,1,2…. (12)
which is a (K x 1) vector of response to the shock in the jth equation at time t on xt+n, where 𝜙𝑛 is the nth forecast error impulse response. If we set the shock in jth variable to
𝛿𝑗 = √𝜎𝑗𝑗, then the scaled generalized impulse response function shows the effect of
this shock to expected value of the xt+n:
𝛹𝑗𝑔(𝑛) = √𝜎𝑗𝑗𝜙𝑛∑ 𝑢𝑗, n = 0,1,2…. (13)
An interesting feature of generalised impulse response is that it is equivalent to an orthogonal impulse response function for the first equation. This permits to calculate
𝛹𝑗𝑔(𝑛),j=1,2…K by calculating orthogonalized impulse response with each variable as
a leading one.
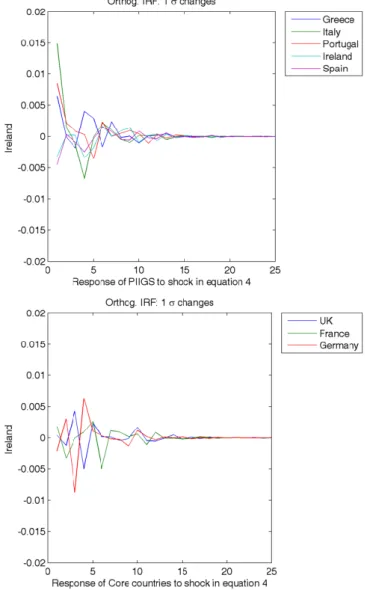
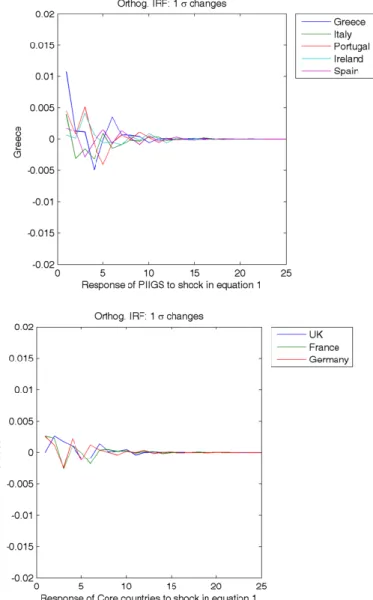
We calculated the generalized impulse response for the crisis period (November 14, 2007 – September 29, 2010) and used six lags as in the Granger-causality test performed for the crisis period. We introduced a positive shock of one standard deviation to the spread of CDS of each country and observed changes in basis points. The positive shock to CDS spreads means an increase of the risk of default on the sovereign debt. The shock in GIRF is not independent for all variables. It hits the whole system according to correlations between CDS spreads of all countries. In general we can observe that the effect of the shock lasts for around 15 days and after that the whole system converges to the initial state. Below we present chosen results.
From Figure 2.8 we can see that the response of the system is relatively strong to a shock in the Spanish and Irish CDS markets (in comparison with a similar shock in the
CDS markets of other PIIGS). A shock in Spain causes a turmoil in the CDS spreads of PIIGS, whereas it does not strongly affect core countries. Besides, the shock to the core transmits with some delay.
Source: own calculations
The response of the system to a shock in the French and German CDS markets is also strong, which is understandable considering the size of these economies. Interestingly, a shock in the Portuguese CDS market causes a strong response for PIIGS, whereas the response is rather weak for the core, which confirms the results of the Granger-causality test for Portugal.
At the same time, the IR to a shock in the CDS market of Italy and the UK is relatively weak (with the exception of the Italian CDS market that reacts relatively strongly to shocks in the UK). Similarly, the response to a shock in the Greek CDSis weak, especially for Germany, France and the UK (Figure 2.9).
Figure 2.9. GIRF after one standard deviation shock in the Greek CDS
Source: own calculations
The Italian CDS market reacts to shocks stronger than the CDS markets of other countries in the sample, whereas the CDS market of the UK has one of the weakest responses. The latter could be explained by the fact that investors perceive the UK as the most immune to the Eurozone problems among the examined European countries.
We performed a robustness test of the results of the impulse response analysis. Unfortunately, the strength and the persistence of responses are not robust to changes in the number of lags in the VAR model, however, the relative differences between CDS markets of the countries in the sample seem to hold.
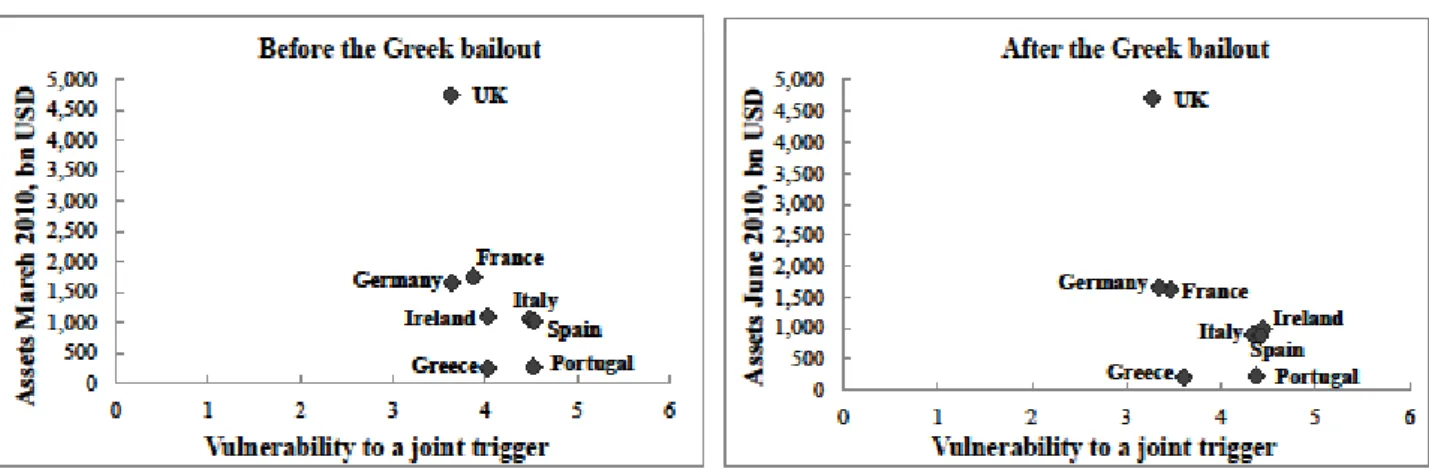
2.3.4 Adjusted Correlation Analysis of CDS Spreads Before and After the Greek Bailout
The Granger-causality test and the IR analysis were informative in studying the relationship between CDS markets of the countries in the sample. However, a VAR model requires a sufficient number of observations in order to determine causality. Therefore, for the VAR model we studied a longer crisis period that spanned from the credit crunch in August 2007 through the sovereign debt crisis until September 2010. Since the problems of Greece in March-April 2010 made financial markets extremely nervous it is also important to have a closer look at the relationship between CDS markets just around the period of the Greek bailout in May 2010.
The unconditional Pearson correlation coefficient increases automatically with a surge in volatility during crisis times and, therefore, can provide misleading results24. Boyer (1999) and Forbes and Rigobon (2002) suggested the adjustment that considers changes in volatility:
𝜌
𝐶=
𝜌𝜌 √𝜌𝜌2+(1−𝜌𝜌2)𝜎X# 2 𝜎X𝐶2 (5) where 𝜌𝑃 =Cov(X,Y)σXσY is a Pearson coefficient that is calculated for each pair of
sovereigns X and Y (we assume that sovereign X is a trigger); 𝜎X#2and 𝜎X𝐶2 are the variances of CDS spreads of the triggering sovereign before the crisis and during the crisis respectively.
Inspecting equation (5) we see that the conditional correlation coefficient can increase because of the change in the underlying relationship between sovereigns and/or because of the change in volatility. Since we are interested in the increase in the