85rd Annual Conference of the Agricultural Economics Society Warwick University, 18 ‐ 20 April 2011
Comparing technical efficiency of organic and conventional coffee farms in
Nepal using data envelopment analysis (DEA) approach.
Krishna Lal Poudel, PhD student
Department of Environment and Resources. University of Miyazaki. Gakuen Kibanadai-Nishi 1-1.Miyazaki, 889-2192. Japan. Email: [email protected]
Naoyuki Yamamoto, Professor
University of Miyazaki. Interdisciplinary Graduate School for Agriculture and Engineering. Japan. Email: [email protected]
Yasuhiro Sugimoto, Professor
University of Miyazaki. Interdisciplinary. Graduate School for Agriculture and Engineering. Japan. E-mail: [email protected]
Aya Nishiwaki, Professor
University of Miyazaki. Interdisciplinary Graduate School for Agriculture and Engineering. Japan. E-mail: [email protected]
Hideyuki Kano, Professor
University of Miyazaki. Interdisciplinary Graduate School for Agriculture and Engineering. Japan. E-mail: [email protected]
Abstract
Data Envelopment Analysis (DEA) approach used to estimate technical efficiency and followed by regressing the technical efficiency scores to farm specific characters under tobit regression model. Primary data was collected from random samples of 240 (120 from each) coffee famers. Mean technical efficiency score was 0.89 and 0.83 in organic and conventional coffee farming respectively. Farms operating under CRS, DRS and IRS were 31.67, 3.83 and 37.5%
respectively in organic coffee and 29.17, 25 and 45.83% respectively in conventional farming areas. Tobit regression showed the variation in technical efficiency was related education, farm experience and training/extension services and excess to credit.
Introduction
Growing awareness of health and environmental issue in agriculture has demanded production of organic food which is emerging as an attractive source of rural income generation (Bhattacharya and Chakra borty, 2005). The organic movement began in the 1930s and 1940s as a campaign to minimize the overwhelmingly growing reliance on synthetic fertilizers. Organic farming is a form of agriculture that relies on sustainable production system maintaining feasible crop rotation, green manure and farm-yard manure with paying greater attention towards biological pest control so that soil properties keep improving. Increased interest in environmental issues has sparked a significant movement in favor of organic or ecological farming. This is because organic farming involves several environmentally friendly growing methods and also responds more effectively to consumers' growing interest in food safety. Despite the uncertainty of financial viability, there has been expanding organic enterprises worldwide. Lotter (2003) estimated that USA and European Union has annual growth rate of 20% and 25% respectively. This market expansion makes it possible for farmers to reap the benefits of a trade with relatively high price premium (Yussefi and Willer, 2002).In term of output, leaving some exceptions, organic crops have lower than conventional (Morris et al. 2001).However it is contradicts with the finding in Indian experiments (Bhattacharya and Chakraworty, 2005) that the productivity of organic farming may be less in initial years, but the yield increases progressively under organic farming equating the yield under inorganic farming by sixth years. As with any other agricultural products, development of organic system requires considerations of its economic viability. It mainly depends on products price. Adoption of organic farming methods often depends on
favorable market price (price expectation) for products (Pacini et al. 2002; Morris et al. 2001).
Nepal is agricultural country which gives employment to more than 65 % of the populace (MOAC, 2009). Peasants have average land holding of less than 1.0 ha. (CBS, 2007). Nepal
has a great potential to produce organic coffee by utilizing its long back production system called as organic by default. Both types of coffee are grown with shade crops of multipurpose tree species. In terms of area and production, coffee has tiny presence in the world coffee arena. However, organic coffee has been getting niche markets since decade. This gradually accelerated the extension of farming in the rural areas of Nepal. Small fraction of production zone is certified as organic. Farmers are affiliated either to small groups or cooperatives and have vertical linkage to district level cooperative. This is the fundamental success in producing coffee. It could be an important means for the soil conservation; bio-diversity maintenance and watershed balance in the mid-hills of Nepal (Nepal, 2006). Farmers have been producing coffee without external inputs even in nonorganic belts. Organic coffee has been exporting overseas market niches such as Japan and South Korea; 30 mt. each year since 2005 and other coffee in USA, Germany and other EU member countries (TEPC, 2009). Coffee industry is in rudimentary stage and still unable to yield extra economic leverage and excess production. However, it has been a livelihood support for many rural and marginal people in mid-hill region. NTCDB (2009) estimated that coffee production engages around 15,000 farm families. The productivity of coffee is very low and farmers are unable to identify the causes and its resolution measures. Because of poor investment capacity, they are not involved in complete value addition which could provide additional farm income. Despite these hurdles, the expansion of total coffee cultivation area, production and productivity has been increased by 17, 24.36 and 6.5%
respectively. The growth rate of area, production and productivity of organic coffee were 15.75, 16.48 and 0.62% respectively (MOAC, 2009). The slow growth rate of productivity of organic coffee in the backdrop of higher demand in the international markets was appealing for analyzing the production management from farm to fork in complete package. This research was designed accordingly and this part explains about production aspects only.
Government of Nepal envisages accelerated agricultural growth through cash crops such as coffee (APP, 1995). Cultivation of shade coffee, Arabica variety with marketable intercrops is way of farming in the region. Shade crops are multipurpose tree species ensuring additional farm income. Intercropping is the growing of two or more crops simultaneously on the same parcel of land with distinct row arrangement (Ruthenberg, 1980). It has been associated with advantage such as better utilization of environmental factors, greater yield, soil protection and socio-economic betterment (Beets, 1982). The way to increase productivity in small scale farming system is to use available set of resources efficiently. The production process has momentous impact from variable inputs like seeds, fertilizers, capitals, labor employed and other managerial skills. Production economics is related to optimization and optimization implies efficiency. Bravo-Ureta and Rieger (1991) explained that efficiency measurement is important because it leads to a substantial resource savings. Efficiency measures can be estimated using nonparametric and parametric approaches (Varian, 1984). Data envelopment analysis (DEA) is a nonparametric method. The nonparametric approach does not impose any parametric restrictions on technology and there is no need of a functional form for production relationships which is thus considered more flexible to calculate efficiencies (Fare et al., 1985; Chavas and Aliber, 1993; Featherstone et al., 1997 and Ray, 2004). But is enriched with two disadvantage: it does not allow direct hypothesis testing (Ray, 2004) and derived measures of inefficiency are
confounded with the effects of noise, measurement errors, and exogenous shocks beyond the control of production entity ((Färe et al., and Ray, 2004).
Study area, sampling and data collection
Gulmi and Palpa districts in the western mid-hill region of Nepal were purposively choosen study area. Gulmi is the only group certified organic Arabica coffee producing location which maintains its production above 800 meter from sea level. Since 1998, NASAA accredited certification in group approach is following the strict measures for organic farming with articulate internal control system. Palpa is adjoining district producing same variety of coffee with more or less equal farm altitude with out organic certification. Both types of coffee production are shade coffee. The basic difference is holding organic certificate and farm management practices. In Gulmi, completely organic in input supply. Framers in Palpa use both organic and inorganic sources of inputs such fertilizer and plant protection measures. Albeit, the chemical fertilizers and other external inputs usage is gradually reduced. Most of the elite farmers called it as conversion period.The data was collected in 2010 from interviews with 120 randomly selected coffee farming households selected from 454 households in 3 Village Development Committee (VDC) in the Palpa district. The selected VDCs were Archale, Argali and Bhairabsthan. And equal sample of 40 from each VDCs with randomly after complete enumeration of coffee growers. VDCs selection was purposive in Gulmi because to ensure the vicinity to Palpa and matching social and ecological resemblances. Research envisages understanding the economic differences in respect to different in farm size and altitude variation. Five VDCs were covered in generating data. Sample size were 34, 18,18, 28 and 22 in Apchaur, Arkhale, Balithum, Deegam and Huga VDCs of Gulmi districts
Primary data were obtained through face-face interview with administering the pre-tested semi-structured questionnaires. Besides, Participatory Rural Appraisal (PRA) tools such as Focus Group Discussion (FGD), Key Informant Survey (KIS) and ranking were deployed for assessing information and observing general understanding. These selected VDCs are pre-dominantly coffee producing and have a similar topography, soil type and irrigation environment. The data was for the 2009 normal coffee growing year. The surveyed areas ranged between 800 to 1410 m above sea level in Gulmi and 800 to 1050 m in Palpa district. Sampling elements were owner operated, has similar livelihood objectives and face a similar socio-economic and marketing environment for factors and products. Both types of coffee production in the area ascribes to cash generating and environmental conservation means in gentle to moderate slope and mostly north-facing landscape adjoining to natural forest owned as community forestry programme. Farmers are abided to either of the farmers group or local cooperatives and district coffee producer’s association (DCPA) in Gulmi and Palpa districts respectively.
Analytical Framework
This study used two step methodologies, first, data envelopment analysis (DEA) to model technical efficiency in variable inputs management and second, the farm specific variables such as age, family size, education, training and gender for assessing variation in farm inefficiency under tobit regression frame work. To our knowledge there are no studies that have estimated technical efficiency comparison between organic and non-organic coffee production in Nepal. The objective of this study was to estimate the technical efficiency of both types of farming and evaluating the factors affecting farm inefficiency of each farming category of coffee in rural region of Nepal.
Data Envelopment Analysis (DEA)
The general agreement towards sustainable economic development is promoting productivity and output growth in the agricultural sector, particularly among small-scale producers. To achieve productivity growth, either technological innovation or the better efficient use of available technologies or combination both is inevitable. Empirical evidence suggests that small farms are desirable not only because they reduce unemployment, but also because they provide a more equitable distribution of income as well as an effective demand structure for other sectors of the economy (Bravo-Ureta and Pinheiro, 1993, 1997). During the last few decades, major technological gains stemming from the green revolution have been effective across the developing world. This suggests that attention to productivity gains arising from a more efficient use of existing technology is justified (Bravo-Ureta and Pinheiro,1993, 1997; Squires and Tabor, 1991). In developing countries, most new agricultural technologies have only been partially successful (Xu and Jeffrey, 1998). It will be more cost effective to motivate farmers in improving efficiency rather than grafting new technology if farmers are not efficiently using existing technology (Shapiro 1983, Belbase and Grabowski, 1985). It would work well in case of Nepalese resource poor and marginalized farm characteristics. Because, Government of Nepal has been incapable in improving productivity growth despite her long implementing periodic plan and programme. This sort of study will carry pertinent messages to moderate and rethink towards formulating long term production planning of high value cash crop.
The evaluation of farm performance is usually based on economic efficiency. The primary understanding is technical efficiency which allows understanding for efficient allocation of available scarce resources which has been procured within the defined farm budget ceiling. TE defined as the ability of a farm to either produce the maximum possible output from a given set
of inputs and a given technology, or to yield the given level of output from the possible minimum quantum of inputs. Fare and Lovell (1978) defined technical efficiency as the “degree to which the actual output of production unit approaches its maximum.” Seminal paper of Farrell (1957) has been a growing interest in methodologies and applications to efficiency measurement. Banker et al (1984) and Fare et al. (1985, 1994) have proposed the input oriented DEA approach to illustrate TE via linear programming (LP) method. LP used in Data Envelopment Analysis (DEA) constructs a non-parametric piece-wise frontier over the data (Coelli et al. 2005).Technical Efficiency (TE) measures are then calculated relative to this surface. Farrell (1957) proposed this piece-wise-linear convex hull approach to frontier estimation. This paper wish to utilize DEA in constant return to scale (CRS) model. Assuming that, the farm is entitled with N inputs and M outputs. Inputs and output vectors of i-th firm then becomes N*I input matrix of X and M*I output matrix of Q. Ratio of all output to overall inputs is expected under DEA approach via assigning optimal weights by solving mathematical programming problem. We followed Coelli et al. (2005) in formulating solving equation.
Max u,v{u'qi/v'xi}, u= M*I vectors of output weights and v= N*I vectors of inputs weights. Subject to u’qj/v'xj ≤ 1, j= 1, 2, 3…I
u,v ≥ 0. (1) Equation developed in 1 involves solving for u and v, such that the efficiency measures for the i-th firm is maximized subject to i-the constraints i-that efficiency value be less i-than or equal to 1. To overcome the problem of infinite number of solution from this specific ratio formulation, impose the constraints, v'xi=1, then
Max μ,v{ μ'qi} Subject to v' xi = 1
μ'qj-v’xj ≤ 0, j= 1, 2, 3 (2) μ,v ≥ 0 (3) The problem formulated in (3) is known as the multiplier form. Finally the derivation of an equivalent envelopment by introducing the duality in linear programming is:
Min θλθ
Subject to –qi+ Qλ ≥ 0, θXi- X ≥ 0,
Qλ ≥ 0 (4) Where λ is a I*1 vector of constant, θ is a scalar and efficiency scores for the i-th firm which satisfies: θ ≤ 1. Here θ is independent of input prices.
Charnes et al. (1984) and Fare et al. (1994) used this input oriented DEA model under CCR assumption to solve the overall technical efficiency.
(5)
If θ = 1, the farm in on the frontier and technically efficient If θ < 1, the farm lies below the frontier and technically inefficient.
Farm specific factors responsible for technical inefficiency were measured through the second stage regression model. This sort of analysis was found in Dhungana (2010), Dhungana (2004), Wadud and White (200), Sharma et al. (1999), Hallam and Machado (1996), Parikh and Shah (1995) and Kalirajan (1991). Early methodologies were based on deterministic models that attribute all deviations from the maximum production to efficiency; recent advances have made
it possible to separately account for factors beyond and within the control of firms such that only the latter will cause inefficiency. The popular approach to measure the technical efficiency component is the use of frontier production function (Tzouvelekas et al., 2001, Wadud and White, 2000, Sharma et al., 1999, Battese and Coelli (1995), Aigner et al. (1977). The present study employs the empirical model,
(6)
Where TE is efficiency index (between 0 and 100) from DEA were used as binary dependent variable, Z1= household size, Z2= education, Z3= sex, Z4= training/extension, Z5= age, and Z6 = farm experience, β is a vector of unknown parameter associated with the farm specific covariates, and is an independently and identically distributed normal random variables with zero means and common variances, as;
To the immediate moving, it is noted that the dependent variable in the regression equation (6) can not have normal distribution. It has a censored distribution (as TE lies between 0 and 100). Because OLS yields inconsistence estimates, we follow maximum likelihood approach to estimate the parameters of tobit regression model (6).
Results and discussions
Notations and definitions of variables incorporated to research study are illustrated in table 1. Inputs and outputs, and socio-demographic parameters were considered for empirical analysis. A summary descriptive statistics of agro-economic characteristics of the organic coffee production and conventional farms/farmers are depicted in table 2. The first section of table describes about farm economic characteristics and lower section about socio-demographic information. Plant density and coffee output was recorded higher in conventional along with higher labor consumption. The fertilizer cost is about three times higher in organic coffee farm. This eventually led the higher TVC to organic than conventional and thereby lower GM and non-discounted benefit ratio (Table 2). It is found difficult to calculate the organic farm gate price within country. We generally understand that there is low cost for organic production compare to conventional one. The restriction on the use of chemical fertilizers, pesticides and feed concentrates on organic farm results on reduction of cost of production (Morris et al.2001). In 21 European countries, Madder et al. (2002) found that fertilizer and energy were 34 to 53 % lower and pesticide 97% lower on organic than conventional farm. This seems comparatively cheaper production of organic products. However, Morris et al. (2001) opined that reduction in machinery depreciation with reduced fertilizers and spray application on organic farms may be
offset by additional use of mechanical weed control and tillage operation. Farmers are avoiding chemical inputs but taking organic equivalents would ultimately yield more or less same cost for production. A recent study by Greer et al (2008) on comparing the financial performance of organic and conventional farms in New Zealand also concluded that there are no significant differences in the economic outcomes of the management system.
Table 3 shows the descriptive statistics for estimated TE obtained from DEA Excel Solver 2.0 computer programme developed by Jhu (2002). Technical efficiency ranged from 0.62 to 1.00.When TE gets closer to one, the farm is considered more technically efficient. Mean technical efficiency score was 0.89 in organic coffee farms. This means, in principle, that sample farms can potentially reduce their inputs of coffee production on average by 11% and still achieve the same level of output from the existing technology. Coffee farms operating with more than 80% technical efficiency were 75% of the sampled farms. Approximately 53% of the farmers achieved more than the average technical efficiency. Farms operating under CRS, DRS and IRS were 31.67, 3.83 and 37.5% respectively (Table 4).The average coffee output in the farms operating under CRS was higher than DRS and IRS.
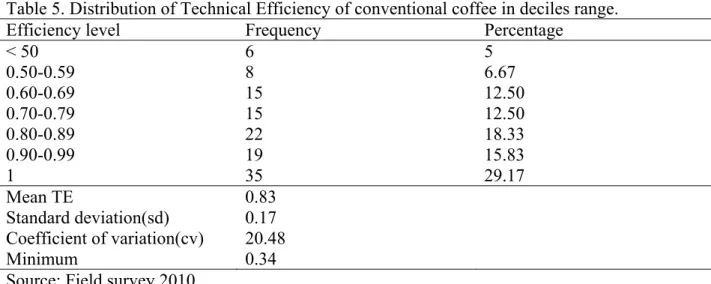
Similarly, table 5 shows the descriptive statistics for estimated TE obtained in conventional coffee farms. Technical efficiency ranged from 0.36 to 1.00 and mean technical efficiency score 0.83. This means, in principle, that sample farms can potentially reduce their inputs of coffee production on average by 17% and still achieve the same level of output from the existing technology. In this category, farms operating less than 50% technical efficiency were 5%. Coffee farms operating with more than 80% technical efficiency were 63.33% of the sampled farms. Farms achieved more than the average technical efficiency in conventional system is 60%. Farms operating under CRS, DRS and IRS were 29.17, 25 and 45.83% respectively (Table 6).The
average coffee output in the farms operating under DRS was higher in conventional coffee farming. The coefficient of variation explains the consistency of TE in two different farming system revealed that farms in organic system were more consistence and relatively efficient in input management than conventional one..
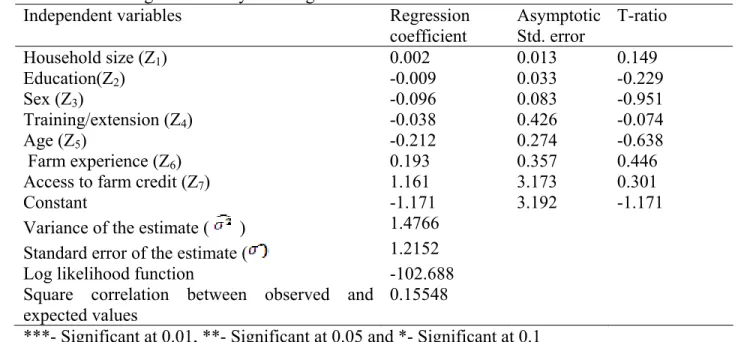
An application of tobit command for regression with limited dependent variables was used to estimate factors associated to technical efficiency as illustrated in equation (12). The sources of inefficiency were examined by using the estimated β-coefficient (as regression coefficient in SHAZAM version 10.0 output). The inefficiency effects were specified as those relating to family size, education, gender, training, age and farming experience. The maximum likelihood estimation of determinants of technical efficiency was calculated differently to organic and conventional farms. The results are presented in table 7 and 8 for organic and conventional farming respectively.None of the factors were found statistically significant in organic coffee farming (Table 7). The coefficient of household size, farming experience and access to credit were positive. The importance of farming experiences in agricultural enterprises were presumed and followed the findings of Dhungana (2010), Inoni (2006), Dhungana (2004), Kebede (2001) and Coelli and Battese (1996). This indicates that farmers with more years of experiences may be contributing towards better doing in coffee farming. House hold size is the industry to supply farm labors in Nepalese farming context. It will have setback in Nepalese coffee industry in the near future because of rapid migration from hill region to either city areas of Nepal or to overseas searching lubricant jobs. The coefficient of education was negative and this suggested that organic coffee production is not related with educational background. This was in line with Umoh (2006), reported that education does not contribute to farm efficiency in studying urban farming in Nigeria.
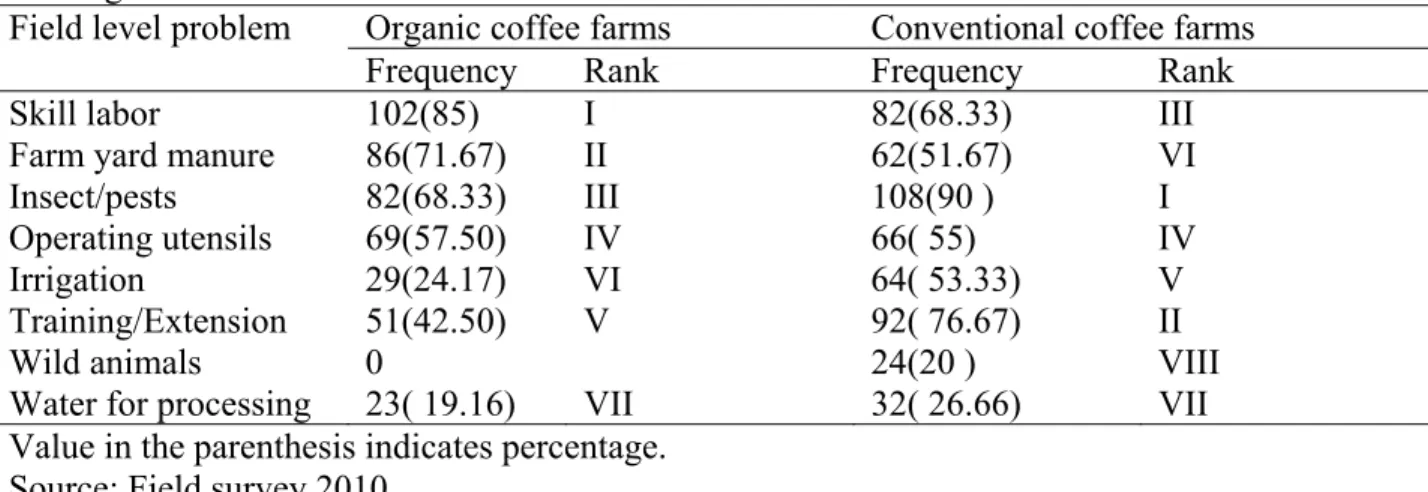
Similarly, the estimated coefficients of most of the factors were not significant except for age of the farm manager in conventional coffee farming (Table 8). However, most of the factors had positive coefficient implying for positive relationship with conventional coffee farming. Our general understanding for farm manager’s experience could foster productivity was not statistically significant in both types of farming. Experienced farmer is not enough to reach a farm to attain higher level of efficiency unless farm managers rearrange the basket of inputs with a given technology. In analyzing efficiency affecting factors in organic coffee cultivation, it was observed that the total variance of output (expressed as variance of estimate) was higher in organic farming (1.476) than conventional farming (1.420).We did public auditing of factors responsible for organic coffee output in the study areas through alternative to face to face questionnaire survey. The participatory appraisal tool, focus group discussion was used to executive members of the farmers’ cooperatives/groups. The result obtained from massive interaction is depicted in table 9. Shortage of skill labor in organic and plant protection from insect/pest in conventional farming was the top most problem in the study areas. Availability of farm yard manure and insect/pest were second and third ranked problems in organic farming. But deficit of training and extension programme stood for second ranked followed by skill labor problem in conventional coffee farming. However, location specific problems ranking could be different. The overall assessment smoothly supported for our whole quantitative analysis. The facts of skill manpower development and management in emerging market oriented coffee production with wider progarmme to expanding livestock population to produce enough farm yard manure(FYM) is urgent issue to be addressed. The mitigation measures for insect pest prevailing are highly demanded in conventional farming.
The article summarizes the technical efficiency of organic and conventional coffee farming in hill region of Nepal. The study was conducted in Gulmi and Papla districts of Nepal representing organic and conventional area respectively. Both GM and non-discounted b/c ration was higher in conventional coffee farming system. Mean technical efficiency score was 0.89 and 0.83 in organic and conventional coffee farming respectively. Farms operating under CRS, DRS and IRS were 31.67, 3.83 and 37.5% respectively in organic coffee while farms operating under CRS, DRS and IRS were 29.17, 25 and 45.83% respectively in conventional coffee farming areas. Efficiency index were regressed to farm specific characteristics in tobit regression model produced all most non-significant results in both types of farming except the variable age of farm manager in conventional coffee farming. The coefficient of household size, farming experience and access to credit were positive in organic coffee but most of the factors have positive coefficient in conventional farming except for the factor sex. This concluded the research that in the sampled areas the technical efficiency were explained positively by household size to provide farm labor, farm experiences in input/output rationalization, credit for investment in both types farming. The positive coefficient for factors education and training could be implied that educated people are more likely to adopt technical knowhow on farming system management. The steady outflow of male people has been a threat in supplying skill labor and limited quantity of farm yard manure were the major problems to organic coffee farming. Protecting coffee from insects/pest and availability of technical know how is utmost in conventional farming.
Tables
Table 1. Variable definition and measurement.
Variables Unit Definitions
Farm size (X1j) Ropani*/farm Area of the organic coffee plot wherein input-output data was collected for farm j
Labor(X2j) Mandays/farm Total labor employed for coffee production for farm j Fertilizer(X3j)** Rs/farm† Cost incurred for organic fertilizer in coffee production
for farm j
Capital(X4j) Rs/farm Farm operating small equipment and irrigation devices etc used during coffee production for farm j
Output(Y1j) Kg/farm Quantity of green bean produced for farm j
Inter/shade crops(Y2j)# Rs/farm Market value of intercrops and shade crops’ in coffee farm for farm j
Coffee tree(X7j) Number/farm Total number of healthy coffee tree for farm j Household size(Z1j) No. of person Number of individual in a family for farm j
Education(Z2j) 1,0 1 if farm manger is educated, 0 otherwise for farm j Sex(Z3j) 1,0 1 if the coffee farm manager is male, 0 otherwise for
farm j
Training/Extension(Z4j) 1,0 1 if the coffee farm manager received training/extension services, 0 otherwise for farm j
Age(Z5j) Year Age of farm manager♣ for farm j
Farm experience (Z6j) Year Years of coffee cultivating experiences for farm j Access to farm
credit(Z7j)
1,0 1 if farmer access to farm loan, 0 otherwise for farm j Group/Coop.
member(Z8j)
1,0 1 if farmer is participated in group or producers cooperative, 0 otherwise for farm j
Labor cost (X5j) Rs/person-day Cost incurred for using labor in production management for farm j
Plant protection(X6j) Rs/farm Cost incurred for using botanical and some other low hazardous pesticides for farm j
*One Ropani= 511.14291 m2 and is a local unit for measuring area. **Farm Yard Manure (FYM), Green manure and Compost. #Production of annual short cycled vegetable crops/permanent perennial multipurpose tree species with relatively wider canopy. ♣Age of person who is responsible for managing the household/coffee business is called the farm manager. †As variables X3, X4 ,X5 and Y2 are expressed in value terms and measured in local currency unit. Rs, Rupees, a Nepalese currency and Rs1 = $US (1/74) in May 2010.
Table 2. Farm characteristics of organic and conventional coffee farms in Nepal.
Organic (n=120) Conventional (n=120) Factors
Mean SD Mean SD
Coffee planted area (Rop.) 3.15** 5.01 3.76** 2.12
Coffee tree (No/Farm) 141.17 205 159.03 91.20
Coffee output (Kg/Farm) 54.22* 83.21 88.70* 43.36
Labor Cost (Rs/Farm) 2444.17 2189.27 2580.00 1471.50
Fertilizer (Rs/Farm) 4738.42* 8264.72 1605.79* 741.69 Crop Protection(Rs/Farm) 287.85* 492.26 1229.35* 627.92
Marketing(Rs/Farm) 327.96* 487.25 2039.57* 1001.74
Total variable cost(Rs/Farm)++ 8086.25 11147.66 7973.65 3156.46 Gross revenue(Rs/Farm)♣ 12205.38* 16843.41 17498.96* 8918.29
Gross margin (Rs/Farm)† 4119.13* 10912.45 9525.31* 7171.77
Benefit-cost (Rs/Farm)†† 1.71* 0.80 2.25* 0.69
Farm Manager’s Age (Rs/Farm) 44.32 8.94 45.70 10.07
Farm experience (Years) 11.92 3.24 11.74 2.60
Family size (Number) 4.70 1.35 4.53 1.32
Education of farm manager (Literate. %) 92.50 88.33 Training/extension service (Receiver %) 79.16 55.00
Access to agri. credit 83.33 45
Group/Coop. member (Member %) 100 60.83
*and ** indicates means are significantly different in paired t-test at 5% and 10% test level respectively. ++Total outlays of fund for all productive variable factors of production (
). ♣Aggregation of income from the sales of farm outputs ( ). †Difference of GR and TVC excluding fixed cost ( ). ††Non-discounted ratio of
GR to TVC (
Source: Field survey 2010.
Table 3. Distribution of Technical Efficiency of organic coffee in deciles range.
Efficiency level Frequency Percentage
< 50 0 0 0.50-0.59 0 0 0.60-0.69 9 7.50 0.70-0.79 21 17.50 0.80-0.89 27 22.50 0.90-0.99 25 20.83 1 38 31.67 Mean TE 0.89 Standard deviation (sd) 0.11 Coefficient of variation (cv) 12.35
Minimum 0.62 Source: Field survey 2010.
Table 4. Summary of returns to scale results (n=120) in organic cultivation of coffee. Coffee output(kg/farm)
Characteristics No. farms
Mean Min Max
CRS 38(31.67 )* 69.86(122.16)** 1 600
DRS 37(30.83) 62.91(74.27) 5 305
IRS 45(37.5) 33.84(31.02) 5 160
*value in the parenthesis indicates percentage and ** value in the parenthesis indicates sd Source: Field survey 2010.
Table 5. Distribution of Technical Efficiency of conventional coffee in deciles range.
Efficiency level Frequency Percentage
< 50 6 5 0.50-0.59 8 6.67 0.60-0.69 15 12.50 0.70-0.79 15 12.50 0.80-0.89 22 18.33 0.90-0.99 19 15.83 1 35 29.17 Mean TE 0.83 Standard deviation(sd) 0.17 Coefficient of variation(cv) 20.48 Minimum 0.34 Source: Field survey 2010.
Table 6. Summary of returns to scale results (n=120) in conventional cultivation of coffee. Coffee output(kg/farm)
Characteristics No. farms
Mean Min Max
CRS 35( 29.17)* 101.91( 42.22)** 48 230
DRS 30 (25) 119.43(44.56 ) 66 235
IRS 55(45.83) 63.52(25.88 ) 22 140
*indicates percentage and ** indicates standard deviation. Source: Field survey 2010.
Table 7. Tobit regression analysis of organic coffee farms in Gulmi district
Independent variables Regression
coefficient Asymptotic Std. error T-ratio
Household size (Z1) 0.002 0.013 0.149 Education(Z2) -0.009 0.033 -0.229 Sex (Z3) -0.096 0.083 -0.951 Training/extension (Z4) -0.038 0.426 -0.074 Age (Z5) -0.212 0.274 -0.638 Farm experience (Z6) 0.193 0.357 0.446
Access to farm credit (Z7) 1.161 3.173 0.301
Constant -1.171 3.192 -1.171
Variance of the estimate ( ) 1.4766
Standard error of the estimate ( 1.2152
Log likelihood function -102.688
Square correlation between observed and
expected values 0.15548
***- Significant at 0.01, **- Significant at 0.05 and *- Significant at 0.1 Source: Field survey 2010.
Table 8. Tobit regression analysis conventional coffee farms in Palpa district.
Independent variables Regression
coefficient Asymptotic Std. error T-ratio
Household size (Z1) 0.013 0.011 0.958 Education(Z2) 0.049 0.047 0.874 Sex (Z3) -0.112 0.086 -1.099 Training/extension (Z4) 0.111 0.278 0.334 Age (Z5) 0.675 0.215 2.633*** Farm experience (Z6) 0.260 0.365 0.598
Access to farm credit (Z7) 0.002 0.347 0.006
Constant -1.864 0.811 -1.928*
Variance of the estimate ( ) 1.4204
Standard error of the estimate ( 1.1918
Log likelihood function -95.986
Square correlation between observed and
expected values 0.0303
***- Significant at 0.01, **- Significant at 0.05 and *- Significant at 0.1 Source: Field survey 2010.
Table 9. Frequency distribution of field level problems of organic and conventional coffee farming.
Organic coffee farms Conventional coffee farms Field level problem
Frequency Rank Frequency Rank
Skill labor 102(85) I 82(68.33) III
Farm yard manure 86(71.67) II 62(51.67) VI
Insect/pests 82(68.33) III 108(90 ) I
Operating utensils 69(57.50) IV 66( 55) IV
Irrigation 29(24.17) VI 64( 53.33) V
Training/Extension 51(42.50) V 92( 76.67) II
Wild animals 0 24(20 ) VIII
Water for processing 23( 19.16) VII 32( 26.66) VII Value in the parenthesis indicates percentage.
Source: Field survey 2010.
Reference
Aigner, D. J., Lovell, C. K., and Schmidt, P. 1977. Formulation and estimation of stochastic frontier production function models. Journal of Econometrics. 6 (1), 21–37.
Ali, M. and Flinn, J. C., 1989. Profit efficiency among Basmati rice producers in Pakistan Punjab. American Journal of Agricultural Economics. 71, 303-310.
Annual Report, 2010 . District Cooperative Federation, Gulmi, Tamghas, Nepal.
APP, 1995. Agriculture Perspective Plan. APROSC and JMA Inc. National Planning Secretariat, Singh Durbar. Nepal.
Bajracharya, P., (2003). Business Plan for HCPC Limited, AEC/FNCCI. Katmandu.Nepal.
Banker, R. D., Charnes, A., and Cooper, W. W. 1984. Models for the estimation of technical and scale inefficiencies in DEA. Management Science. 30, 1078-1092.
Battese, G. E. and Coelli, T., 1995. A model for technical inefficiency effects in a stochastic frontier production function for panel data. Empirical Economics. 20, 325–332.
Battese, G. E., Malik, S. J. and Gill, M. A., 1996. An investigation of technical inefficiencies of production of wheat farmers in four districts of Pakistan. Journal of Agricultural Economics. 47 37-49.
Beets, W. C., 1982. Multiple Cropping and Tropical Farmings Systems. Baulder Colorado U.S.A., West View Press Inc.
Belbase, K., Grabowski, R., 1985. Technical efficiency in Nepalese agriculture. Journal of Development Areas 19 (4), 515–525.
Beringer C., 1956. Estimating enterprise production functions from input-output data on multiple enterprise farms. University of Idaho. Journal of Farm Economics. 38, 1201-1205.
Bhandari P., Karl E. Weber, H. Demaine, and S. H. Upasena, 1998. Marketing Channels and the Role of Market Functionaries in Grain Marketing. The Economic Journal of Nepa. 20(4), 186-189.
Bhattachary, P. and G. Chakraborty. 2005. Current Status of Organic Farming in India and other Countries. Indian Journal of Fertilizers. 1(9): 111-123
Bhujel, R. B. and Surya P. Ghimire, 2006. Estimation of Production Function of Hiunde (Boro) Rice. Nepal Agric. Res. Journal. 7, 88-97
Binam, J. N., J. Tonyè, N. wandji, G. Nyambi and M. Akoa., 2004. Factors affecting the technical efficiency among smallholder farmers in the slash and burn agricultural zone of Cameroon. Food Policy. 29(5), 531-545
Bravo-Ureta B. E. and Reiger L., 1991. Dairy Farm Efficiency measurement using Stochastic Frontier and Neoclassical duality. American Journal of Agricultural Economics. 73, 421-428.
Bravo-Ureta, B. E. and Pinheiro, A.E., 1993. Efficiency analysis of developing country agriculture: a review of the frontier function literature. Agricultural and Resource Economics Review. 22 (1), 88–101.
Bravo-Ureta, B.E. and Pinheiro, A.E., 1997. Technical, economic and allocative efficiency in peasant farming: evidence from the Dominican republic. The Developing Economics. XXXV (1), 48–67. Chambers, G. R., 1980 Applied Production Analysis. 5th Edition. Cambridge University Press, UK. Charnes, A., Cooper W., Lewin, A.Y. and Seiford, L.M., 1994. Data Enveleopment Analysis: Theory,
Methodology and Application, Kulwer Academic Publishers, Boston.
Chavas, J. P. and M. Aliber., 1993. An Analysis of Economic Efficiency in Agriculture: A Nonparametric Approach. Journal of Agricultural and Resource Economics. 18(1), 1-16.
Coelli, T. J. and G. E. Battese., 1996. Identification of factors which influence the technical inefficiency of Indian farmers. Australian Journal of Agricultural Economics. 40, 103-128.
Coelli. T. J., D. S. P. Rao., C. J. O’Donnel and G. E. Battese., 2005. An Introduction to Efficiency and Productivity Analysis. Second Edition. Springer.
Colman, D. and T. Young., 1995. Principle of Agricultural Economics: Markets and Prices in less developed countries. Cambridge University Press, Great Britain. 51-65.
Dhungana B. R., Peter L. Nuthal and G.V. Nartea., 2004. Measuring the economic efficiency of Nepalese rice farms using data envelopment analysis. The Australian Journal of Agricultural and Resource Economics. 48(2), 347-369.
Dhungana B., Y. Sugimoto., N. Yamamoto and H. kano., 2010.Technical Efficiency Analysis of Vegetable Farms in the Mid-hill Region of Nepal-An Approach Using Data Envelopment Analysis. Japanese Journal of Food, Agricultural and Resource Economics. 60(2), 27-37.
FAOSTAT/WORLD BANK (2006).Country report: Nepal, prepared by ESSGA. Available at www.fao.org/es/ess/compendium_2006/pdf/NEP_ESS_E.pdf
Färe, R. and C. A. K. Lovell., 1978. Measuring the Technical Efficiency of Production. Journal of Economic Theory. 19, 150-162.
Färe, R., S. S. Grosskorf., and C. A. K. Lovell., 1994. Production Frontiers. Cambridge University Press, Cambridge.
Färe, R., S. S. Grosskorf., and C.A. K. Lovell., 1985. The Measurement of Efficiency of Production. Boston: Kluwer-Nijhoff.
Farrell, M.J., 1957. The Measurement of Productive Efficiency. Journal of the Royal Statistical Society 120(3), 253-290.
Featherstone, A. M., M. R. Langemeier., and M. Ismet., 1997. A Nonparametric Analysis of Efficiency for a Sample of Kansas Beef Cow Farm. Journal of Agricultural and Applied Economics. 29(1), 175-184
Greer, G., William Kaye-Blake, Eva Zellman and Chris Parsonson-Ensor.2008.Comparision of the financial performance of organic and conventional farms. Journal of Organic System. 3 (2):18-28.
Hallam, D. and Machado, F., 1996. Efficiency analysis with panel data: a study of Portuguese dairy farms. European Review of Agricultural Economics. 12, 79-93.
Heady E. O., 1951. A production function and marginal rate of substitution in the utilization of feed resources by dairy cows. Iowa State University. Journal of Farm Economics. 33, 485-498.
Idiong, I. C., 2007. Estimation of Farm Level Technical Efficiency in Small Scale Swamp Rice Production in Cross River Site of Nigeria: A Stochastic Frontier Approach. World Journal of Agricultural Sciences. 3(5), 653-658.
Inoni, O. E. and P. C. Ike., 2006. Determinants of Yam Production and Economiv Efficiency Among Small-Holder Farmers in Southern Nigeria. Journal of Central European Agriculture. 7(2), 337-342).
Kalirajan, K. P., 1991. The importance of efficient use in the adoption of technology: a macro panel data analysis. Journal of Production Analysis. 2, 113-126.
Kebede, T. A. 2001. Farm Household Technical Efficiency: A Stochastic Frontier Analysis: A Study of Rice Producer in Mardi Watershed in the Western Development Region of Nepal. Master Thesis. Department of Economics and Social Sciences. Agricultural University of Norway. pp 56
Koutsoyiannis, A., 1979. Modern Micro Economics. 2nd Edition. Macmillan Press Limited. Lotter, D.W.2003. `Organic Agriculture`. Journal of Sustainable Agriculture. 21(4):59-128
Mader, P. Fließbach, A., Dubois, D., Gunst, L., Fried, P., and Niggli, U. 2002. `Soil fertility and biodiversity in organic farming`. Science. 296 (5573): 1694-1697
Mesike C. S., O. E. D. Owie and R. N. Okoh., 2009. Resource-Use Efficiency and Return to Scale in Smallholders Rubber Farming System in Edo State, Nigeria. Journal of Human Ecology. 28(3), 183-186
Minh, N. K. and J. T. Long., 2009. Efficiency Estimates for the Agricultural Production in Vietnam: A comparison of Parametric and Non-parametric Approach. Agricultural Economics Review. 10(2), 62-78
MOAC. 2009. Ministry of Agriculture and Cooperatives. Statistical Information on Nepalese Agriculture, Singhdurbar, Nepal.
Morris, C., Hopkins. A. and Winter, M. 2001. `Comparision of the Social, Economic and Environmental Effects of Organic, ICM and Conventional Farming’. Gloucestershire, United Kingdom: CCRU Cheltenham and Gloucester College of HE.
Nepal, A., 2006. Soil nutrient analysis of organic coffee farm in Gulmi district. Journal of Himalayan College of Agricultural Sciences and Technology, Green Field. 4(1), 104-105
NTCDB., 2009. Nepal Tea and Coffee Development Board (NTCDB). Available at . http://www.teacoffee.gov.np/nepal.html
Pacini, C., Wossink, A., Giesen, G., Vazzana, C. and Huirne, R. 2002. `Evaluation of Sustainability of Organic, Integrated and Conventional Farming System: a Farm and Field-scale Analysis`. Agriculture, Ecosystem and Environment. 95(1).In: Greer, G., William Kaye-Blake, Eva Zellman and Chris Parsonson-Ensor.2008.Comparision of the financial performance of organic and conventional farms. Journal of Organic System.3(2): 18-28
Parikh, A., Ali, F. and Shah, M. K., 1995. Measurement of economic efficiency in Pakistani Agriculture. American Journal of Agricultural Economics. 77, 675-685.
Ray, S. C., 2004. Data Envelopment Analysis: Theory and Techniques for Economics and Operations Research. New York: Cambridge University Press.
Ruthenberg, H., 1980. Farming System in the Tropics. Oxford: Oxford University Press.
Seyoum, E. T., Battese, G.E., and Flemming, E. M., 1998. Technical efficiency and productivity of maize producers in eastern Ethiopia: A study of farmers within and outside the Sasakawa-Global 2000 project. Agricultural Economics. 19, 341-348.
Shapiro, K. H. and Muller, J., 1983. Sources of technical efficiency: the roles of modernization and information. Economic Development and Cultural Change. 25, 293–310.
Sharma, K. R., Leung, P., and Zalleski, H. M., 1999. Technical, allocative, and economic efficiencies in swine production in Hawaii: a comparison of parametric and non-parametric approaches. Agricultural Economics. 20, 23–35.
Squires, D. and Tabor, S., 1991. Technical efficiency and future production gains in Indonesia agriculture. The Developing Economics. 29, 258–270.
Stefanou, S. E. and Saxena, S., 1998. Education, experience and allocative efficiency: a dual approach. Americal Journal of Agricultural Economics. 70, 338-345.
TEPC, 2009. Trade and Export Promotion Center. Nepal Overseas Trade Statistics. Kathmandu Nepal. Tzouvelekas, V., Pantzios, C. J., and Fotopoulos, C., 2001. Technical efficiency of alternative farming
systems: the case of Greek organic and conventional olive-growing farms. Food Policy. 26, 549– 569.
Umoh, G. S., 2006. Resource Use Efficiency in Urban Farming: An Application of Stochastic Frontier Production Function. International Journal of agriculture and Biology. 8(1), 38-44.
Varian, H. R., 1984. The Nonparametric approach to production analysis. Econometrica. 52(3), 579-59. Wadud, A. and White, B., 2000. Farm household efficiency in Bangladesh: a comparison stochastic
frontier and DEA methods. Applied Economics. 32, 1665–1673.
Wang, J., Cramer, G. L., and Wailes, E. J., 1996. A shadow price frontier measurement of profit efficiency in Chinese agriculture. American Journal of Agricultural Economics. 78, 46-156. Xu, X. and Jeffrey, S.R., 1998. Efficiency and technical progress in traditional and modern agriculture:
evidence from rice production in China. Agricultural Economics. 18, 157-165.
Yussefi M. and Willer H. 2002. Organic Agriculture World Wide 2002, Statistics and Future Prospects. Stiftung Okologie and Landbau. Bad Durkheim, Germany.