Northumbria Research Link
Citation: Hammad, Mohamed, Iliyasu, Abdullah M., Subasi, Abdulhamit, Ho, Edmond and El-Latif, Ahmed A Abd (2020) A Multi-tier Deep Learning Model for Arrhythmia Detection. IEEE Transactions on Instrumentation and Measurement. ISSN 0018-9456 (In Press)
Published by: IEEE URL:
This version was downloaded from Northumbria Research Link:
http://nrl.northumbria.ac.uk/id/eprint/44509/
Northumbria University has developed Northumbria Research Link (NRL) to enable users to access the University’s research output. Copyright © and moral rights for items on NRL are retained by the individual author(s) and/or other copyright owners. Single copies of full items can be reproduced, displayed or performed, and given to third parties in any format or medium for personal research or study, educational, or not-for-profit purposes without prior permission or charge, provided the authors, title and full bibliographic details are given, as well as a hyperlink and/or URL to the original metadata page. The content must not be changed in any way. Full items must not be sold commercially in any format or medium without formal permission of the copyright holder. The full policy is available online: http://nrl.northumbria.ac.uk/pol i cies.html
This document may differ from the final, published version of the research and has been made available online in accordance with publisher policies. To read and/or cite from the published version of the research, please visit the publisher’s website (a subscription may be required.)
Abstract— Electrocardiograph (ECG) is employed as a primary tool for diagnosing cardiovascular diseases (CVD) in the hospital, which often helps in the early detection of such ailments. ECG signals provide a framework to probe the underlying properties and enhance the initial diagnosis obtained via traditional tools and patient-doctor dialogues. It provides cardiologists with inferences regarding more serious cases. Notwithstanding its proven utility, deciphering large datasets to determine appropriate information remains a challenge in ECG-based CVD diagnosis and treatment. Our study presents a deep neural network (DNN) strategy to ameliorate the aforementioned difficulties. Our strategy consists of a learning stage where classification accuracy is improved via a robust feature extraction. This is followed using a genetic algorithm (GA) process to aggregate the best combination of feature extraction and classification. The MIT-BIH Arrhythmia was employed in the validation to identify five arrhythmia categories based on the association for the advancement of medical instrumentation (AAMI) standard. The performance of the proposed technique alongside state-of-the-art in the area shows an increase of 0.94 and 0.953 in terms of average accuracy and F1 score, respectively. The proposed model could serve as an analytic module to alert users and/or medical experts when anomalies are detected in the acquired ECG data in a smart healthcare framework.
Index Terms— AAMI standard, Arrhythmia Detection, Cardiovascular Diseases, Deep Neural Network, E-healthcare devices, Electrocardiogram (ECG), Genetic Algorithm.
I. INTRODUCTION
CCORDING to the World Health Organization (WHO), as of 2016, cardiovascular diseases (CVDs) are the main cause of deaths globally [1]. An estimated 17.9 million succumbed to CVD-related ailments, representing 31% of all deaths worldwide in the same year. Two-thirds of these deaths Mohamed Hammad is with Faculty of Computers and Information, Menoufia University, Menoufia, Egypt (e-mail: [email protected]).
Abdullah M Iliyasu is with Electrical Engineering Department, College of Engineering, Prince Sattam Bin Abdulaziz University, Al-Kharj 11942, Saudi Arabia and with School of Computing, Tokyo Institute of Technology, Yokohama 226-8502, Japan. Also, he with School of Computer Science and Technology, Changchun University of Science and Technology, Changchun 130022, China (e-mail:[email protected]; [email protected]) Abdulhamit Subasi is with College of Engineering, Effat University, Jeddah, Saudi Arabia (e-mail: [email protected]).
Edmond S. L. Ho with the Department of Computer and Information Sciences, Northumbria University, Newcastle upon Tyne, United Kingdom (e-mail: [email protected])
Ahmed A. Abd El-Latif is with the Mathematics and Computer Science Department, Faculty of Science, Menoufia University, Shebin El-Koom 32511, Egypt, and is with School of Information Technology and Computer Science, Nile University, Egypt (e-mail: [email protected]; [email protected]).
occurred in low-income countries [1] where medical facilities for early detection and supports for patients of CVD is deemed generally poor. Whereas the most CVD cases can be prevented by behavioral and lifestyle changes, early detection of such cases presents the next best approach to accurate diagnosis, effective treatment, and management of CVDs.
Arrhythmia (irregular heartbeat or cardiac dysrhythmia), as an example, is an issue when a human’s heart pacemaker does not work properly, or its functions are impaired by ectopic focuses [2]. There are several diagnostic methods available to detect CVDs. Electrocardiography (ECG) is the most well-known and widely applied method for the detection of various heart diseases [3]. ECG is an affirmed method for the detection of acute coronary syndromes, intra-ventricular conduction disturbances, and arrhythmias [4]. ECG detects and records both the heart rate and rhythm by detecting the electrical activity produced within the cardiac muscles during contraction of the cardiac cycle; it can also be utilized for the ECG telemonitoring in a smart healthcare framework [5], [6].
ECG Lead refers to an imaginary line between two ECG electrodes [7]. The standard ECG has 12 leads, six leads are placed on the arms and/or legs of the individual and called limb leads, while the other leads are placed on the torso and called precordial leads. The limb leads are called I, II, III, aVL, aVR and aVF and the precordial leads are called V1, V2, V3, V4, V5 and V6. Fig. 1 shows all leads on an ECG signal.
Fig. 1. ECG leads [8]
Overall, ECG has valuable potential to reveal hidden disease features. However, the manual analysis of the long-term ECG signals is a tiresome task even for an expert. Hence, developing a Computer-Aided Cardiac Diagnosis (CACD) system helps clinicians as a second opinion in diagnosis [9]. CACD systems are appropriate tools for the decline the diagnostic errors in the clinical domain [10].
Several CACD systems based on Machine Learning (ML)
Lim b L ea ds Pr ec or dia l L ea ds
Mohamed Hammad, Abdullah M Iliyasu, Abdulhamit Subasi, Edmond S. L. Ho, and Ahmed A. Abd
El-Latif
A Multi-tier Deep Learning Model for
Arrhythmia Detection
strategies have been developed to support different stages of CVD diagnosis and treatment. Most classical ML methods are based on the extraction of features from different signal types, typically ECG, which are subsequently processed using different algorithms such as random forest [11], support vector machines [12], etc. Similarly, employing convolutional neural networks (CNN), unsupervised features extraction mechanisms have been used in the classification of signals. While effective in its use to classify such signals, little has been invested in understanding the intrigues in CNN’s automated classification of the extracted features.
The advances on available computational tools and algorithms have revealed their use in automated early detection and diagnosis of cardiac abnormalities on the rise. Recently, focus on ECG rhythm (ECGr) classification has similarly been on the increase. ECGr classification can be grouped into areas that focus on finding effective extraction methods, [13,14] improving classification outcomes, [15-19] and utilization of deep learning methods to enhance the performance of classification [20-29].
Akhmani et al. [16] presented a method based on Gaussian mixture modeling (GMM) with enhanced expectation maximization (EM) for arrhythmia detection. They obtained an accuracy of 99.7% for arrhythmia classification. In [17], Hammad et al. reported the use of a classifier based on characteristics of ECG signals to detect abnormal heart conditions. As reported therein, their strategy yielded an average classification accuracy of 99%. Tuncer et al. [19], presented an automated method for arrhythmia detection using hexadecimal local pattern (HLP) and discrete wavelet transform (DWT). For classification, they used 1 nearest neighborhood (1NN) classifier and obtained an accuracy of 99.7%.
However, all these ML methods [15-19] reported good performances, when faced with a big data of ECG records their results might be less effective. This is attributed to the inherent shortcoming attributed to training ML models on limited or small data sets. Among others, these limitations include:
• The focus of the majority of these papers on designing a method for preprocessing of ECG signals, feature extraction, feature selection and classification, as in [15-19]. In this paper, only DNN model optimized by genetic algorithm (GA) is proposed.
• The majority of these works used small datasets, hence the result not robust as in [17,18,19]. In addition, several methods obtained low accuracy on big data, which is not suitable for real applications as in [16,17,19]. The proposed method achieved good accuracy on small and big data.
• Most of these methods worked on multiple lead ECG recordings, which make these methods more complex as in [16,18]. In this paper, we only worked on one lead ECG.
• Confining classification to either one rhythm or two rhythms as in [15,17].
To overcome the previous ML problems, researchers used deep learning approaches. Recently, deep learning is widely used in many fields [30-32], especially in medical fields [33-35]. For arrhythmia detection, several methods are presented [20-29]. However, these methods have many limitations that have overcome by using this paper.
This study contributes towards the automated detection of CVD ailments based on ECG signals. Specifically, a deep learning model suffused with other ML and optimization techniques is presented for efficient detection of five types of arrhythmia based on the association for the advancement of medical instrumentation (AAMI) standard using the most standard ECG classification dataset available the MIT-BIH Arrhythmia [36]. The main novel contributions of this paper are summarized as follows:
1. Design of an optimized DNN model for feature learning to distinguish different cardiac rhythms using a single lead ECG.
2. Integrating LSTM-based features with a K-nearest neighbor (K-NN) classifier to improve the classification efficacy.
3. Design of a new DNN method based on the cross-validation coupled with genetic algorithm for optimization of features and parameters.
4. The proposed method has achieved successful results. These results are proved that the success of the proposed method.
To the best our knowledge,the proposed solution (ResNet-LSTM +GA) is applied for arrhythmia detection for first time which has never been used before.
The remainder of the study is as follows. The proposed method within smart healthcare platform is discussed in the next Section. The details of the proposed techniques as well as datasets employed throughout its execution and validation are discussed in Section III. The presentation of the performance analysis and discussion of outcomes in Section IV. Section V concludes this paper.
II. PROPOSED FRAMEWORK WITHIN SMART HEALTHCARE PLATFORM
One of the motivations of the proposed DNN model is to improve the classification performance in the existing e-health framework. In this section, we will first review the related research and some of the existing framework in the literature. We will then discuss the challenges in the existing framework and how our proposed DNN model can be integrated into those frameworks to improve the performance.
Smart wearable devices, such as smart bands and
smartwatches, have become more affordable in recent years. Most of these devices can capture wide-ranging health-related information from the user’s everyday life. For example, Tada et al. [37] proposed to have six electrodes attached to the chest on a smart shirt to obtain ECG data. Using similar wearable sensors for measuring health-related data such as ECG, heart rate (HR), sweat rate and respiratory activity, numerous technologies and devices have been proposed and/or
produced, such as Proe-TEX [38], BIOTEX [39] and AMON [40]. Most of the wearable sensors are equipped with wireless communication modules (e.g. Bluetooth [41]) which facilitate capturing, recording and analyzing health information using mobile devices, such as smartphones [42]. The health information can also be shared with the medical doctors and experts for further analysis [42]. A comprehensive review of smart wearable health monitoring systems with wireless communications can be found in [43]. While the aforementioned approaches provide us with the infrastructure of the smart health sensing framework, lightweight and efficient algorithms for detecting ECG abnormalities are needed to process the huge amount of data captured from these wearable sensors and their analysis on the mobile devices using minimal computational resources. The proposed
ECG anomaly detection framework is primarily targeted at such integration in smart e-healthcare platforms. Our envisioned application for the framework in the proposed study is illustrated in Fig. 1. We particularly note the integration of the ECG anomaly detection framework as the core analytic module that processes data captured via wearable sensors and alerts users and/or medical experts when anomalies are detected in the acquired ECG data. Meanwhile,
the technical details of the proposed framework are discussed in the next Section.
Fig. 1. Overview of proposed model within a smart e-health framework.
III. PROPOSED METHODOLOGY
The proposed technique fuses the adaptability and flexibility in input-output relationships of deep neural networks (DNN) models with the “learnability” of classical ML methods as well as repeatability inherent to the mutation, crossover and other properties of GA and other optimization
techniques to realize a prodigious yet efficient strategy for arrhythmia detection.
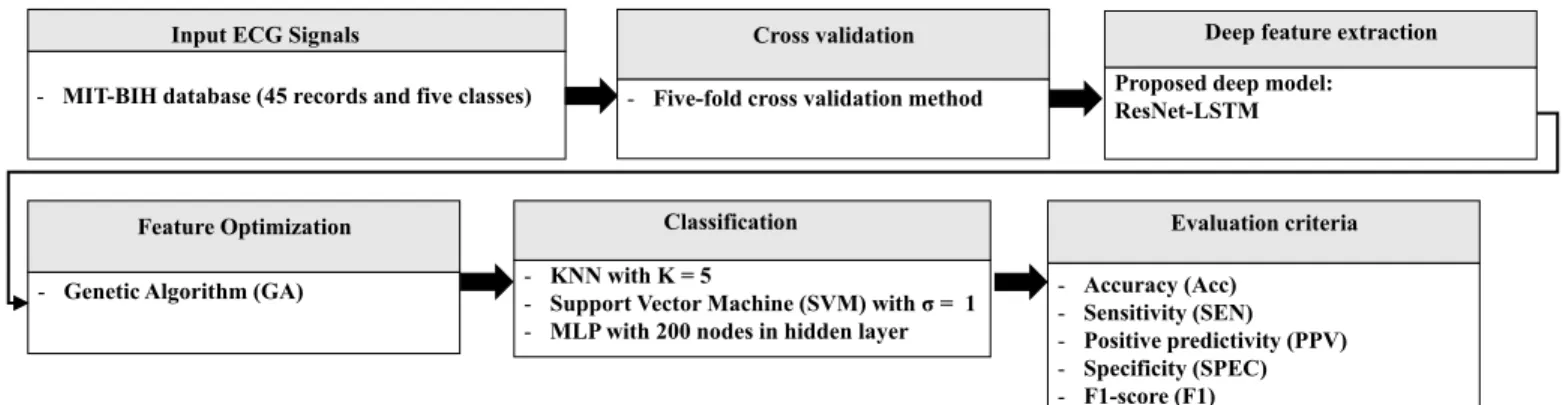
Execution of the proposed strategy entails feeding the ECG signal into the DNN model where deep features of each patient are extracted. Next, these features are fed into a genetic algorithm that determines their optimum combination. Following that several classifiers, K-NN, support vector machine (SVM), multilayer perception (MLP) are utilized to classify the features following which final CVD detection is realized. Fig. 2 presents the general outline of the proposed technique as explained. The remainder of this Section presents details of the three tiers: deep learning, genetic algorithm, and traditional machine learning that make up the proposed technique.
A. Proposed deep learning model (DLM)
DNN is a class of artificial neural networks ingrained with mathematical manipulation to turn an input state into an output via unit-wise calculation of the probability of each output [44]. Each mathematical manipulation is considered a layer of the neural network and so, in the case of complex architectures, the network requires a deep layer of computations; hence, the name DNN.
In ECG signal processing, DNNs have proven useful learning features from raw signals. This has been used to circumvent many shortcomings encountered in non-machine (i.e. human) feature extraction and eventual diagnosis, which are less accurate and slow.
As the features for ECG classification are usually manifested in the morphology of the ECG waveforms, algorithms for feature extraction should be crafted to characterize ECG waveforms by a set of parameters. The convolution operation in a CNN model has been proven effective in the extraction of the features from 1D or 2D data manifesting good robustness to noise [45]. The residual convolutional neural network (ResNet), which is an improved version of CNN, augment a known drawback regarding the problem of degradation associated with DNNs by adding shortcut links between its layers. Therefore, a ResNet which makes it viable for extraction from the raw ECG waveforms.
Fig. 2. Outline of proposed multi-tier deep learning model (DLM) However, an ECG recording to diagnose could extend to tens
of seconds in duration as a result, morphological features of ECG recordings can be very complex and hard to characterize. Moreover, an average segment of ECG recording is considered enough to make a diagnosis since parts of it are
either irrelevant or redundant. Consequently, it is neither effective nor expedient to rely solely on ResNet. In view of this, the proposed DLM utilizes ResNet for local feature extraction from the raw ECG signals while using other network components, such as long short-term memory
Deep feature extraction Proposed deep model:
ResNet-LSTM Feature Optimization
- Genetic Algorithm (GA)
Classification
- KNN with K = 5
- Support Vector Machine (SVM) withσ= 1
- MLP with 200 nodes in hidden layer
Evaluation criteria - Accuracy (Acc) - Sensitivity (SEN) - Positive predictivity (PPV) - Specificity (SPEC) - F1-score (F1) Input ECG Signals
- MIT-BIH database (45 records and five classes)
Cross validation
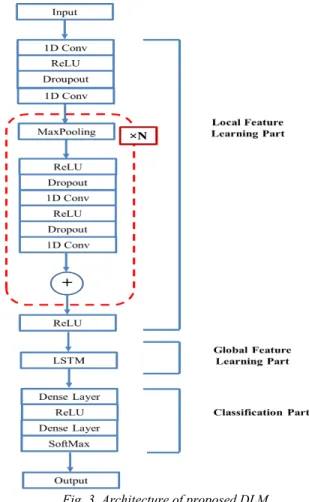
(LSTM) layer. To summarize the local feature series, the proposed DLM ResNet-LSTM network whose main function is to extract ECG features. Structurally, this DLM consists of three parts: namely, the local features learning, global features learning and the classification units. Fig. 3 presents the detailed structure of the proposed ResNet-LSTM deep learning model and details of its three units are presented in the sequel.
1. Local feature learning (LFL) unit
This part of the proposed DLM is focused on the raw ECG signals. A local feature vector manifests the morphological information of a short period in an ECG recording. The resulting feature map is composed of a sequence of local features ordered by time. As discussed earlier, in this study, the LFL unit is implemented using ResNet. It consists of a few initial layers while its main body is made up of repeating substructures. As presented in Fig. 3 each substructure consists of one max-pooling layer whose size is present at 2 and a residual module. The length of the feature map will be split through each of the substructures whose number depends in part on the input length such that a longer input requires more pooling layers to compress the feature map to a certain length. Each residual module contains two convolutional layers and preceding each of them is two layers: a rectified linear unit (ReLU) activation layer and a dropout layer. Through a shortcut connection, the input of a residual module is merged by combining it with the output of its second convolutional layer. As required by the merge operation, and to ensure equal input and output length, feature maps are padded before input into each convolutional layer. The kernel size of the first convolutional layer in the network is set at 32, and through every 4 substructures, the kernel size is reduced by half. The LFL unit terminates with a ReLU activation layer where the feature maps are fed as input to the global features learning part.
Fig. 3. Architecture of proposed DLM 2. Global feature learning (GFL) unit
The global features learning (GFL) unit transforms the feature map from the preceding LFL unit into a global vector that is subsequently used in the classification unit. The LSTM, which is a kind of recurrent neural network (RNN), is used to characterize the properties of our global vector that emanates the output from the final layer of the LSTM. This vector’s length is determined by the hidden units in LSTM layers
preset at 64 in our settings at which stage the test samples achieved the minimum classification error using this number.
3. Classification unit
The classification process is the final step of the proposed
DLM whence classification process is done based on the global feature vector extracted from preceding units. Classification is accomplished using two fully connected (i.e. dense) layers that are each followed by a ReLU activation layer and a SoftMax activation layer respectively. In the case of multi-class classification, the number of cells in the last dense layer is the same as the number of classes. However, in the two-class classification, the last dense layer usually has just one cell. The outputs of the last layer are the predicted probabilities showing the class each ECG recording belongs
to. Although traditional DNN models can make predictions in an end-to-end fashion, to improve classification performance, an optimization layer is integrated to the proposed DLM, whose details are discussed in the next section.
B. GA-based optimization tier
A high dimensional feature set perturbs classification accuracy while imposing temporal constraints on available resources. A
wide range of approaches as such as GA [46], principal component analysis (PCA) [47] and particle swarm optimization (PSO) [48] are employed to mitigate these encumbrances. In this study, a GA is infused into the DLM discussed earlier. The objective of doing this is to minimize the number of features and classification errors associated with the variability of signal characteristics and random permutation of the signals [49].
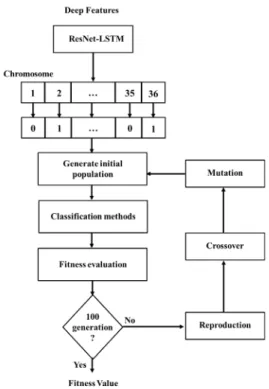
Moreover, recently GA has been found very adaptive and efficient for feature selection [50]. Typically, GA has four steps and its used as the optimization tier of the proposed technique is outlined in the following steps.
• Initialize a population consists of N chromosomes where the length of each chromosome is L.
• Select optimum features from the feature space comprising of 36 different features, which can be defined as the initial population in the GA optimization procedure. From the feature space, the features that have higher fitness values will be eliminated, and consequently the features with lower fitness values will be selected.
• In each generation, select two parents and using the classifiers to categorize the feature combination of each of these parents separately.
• Calculate the fitness value of each classification and terminate the optimization when the generation passes the 100th iteration.
• Send the selected parents to the crossover stage and continue the optimization until the generation meets the defined number of iterations. A default crossover probability of 0.8 used to choose the parents with lower fitness values to generate the next population: Table I presents the default parameter settings for the proposed
GA-based optimization procedure.
Table I. Choice of best parameters for GA-based optimization
GA parameter Value
Fitness Function Accuracy or F1-score Generations Numbers 100
Crossover Arithmetic Crossover Crossover Probability 0.8
Mutation Uniform Mutation Mutation Probability 0.1
Selection scheme Tournament of size 2
EliteCount 2
Fig. 4 presents the flowchart outlining steps of the GA optimization used in our study.
C. Classification tier of proposed model
In this study, classification is realized using several classifiers such as K-NN, SVM and MLP. These classifiers were implemented and evaluated to choose a suitable classifier for our model as outlined in the remainder of this subsection.
1. K-NN classifier
It is one of the algorithms of machine learning within the supervised learning group, which is one of the simplest algorithms due to its ease of use and consumption for a little time. The K-NN algorithm performs the test point classification based on the surrounding training points, i.e. the neighbors closest to the test point (hence this algorithm is called neighbors nearest). When the distance of some of these neighboring points of the test point is closer than the rest of
the points, the test point will be considered as belonging to the category of those points. The K-NN is sensitive to errors during the training sequence [51]. In this paper, the K-NN classifier is employed with K = 5.
Fig. 4. Flowchart for execution of proposed GA 2. SVM classifier
It is a supervised learning algorithm that can be employed for regression and classification problems by finding a hyperplane that splits the features into diverse domains [52]. SVM called Support Vector Classification (SVC) when employed for classification problems and called Support Vector Regression (SVR) when employed for regression problems. There are two main types of SVM, namely, Linear SVM (L-SVM) for two-class problems and Non- Linear SVM (N-SVM) for multi-class problems. This study is built on the N-SVM, where the classification is accomplished via a kernel function to map the data into a different space with a hyper-plane. A Kernel function can be chosen from the different types available, such as linear, polynomial and radial basis function (RBF). However, the choice is guided by the kind of classification problem. In this, due to the nature of databases used, RBF kernel, where the number of observations is larger than the number of features is chosen. Formally, the RBF (Gaussian) kernel is defined as follows [53]:
𝐾𝐾(𝑥𝑥,𝑥𝑥𝑖𝑖) = exp�−‖𝑥𝑥−𝑥𝑥𝑖𝑖‖2
2𝜎𝜎2 � (1) where: 𝜎𝜎is a real value standard variance of Gaussian distribution and each xi∈Rp is a p-dimensional real vector. In this study, a default value of σ =1 is used.
3. MLP classifier
It is a class of feed-forward artificial neural networks that consists of, three layers, the input layer, a hidden layer and an output layer. Except for the input nodes, each node is a neuron that uses a nonlinear activation function (e.g. sigmoid
function). In this paper, MLP classifier with one hidden layer, five output nodes for arrhythmia detection, is used. Layers in the network are completely connected to each other and trained in a way that each input vector results in an output vector with one non-zero element corresponding to the estimated class label. For training, Levenberg-Marquardt back-propagation algorithm [54] is used. The learning procedure is continued either until 30 validation failures are obtained or when the maximum number of iterations (100 epochs) is reached.
IV. EXPERIMENTS AND VALIDATION
In this paper, a five-fold cross-validation method [55] is employed, and the performance of the system was evaluated in each fold. The average result of all the five folds was calculated as the final performance of the system.
The validation of the performance of the proposed DLM was assessed in three steps. First, the impact of using five-fold cross-validation on an end-to-end model was evaluated. Second, the role of proposed GA-based optimization on the classification is evaluated. Finally, outcomes of the
classification were compared alongside standard techniques in the area of automated detection of cardiac abnormalities, which is an important step in CVD diagnosis and treatment.
A. MIT-BIH Arrhythmia Dataset
The MIT-BIH database [36] contains 48 records obtained from 47 subjects of which 47% were female and 53% were male. The age range of the participants was between 23 and 89 years. Each subject is represented by one ECG recording using two leads: lead II (MLII) and lead V1. The sampling frequency of the signal is 360 Hz. The upper signal is lead II (MLII) and the lower signal is lead V1, obtained by placing the electrodes on the chest. In the upper signal, the normal QRS complexes are usually prominent. In some cases, there are surgical dressings on the patients as in records 102 and 104; so, it was not possible to use lead II, in this case, lead V5 was used.
According to the AAMI, the MIT-BIH database grouped into 5 five arrhythmia groups namely: normal (N), supraventricular ectopic (S), ventricular ectopic (V), fusion (F), and unknown (Q) as shown in Table II. There are some previous methods
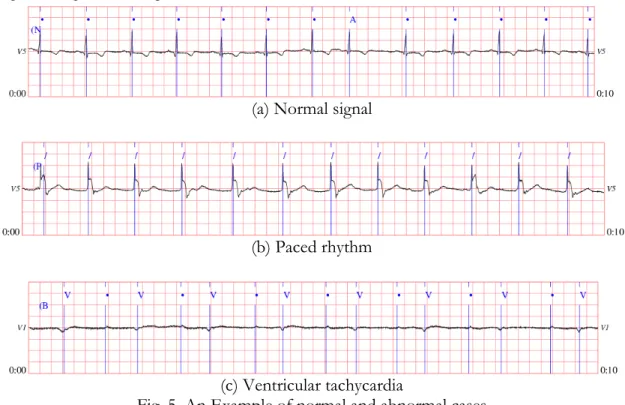
that utilize the AAMI standards, but the variety uses an intra-patient paradigm, which divided the data into train and test based only on the beat label. Fig. 5 shows an example of three records (e.g. normal and other abnormal cases) from the MIT-BIH database.
(a) Normal signal
(b) Paced rhythm
(c) Ventricular tachycardia
Fig. 5. An Example of normal and abnormal cases
Table II. A summary table of ECG beats presented in the MIT-BIH database according to ANSI/AAMI EC57: 2012 standard classes
N S V F Q
Normal (74722 beats) Atrial premature (2544 beats) Premature ventricular Contraction (7122 beats)
Fusion of ventricular and
normal (802 beats) Paced (3616 beats) Right bundle branch block
Left bundle branch block (8069 beats)
Supraventricular
Premature (2 beats) Unclassifiable (15 beats)
Atrial escape (16 beats) Nodal (junctional) escape (229
beats) Nodal (junctional) premature (83 beats) B. Performance Metrics
The classification results were evaluated using standard metrics including the Accuracy (Acc) sensitivity (SEN), positive predictivity (PPV) and specificity (SPE). These parameters are defined in the equation matrix in Table III.
Table III. Equation matrix for performance metrics Positive Predictivity (PPV) �� 𝑇𝑇𝑇𝑇 𝑇𝑇𝑇𝑇+𝐹𝐹𝑇𝑇 𝑁𝑁 𝑖𝑖 �/𝑁𝑁 Sensitivity (SEN) ��𝑇𝑇𝑇𝑇𝑇𝑇𝑇𝑇+𝐹𝐹𝑁𝑁 𝑁𝑁 𝑖𝑖 �/𝑁𝑁 Specificity (SPE) ��𝑇𝑇𝑁𝑁𝑇𝑇𝑁𝑁+𝐹𝐹𝑇𝑇 𝑁𝑁 𝑖𝑖 �/𝑁𝑁 Accuracy (Acc) ��𝑇𝑇𝑇𝑇+𝑇𝑇𝑁𝑁𝑇𝑇𝑇𝑇++𝑇𝑇𝑁𝑁𝐹𝐹𝑇𝑇+𝐹𝐹𝑁𝑁 𝑁𝑁 𝑖𝑖 �/𝑁𝑁 In addition, F1-score [56] is used to evaluate the classification:
𝐹𝐹1− 𝑠𝑠𝑠𝑠𝑠𝑠𝑠𝑠𝑠𝑠= 𝑀𝑀 ��1 �∑ 2𝑇𝑇𝑇𝑇 2𝑇𝑇𝑇𝑇+𝐹𝐹𝑁𝑁+𝐹𝐹𝑇𝑇 𝑁𝑁 𝑖𝑖 � 𝑁𝑁 𝑀𝑀 𝑖𝑖 � (2) where N and M represent the number of sets applied in the five-fold and the number of classes, respectively. TP and TN are true positives and true negatives, FP and FN are false positives and false negatives.
C. Preprocessing and implementation details
Since ECG recordings in the selected dataset are disproportionate in length, we start by converting them to the same length by padding or truncating for the convenience of DNN training. However, the padding method can increase the computing complexity of the model. While the truncation method can damage the recording integrity. In view of this, over 90% of records in the selected database are no longer than 30 seconds, as a trade-off between the computing efficiency and recording integrity, 30 seconds are chosen as the target length. Moreover, a zero-padding value was used because it is the baseline value of the ECG signals. The padding was positioned at the head of a recording because LSTM is more sensitive to values in the recording tail. Meanwhile, for the truncation, the model uses the same method that truncates a segment randomly from the original signal. We have also applied other fixed recording length (such as 10 and 20 seconds), however, it proves that 30 seconds is the optimal choice.
The randomness involved in the padding/truncation methods, augment and balance the dataset during this process. However, considering the additional memory requirements imposed by the augmentation, the data augmentation and balancing are done in batches. Each for model training batch is generated by randomly selecting a certain number of recordings from each class and then padding or truncating these records respectively. For example, the batch size in our setting is 63 and a class numbers, thus, a batch contains 7 recordings from each class. The randomness in the padding
(except that for the ResNet-LSTM) and truncation ensures that no (except that for the ResNet-LSTM) no two training samples are the same. Further, no additional memory is required for the augmented recordings because they are generated just prior to preparing for a batch and discarded immediately after processing of the batch.
As stated before, the recordings are padded or truncated to 30 seconds, which adds up to 15000 sampling points. The local features learning of the proposed ResNet-LSTM has 7 residual substructures. As each substructure has a max-pooling layer with a pool size of 2, the resulting output length of the local features learning part is set at 117. Since a recording may have more than one label, then our task is a multi-label classification problem. Consequently, as outlined in Section III SoftMax is used as the final activation function which generates the predicted probability for each class independently.
The models are implemented on the Keras framework with Tensorflow as the backend. The hardware environment is a workstation equipped with an Intel Core i7-6800K CPU, a Nvidia GTX 1080ti GPU and 16 GB memory. The training time of each batch for ResNet-LSTM is 307ms.
D. Results and performance analysis
In this Section, the results of the proposed model
experiments are presented, and the performance of the proposed model is discussed DLM in terms of five-fold cross-validation and its impact as an end-to-end model on the MIT-BIH database. In this paper, three experiments were done: in the first experiment, the proposed end-to-end model is employed without using any ML stages, and the performance of the model is evaluated. In the second experiment, the proposed deep model is used for feature extraction and an external classifier is employed for classification and the performance of the model is evaluated. In the last experiment, a comparison of the proposed models (end-to-end and with external classifier) was done with the state-of-the-art approaches.
The classification of arrhythmias using the MIT-BIH database is also in the beat-level, with five categories according to the AAMI EC57 [57] classifications: N, S, V, F and Q. Each beat contains 300 sampling points: 100 before and 200 after the R peak (Fs = 360Hz). The lead II data is used
for the classification, so the channel number for the input is 1. Four residual substructures in the DLM (i.e. ResNet-LSTM) model produce a local feature map of length 18. Since this is a multi-class and single-label classification problem, SoftMax is used as the final activation function. Furthermore, both intra- and inter-patient models are trained for this problem. For the training of intra-patient models, the beats from all recordings are first shuffled and divided into 5 parts for the cross-validation. Whereas the training of intra-patient models, the beats from 22 recordings are used for training and another 22 recordings are used for validation, as specified in database the
AAMI standard. However, since the beat numbers of classes F and Q are small, only the other three classes (N, S and V) are involved in the inter-patient classifications. The results of the intra- and inter-patient models are presented in Table IV and Table V, respectively.
From Tables IV and V, we can deduce that GA-optimized the features of the proposed DLM better than other methods.
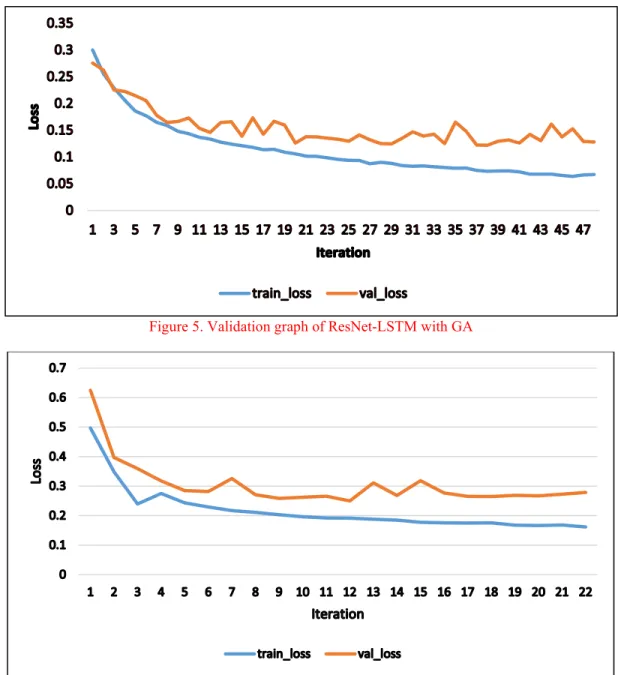
Also, we can conclude that K-NN is better suited for GA optimization since it produced better accuracy relative to other classifiers. Figures 5 and 6 show validation graphs for the proposed model using K-NN with and without using GA-based optimization (which is the best case with GA), respectively.
Table IV. Comparison of Intra-Patients classification performance of using MIT database
Method score F1- Acc SEN PPV N SPE SEN PPV S SPE SEN PPV V SPE SEN PPV F SPE SEN PPV Q SPE End-to-End 0.884 0.977 0.980 0.996 0.965 0.926 0.787 0.992 0.958 0.892 0.991 0.902 0.695 0.997 0.2 0.088 0.999 SVM with GA 0.888 0.978 0.984 0.994 0.953 0.900 0.791 0.992 0.951 0.918 0.993 0.888 0.711 0.997 0.333 0.250 0.999 KNN with GA 0.897 0.980 0.984 0.995 0.963 0.931 0.789 0.992 0.957 0.917 0.993 0.892 0.761 0.998 0.267 0.274 0.999 MLP with GA 0.894 0.973 0.996 0.971 0.929 0.811 0.993 0.977 0.962 0.853 0.986 0.918 0.706 0.996 0.333 0.062 0.999 SVM without GA 0.755 0.830 0.818 0.985 0.634 0.919 0.758 0.945 0.903 0.871 0.922 0.847 0.871 0.983 0.333 0.250 0.999 KNN without GA 0.814 0.859 0.899 0.958 0.934 0.741 0.794 0.876 0.972 0.887 0.991 0.925 0.658 0.935 0.267 0.274 0.999 MLP without GA 0.630 0.781 0.711 0.941 0.932 0.648 0.957 0.868 0.924 0.868 0.704 0.957 0.560 0.737 0.333 0.062 0.999
Table V. Comparison of Inter-Patients classification performance of using MIT database
Method score F1- Acc SEN PPV N SPE SEN PPV S SPE SEN PPV V SPE End-to-End 0.609 0.779 0.780 0.977 0.845 0.705 0.537 0.975 0.810 0.226 0.807 SVM with GA 0.562 0.781 0.785 0.980 0.867 0.727 0.447 0.963 0.770 0.229 0.819 KNN with GA 0.884 0.872 0.813 0.970 0.872 0.802 0.960 0.931 0.822 0.965 0.941 MLP with GA 0.735 0.821 0.832 0.711 0.672 0.717 0.583 0.922 0.782 0.813 0.864 SVM without GA 0.546 0.589 0.528 0.957 0.605 0.246 0.436 0.897 0.664 0.212 0.597 KNN without GA 0.805 0.815 0.719 0.946 0.865 0.711 0.921 0.932 0.796 0.918 0.868 MLP without GA 0.675 0.751 0.650 0.675 0.868 0.636 0.556 0.749 0.721 0.813 0.881
Figure 5. Validation graph of ResNet-LSTM with GA
Figure 6. Validation graph of ResNet-LSTM without GA
E. Comparison with the state-of-the-arts
In this Section, the performance of the proposed techniques is evaluated alongside longstanding methods in the area. For a level playing ground, outcomes with the best performance are used for the assessment. In our case, this is the DLM suffused with K-NN and GA-based optimization.
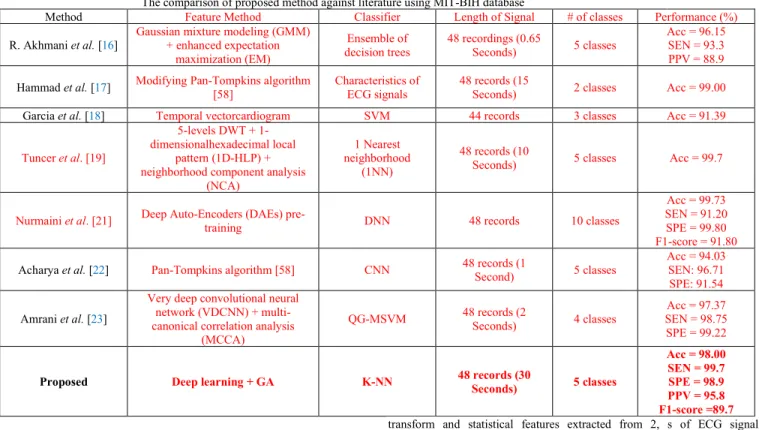
From the results in Table VI, it can be concluded that the
proposed method matches or betters the other methods in terms of robustness for the dataset reported. As noted in our motivation for embarking on this study, while there are a good number of the machine or deep learning approaches for detecting heart disorders (such as arrhythmia) most of them are encumbered by the computational overhead associated with the complex frameworks utilized in their detection models [15,16,18,19,20,21,22,23]. Many of these frameworks are slow [20,21,22,23] while others are overburdened by memory-related constraints [15,16,17,18]. Furthermore, most
of the developed models to detect only one type of signal. Unlike the previous studies, a multi-tier DLM capable of detecting more than one type of signal is proposed. We have demonstrated its use in detecting heart disorders such as arrhythmia.
The intuition to suffuse GA-based optimization into the
proposed DLM ensures that (the best) lower features are extracted from the ECG signals of more than one lead, despite the use of the lead II ECG signals. This suggests that the
proposed method is less complex than other competing techniques. The proposed model requires four hours for training with a computational complexity (defined in terms of the decision time for each recording) of 10ms.
Finally, as presented in this Section, for the datasets employed, the proposed technique outperforms similar ones in terms of classification accuracy, which is an important precursor for arrhythmia detection and subsequent diagnosis.
Table VI
The comparison of proposed method against literature using MIT-BIH database
Method Feature Method Classifier Length of Signal # of classes Performance (%) R. Akhmani et al. [16] Gaussian mixture modeling (GMM) + enhanced expectation
maximization (EM)
Ensemble of
decision trees 48 recordings (0.65 Seconds) 5 classes
Acc = 96.15 SEN = 93.3 PPV = 88.9 Hammad et al. [17] Modifying Pan-Tompkins algorithm [58] Characteristics of ECG signals 48 records (15 Seconds) 2 classes Acc = 99.00 Garcia et al. [18] Temporal vectorcardiogram SVM 44 records 3 classes Acc = 91.39 Tuncer et al. [19]
5-levels DWT + 1-dimensionalhexadecimal local
pattern (1D-HLP) + neighborhood component analysis
(NCA)
1 Nearest neighborhood
(1NN)
48 records (10
Seconds) 5 classes Acc = 99.7
Nurmaini et al. [21] Deep Auto-Encoders (DAEs) pre-training DNN 48 records 10 classes
Acc = 99.73 SEN = 91.20 SPE = 99.80 F1-score = 91.80 Acharya et al. [22] Pan-Tompkins algorithm [58] CNN 48 records (1 Second) 5 classes Acc = 94.03 SEN: 96.71
SPE: 91.54 Amrani et al. [23]
Very deep convolutional neural network (VDCNN) + multi-canonical correlation analysis
(MCCA)
QG-MSVM 48 records (2 Seconds) 4 classes SEN = 98.75 Acc = 97.37 SPE = 99.22
Proposed Deep learning + GA K-NN 48 records (30 Seconds) 5 classes
Acc = 98.00 SEN = 99.7 SPE = 98.9 PPV = 95.8 F1-score =89.7 V. CONCLUSION
Efficient and accurate classification of ECG signals is the
first important step in the detection and diagnosis of many CVD ailments. This study presents a multi-tier DLM suffused with ML and GA-based optimization for effective discrimination of cardiac abnormalities in the ECG signal. The
proposed techniques fuse the adaptability and flexibility in input-output relationships of DNN models with the “learnability” of classical ML methods as well as repeatability inherent to the mutation, crossover and other properties of GA and other optimization techniques to realize a prodigious yet efficient strategy for early detection of different CVD ailments. These properties ensure that the proposed approach alleviates many of the shortcomings that encumber traditional approaches. Outcomes show that the proposed model matches and betters many of the competing approaches in either or both the datasets used. Moreover, with average accuracy values of 98%, the proposed technique is efficient in arrhythmia detection on the MIT-BIH dataset. Furthermore,
the performance was reported in terms of specificity (98.9) sensitivity (99.7) and positive predictivity (95.8) for the five-fold cross-validation. The metrics validate the potentials for incorporating the proposed model in state-of-the-art applications for CVD detection as well as its subsequent diagnosis, treatment and management. In the future, we will try to use biLSTM, which is more powerful than LSTM layer.
REFERENCES
[1] Sudarshan, V. K. Acharya, U. R., Oh, S. L., et al. (2017). Automated diagnosis of congestive heart failure using dual tree complex wavelet
transform and statistical features extracted from 2, s of ECG signals. Computers in Biology and Medicine, 83(Complete), 48-58.
[2] N. Singh and P. Singh, “Cardiac arrhythmia classification using machine learning techniques,” in Lecture Notes in Electrical Engineering, vol. 478, Springer Verlag, 2019, pp. 469–480.
[3] M. Liu and Y. Kim, “Classification of Heart Diseases Based on ECG Signals Using Long Short-Term Memory,” in Proceedings of the Annual International Conference of the IEEE Engineering in Medicine and Biology Society, EMBS, 2018, vol. 2018-July, pp. 2707–2710.
[4] P. Kligfield et al., “Recommendations for the standardization and interpretation of the electrocardiogram: Part I: The electrocardiogram and its technology: A scientific statement from the American Heart Association Electrocardiography and Arrhythmias Committee, Council on Clinical Cardiology; the American College of Cardiology Foundation; and the Heart Rhythm Society,” Circulation, vol. 115, no. 10. pp. 1306–1324, Mar-2007. [5] C. Y. Chou, E. J. Chang, H. T. Li, and A. Y. Wu, “Low-Complexity Privacy-Preserving Compressive Analysis Using Subspace-Based Dictionary for ECG Telemonitoring System,” IEEE Trans. Biomed. Circuits Syst., vol. 12, no. 4, pp. 801–811, Aug. 2018.
[6] C. Wen, M. F. Yeh, K. C. Chang, and R. G. Lee, “Real-time ECG telemonitoring system design with mobile phone platform,” Meas. J. Int. Meas. Confed., vol. 41, no. 4, pp. 463–470, May 2008.
[7] Lewis Potter, Understanding an ECG. March 5,2011. https://geekymedics.com/understanding-an-ecg/. Accessed [13-07-2020]. [8] Hsu, C. C., Lin, B. S., He, K. Y., & Lin, B. S. (2019). Design of a wearable 12-lead noncontact electrocardiogram monitoring system. Sensors, 19(7), 1509.
[9] R. M. Rangayyan, Biomedical signal analysis, vol. 33. John Wiley & Sons, 2015.
[10] N. Khosravan, H. Celik, B. Turkbey, E. C. Jones, B. Wood, and U. Bagci, “A collaborative computer aided diagnosis (C-CAD) system with eye-tracking, sparse attentional model, and deep learning,” Med. Image Anal., vol. 51, pp. 101–115, Jan. 2019.
[11] L. Breiman, “Random forests,” Mach. Learn., vol. 45, no. 1, pp. 5–32, 2001.
[12] Y. Freund and R. E. Schapire, “Experiments with a new boosting algorithm,” in icml, 1996, vol. 96, pp. 148–156.
[13] Hammad, M., Zhang, S., and Wang, K. (2019). A novel two-dimensional ECG feature extraction and classification algorithm based on convolution neural network for human authentication. Future Generation Computer Systems.
[14] Hammad, M., Ibrahim, M., and Hadhoud, M. (2016). A novel biometric based on ECG signals and images for human authentication. Int. Arab J. Inf. Technol., 13(6A), 959-964.
[15] Sadhukhan, D., Pal, S., and Mitra, M. (2018). Automated identification of myocardial infarction using harmonic phase distribution pattern of ECG data. IEEE Transactions on Instrumentation and Measurement, 67(10), 2303-2313. [16] Afkhami, R. G., Azarnia, G., and Tinati, M. A. (2016). Cardiac arrhythmia classification using statistical and mixture modeling features of ECG signals. Pattern Recognition Letters, 70, 45-51.
[17] Hammad, M., Maher, A., Wang, K., Jiang, F., and Amrani, M. (2018). Detection of abnormal heart conditions based on characteristics of ECG signals. Measurement, 125, 634-644.
[18] Garcia, G., Moreira, G., Luz, E., and Menotti, D. (July 2016). Improving automatic cardiac arrhythmia classification: Joining temporal-vcg, complex networks and svm classifier. In 2016 International Joint Conference on Neural Networks (IJCNN) (pp. 3896-3900). IEEE.
[19] Tuncer, T., Dogan, S., Pławiak, P., & Acharya, U. R. (2019). Automated
arrhythmia detection using novel hexadecimal local pattern and multilevel wavelet transform with ECG signals. Knowledge-Based Systems, 186, 104923.
[20] Zhang, J., Chen, X., Liu, A., Chen, X., Zhang, X., & Gao, M. (2020). ECG-based Multi-Class Arrhythmia Detection Using Spatio-Temporal Attention-based Convolutional Recurrent Neural Network. Artificial Intelligence in Medicine, 101856.
[21] Nurmaini, S., Umi Partan, R., Caesarendra, W., Dewi, T., Naufal Rahmatullah, M., Darmawahyuni, A., ... & Firdaus, F. (2019). An automated ECG beat classification system using deep neural networks with an unsupervised feature extraction technique. Applied Sciences, 9(14), 2921. [22] Acharya, U. R., Oh, S. L., Hagiwara, Y., Tan, J. H., Adam, M., Gertych, A., and San Tan, R. (2017). A deep convolutional neural network model to classify heartbeats. Computers in biology and medicine, 89, 389-396. [23] Amrani, M., Hammad, M., Jiang, F., Wang, K., and Amrani, A. (2018). Very deep feature extraction and fusion for arrhythmias detection. Neural Computing and Applications, 30(7), 2047-2057.
[24] Oh, S. L., Ng, E. Y., San Tan, R., and Acharya, U. R. (2018). Automated diagnosis of arrhythmia using combination of CNN and LSTM techniques with variable length heart beats. Computers in biology and medicine, 102, 278-287.
[25] Shi, H., Qin, C., Xiao, D., Zhao, L., & Liu, C. (2020). Automated heartbeat classification based on deep neural network with multiple input layers. Knowledge-Based Systems, 188, 105036.
[26]Wang, D., Meng, Q., Chen, D., Zhang, H., & Xu, L. (2020). Automatic Detection of Arrhythmia Based on Multi-Resolution Representation of ECG Signal. Sensors, 20(6), 1579.
[27] Li, Z., Zhou, D., Wan, L., Li, J., & Mou, W. (2020). Heartbeat classification using deep residual convolutional neural network from 2-lead electrocardiogram. Journal of Electrocardiology, 58, 105-112.
[28] Chen, C., Hua, Z., Zhang, R., Liu, G., & Wen, W. (2020). Automated arrhythmia classification based on a combination network of CNN and LSTM. Biomedical Signal Processing and Control, 57, 101819.
[29] Atal, D. K., & Singh, M. (2020). Arrhythmia Classification with ECG signals based on the Optimization-Enabled Deep Convolutional Neural Network. Computer Methods and Programs in Biomedicine, 105607.
[30] Hammad, M., Liu, Y., & Wang, K. (2018). Multimodal biometric authentication systems using convolution neural network based on different level fusion of ECG and fingerprint. IEEE Access, 7, 26527-26542.
[31] Hammad, M., & Wang, K. (2019). Parallel score fusion of ECG and fingerprint for human authentication based on convolution neural network. Computers & Security, 81, 107-122.
[32] M Jomaa, R., Mathkour, H., Bazi, Y., & Islam, M. S. (2020). End-to-End Deep Learning Fusion of Fingerprint and Electrocardiogram Signals for Presentation Attack Detection. Sensors, 20(7), 2085.
[33] Sedik, A.; Iliyasu, A.M.; Abd El-Rahiem, B.; Abdel Samea, M.E.; Abdel-Raheem, A.; Hammad, M.; Peng, J.; Abd El-Samie, F.E.; El-Latif, A.A.A. (2020). Deploying Machine and Deep Learning Models for Efficient Data Augmented Detection of COVID-19 Infections. Viruses 2020, 12(7), 769.
[34] Alghamdi, A., Hammad, M., Ugail, H., Abdel-Raheem, A., Muhammad, K., Khalifa, H. S., & Abd El-Latif, A. A. (2020). Detection of myocardial infarction based on novel deep transfer learning methods for urban healthcare in smart cities. Multimedia Tools and Applications, 1-22.
[35] Acharya, U. R., Fujita, H., Oh, S. L., Hagiwara, Y., Tan, J. H., and Adam, M. (2017). Application of deep convolutional neural network for automated detection of myocardial infarction using ECG signals. Information Sciences, 415, 190-198.
[36] Goldberger AL, Amaral LA, Glass L, et al. Physiobank, physiotoolkit, and physionet: components of a new research resource for complex physiologic signals. Circulation. 2000; 101(23): E215.
[37] Y. Tada, Y. Amano, T. Sato, S. Saito, and M. Inoue, “A smart shirt made with conductive ink and conductive foam for the measurement of electrocardiogram signals with unipolar precordial leads,” Fibers, vol. 3, no. 4, pp. 463–477, Nov. 2015.
[38] D. Curone et al., “Smart garments for emergency operators: The ProeTEX project,” IEEE Trans. Inf. Technol. Biomed., vol. 14, no. 3, pp. 694–701, May 2010.
[39] S. Coyle et al., “BIOTEX—Biosensing textiles for personalised healthcare management,” IEEE Trans. Inf. Technol. Biomed., vol. 14, no. 2, pp. 364–370, Mar. 2010.
[40] U. Anliker et al., “AMON: A wearable multiparameter medical monitoring and alert system,” IEEE Trans. Inf. Technol. Biomed., vol. 8, no. 4, pp. 415–427, Dec. 2004
[41] P. L. Penmatsa and D. V. R. K. Reddy, "Smart Detection and Transmission of Abnormalities in ECG via Bluetooth," 2016 IEEE International Conference on Smart Cloud (SmartCloud), New York, NY, 2016, pp. 41-44.
[42] K. Tong, K. Leung and Y. Leung, "A system for personalized health care with ECG and EEG signals for analysis," 2017 International Smart Cities Conference (ISC2), Wuxi, 2017, pp. 1-6.
[43] T. Liang and Y. J. Yuan, "Wearable Medical Monitoring Systems Based on Wireless Networks: A Review," in IEEE Sensors Journal, vol. 16, no. 23, pp. 8186-8199, Dec.1, 2016.
[44] Hannun, A. Y., Rajpurkar, P., Haghpanahi, M., Tison, G. H., Bourn, C., Turakhia, M. P., & Ng, A. Y. (2019). Cardiologist-level arrhythmia detection and classification in ambulatory electrocardiograms using a deep neural network. Nature medicine, 25(1), 65.
[45] Kiranyaz, S., Avci, O., Abdeljaber, O., Ince, T., Gabbouj, M., and Inman, D. J. (2019). 1D Convolutional Neural Networks and Applications: A Survey. arXiv preprint arXiv:1905.03554.
[46] Whitley, D. (1994). A genetic algorithm tutorial. Statistics and computing, 4(2), 65-85.
[47] Ringnér, M. (2008). What is principal component analysis? Nature biotechnology, 26(3), 303.
[48] Rini, D. P., Shamsuddin, S. M., Yuhaniz, S. S. (2011). Particle swarm optimization: technique, system and challenges. International journal of computer applications, 14(1), 19-26.
[49] Pławiak, P., & Acharya, U. R. (2019). Novel deep genetic ensemble of
classifiers for arrhythmia detection using ECG signals. Neural Computing and Applications, 1-25.
[50] Huang, C. L., & Wang, C. J. (2006). A GA-based feature selection and parameters optimization for support vector machines. Expert Systems with applications, 31(2), 231-240.
[51] Berkaya, S. K., Uysal, A. K., Gunal, E. S., Ergin, S., Gunal, S., and Gulmezoglu, M. B. (2018). A survey on ECG analysis. Biomedical Signal Processing and Control, 43, 216-235.
[52] Hammad, M., Pławiak, P., Wang, K., & Acharya, U. R. (2020). ResNet‐ Attention model for human authentication using ECG signals. Expert Systems, e12547.
[53] Hammad, M., and Wang, K. (2017, April). Fingerprint classification based on a Q-Gaussian multiclass support vector machine. In Proceedings of the 2017 International Conference on Biometrics Engineering and Application (pp. 39-44). ACM.
[54] Hagan, M. T., & Menhaj, M. B. (1994). Training feedforward networks with the Marquardt algorithm. IEEE transactions on Neural Networks, 5(6), 989-993.
[55] Duda RO, Hart PE, Stork DG. Pattern Classification 2nd Edition. Pattern classification. New York, John Wiley and Sons, 2001:55-88.
[56] Liu F, Liu C, Zhao L, et al. An open access database for evaluating the algorithms of electrocardiogram rhythm and morphology abnormality detection. J Med Imaging Health Inform 2018;8(7):1368-1373.
[57] Association for the Advancement of Medical Instrumentation. (2013). ANSI/AAMI EC57: 2012—Testing and Reporting Performance Results of Cardiac Rhythm and ST Segment Measurement Algorithms. American National Standard.
[58] Pan, J., & Tompkins, W. J. (1985). A real-time QRS detection algorithm. IEEE transactions on biomedical engineering, (3), 230-236.
![Fig. 1. ECG leads [8]](https://thumb-us.123doks.com/thumbv2/123dok_us/9957043.2488251/3.918.487.852.709.949/fig-ecg-leads.webp)