Estimating the Impact of Microcredit
on Those Who Take It Up:
Evidence from a Randomized Experiment in Morocco
†By Bruno Crépon, Florencia Devoto, Esther Duflo, and William Parienté *
We report results from a randomized evaluation of a microcredit pro-gram introduced in rural areas of Morocco in 2006. Thirteen per-cent of the households in treatment villages took a loan, and none in control villages did. Among households identified as more likely to borrow, microcredit access led to a significant rise in investment in assets used for self-employment activities, and an increase in profit, but also to a reduction in income from casual labor. Overall there was no gain in income or consumption. We find suggestive evidence that these results are mainly driven by effects on borrowers, rather than by externalities. (JEL D14, G21, J23, O12, O16, O18)
S
everal recent randomized evaluations in different countries and contexts have found that granting communities access to microcredit has positive impacts on investment in self-employed activities, but no significant impact on overall con-sumption—or on overall income, when that is measured (Attanasio et al. 2011; Augsburg et al. 2013; Banerjee et al. 2013; Angelucci, Karlan, and Zinman 2013; Desai, Johnson, and Tarozzi 2013). A plausible interpretation of these findings is that the small businesses that the households gaining access to microcredit invest in have low marginal product of capital. Consistent with this hypothesis, these studies often find no significant impact of microcredit access on business profits or income from self-employment activities on average, although several do find an impact on profits for preexisting businesses or for businesses at the top end of the* Crépon: CREST, 15 Bd G. Peri 92245 Malakoff Cedex, France, and J-PAL (email:[email protected]); Devoto: Paris School of Economics, 48 Boulevard Jourdan, 75014 Paris, France (e-mail: [email protected]); Duflo: Massachusetts Institute of Technology, Department of Economics, 50 Memorial Drive, Cambridge, MA 02142, NBER, and J-PAL (e-mail: [email protected]); Parienté: IRES, Université Catholique de Louvain, Place Montesquieu 3, B-1348 Louvain-la-Neuve, Belgium, and J-PAL (e-mail: [email protected]).Funding for this study was provided by the Agence Française de Développement (AFD), the International Growth Centre (IGC), and the Abdul Latif Jameel Poverty Action Lab (J-PAL). We thank, without implicating, these three insti-tutions for their support. The draft was not reviewed by the AFD, IGC, or J-PAL before submission and only rep-resents the views of the authors. The study received IRB approval from MIT, COUHES 0603001706. This paper is registered in AEA Social Science Registry under number AEARCTR-0000371 We thank Abhijit Banerjee and Ben Olken for comments. We thank Aurélie Ouss, Diva Dhar, and Stefanie Stantcheva for tremendous research assistance, and seminar and conference participants for very useful comments. We also thank Team Maroc for their efforts in conducting the surveys and the French National Institute of Statistics (INSEE) for their precious help with data entry. We are deeply indebted to the whole team of Al Amana without whom this evaluation would not have been possible, in particular, to Fouad Abdelmoumni, Zakia Lalaoui and Fatim-Zahra Zaim.
† Go to http://dx.doi.org/10.1257/app.20130535 to visit the article page for additional materials and author
distribution of profits (Angelucci, Karlan, and Zinman 2013; Banerjee et al. 2013). Since the marginal business funded by a microfinance loan is often more likely to be female-operated, this interpretation (that the impact of microcredit on overall profits is low because it mainly funds unprofitable businesses) is also consistent with the cash-drop literature that finds that while the marginal productivity of capital appears to be large for male-run small businesses, it is much lower for those run by women (de Mel, McKenzie, and Woodruff 2008).
One remaining question about this interpretation, however, is that while the impact on average self-employment profit is statistically insignificant in all existing studies, the point estimates are generally positive. Moreover, in most studies, the dif-ferential take-up of microcredit between treatment and control groups is generally low, either because interest in microcredit in treatment areas is low or because there is also some take-up in the control group (due either to leakage or entry of compet-itors into the control area). This implies that the insignificantly positive point esti-mates would translate into large (though still insignificant, obviously) instrumental estimates of the impact of microcredit (as opposed to microcredit access) on the average business profit. Could it be that the effect on those who take up microcredit is actually large, although perhaps imprecisely estimated?
The studies where microcredit access is randomized at the area level, however, generally focus on reporting reduced-form estimates and do not use area-level access as an instrument for microcredit. There are good reasons to believe that microcre-dit availability impacts not only on clients, but also on nonclients through a variety of channels: equilibrium effects via changes in wages or in competition, impacts on behavior of the mere possibility to borrow in the future, etc. Thus, the exclusion restriction—that the instrument only affects the outcome through its impact on micro-credit borrowing—is likely to be violated, and studies that randomize at the area level (rightly) avoid using area-level microcredit access as an instrument. On the other hand, in order to maximize power in the face of low demand, most of these studies use as the study sample a convenience sample, which surveys people who are eligible and likely to borrow based on observables (for example, demographic characteristics or prior expression of interest). The results are thus reduced-form estimates on a specific population. Furthermore, (with the exception of Desai, Johnson, and Tarozzi 2013) identification comes from increased microcredit access in treatment areas (rather than no access versus some access), and we are thus not capturing the effect driven by those who want microcredit the most (who may borrow both in control and treatment areas). In this paper, we present results from a randomized evaluation of microcredit in rural areas of Morocco. The study has three features that make it a good comple-ment to existing papers. First, it takes place in an area where there is absolutely no other microcredit penetration, before or after the introduction of the product, and for the duration of the study. We are thus capturing the impact on the most interested households in villages (although those are still marginal villages for our partner, since they were chosen to be at the periphery of their planned zones of operation). Second, we designed and implemented a sampling strategy that would give us suf-ficient power to estimate the impact on borrowers, and also to capture impacts rep-resentative at the village level. Finally, we propose a strategy to test for externalities on nonborrowers, and to estimate direct effect on borrowers.
Existing strategies to estimate spillovers, which use two-step randomization (e.g. Crépon et al. 2013) are not feasible for this question, first because excluding a sub-set of potential clients once an office is open would be difficult, and second because part of the potential impact of microcredit on nonparticipants would only affect those eligible to be clients. We thus propose a simple strategy, based on the different probabilities to borrow found by the households that were surveyed, and build this strategy explicitly into the sample design.
The evaluation was implemented in 162 villages, divided into 81 pairs of similar villages. The pairs were chosen at the periphery of the zone where Al Amana, our partner microfinance institution (MFI), was planning to start their operations. We ran-domly selected one village in each pair, and Al Amana started working in that village only. In a pilot phase, we collected extensive data on a sample of 1,300 house holds in 7 pairs of villages (7 treatment, 7 control), before introduction of microcredit. Several months after the program was introduced in the pilot villages, we estimated a model of credit demand in those villages and selected a small number of variables that were correlated with higher take-up. For all the remaining villages, before Al Amana started their operation, we conducted a short survey (which included the variables correlated to higher take-up) on 100 randomly selected households. We then calculated for each household a propensity score to borrow based on our model. We interviewed at baseline and endline (two years after rollout) all the households in the top quartile of the score (in treatment and control group), plus five households randomly selected from the rest of the village. In addition, at endline, we added a third group that had an even higher propensity to borrow, by reestimating the take-up equation in the whole sample, and using the initial census (available for all house-holds) to construct a new score. In total, our sample includes 4,465 households at baseline, 92 percent of which were successfully interviewed at endline (an unusually low attrition rate), and 1,433 new households that were added at endline.
Our sample thus has three categories of households classified ex ante in terms of their probability to borrow. We take advantage of the heterogeneity in the propensity to borrow in our sample to test the existence of potential externalities from borrow-ers to nonborrowborrow-ers. We evaluate the effect of the treatment on households who have a high propensity to borrow and those who have a low probability to borrow. Finding no effect on low-propensity households would indicate the absence of externalities or other effects of microcredit availability on nonborrowers. Since low-propensity households come from both villages with low microcredit take-up (where almost everyone has a low propensity to borrow) and villages with higher take-up, our estimates on this specific population are likely to capture spillovers from borrowers and anticipation effect (impact from the mere fact that microcredit is available). For most outcomes we fail to reject that microcredit has no effect on the low-propensity sample. Motivated by this evidence, we use a treatment as an instrument for borrow-ing, the last step of our analysis.
For consistency with the other papers on microcredit, we first report a complete set of reduced-form estimates on the households in the top quartile of ex ante propensity to borrow, as well as on households that were added at endline. Even in this sample, we find fairly low take-up of microcredit (17 percent in treatment and 0 in con-trol). Households in treatment villages invest significantly more in self-employment
activities, particularly agriculture and animal husbandry, which are dominant ones (74 percent of the sample engages in either of these activities). We find a significant increase in total self-employment profit, on average, but the effect appears to be very heterogeneous. In particular, the effect on profits is significantly positive at the higher quantiles of profitability (as in other studies) but significantly negative at the lower quantiles. The moderate increase in self-employment income is offset by a decrease in employment income, which comes from a drop in labor supplied outside the farm or household business. Overall, income increases (insignificantly) and consumption declines slightly (again, this is insignificant). Finally, similarly to other studies, we find a significant decline in nonessential expenditures ( expendi-tures on festivals), but no change in any of the other “social outcomes” often meant to be affected by microcredit.
We then present, for our key variables, estimates of the impact of making micro-credit available in a village on the population as a whole. We do this by using our entire endline sample and applying the sampling probability in order to appropri-ately weight the observations. The bottom line is similar. Not surprisingly, take-up of microcredit is even smaller in this sample: 13 percent. Yet, the relatively small difference between the average household and one determined to be “high prob-ability” underscores how difficult it is to predict who will take up microcredit. Correspondingly, the impact on most variables of interest is also smaller. However, even at the population level, we find that microcredit access significantly increases sales and expenditures in the business (however there is now a negative and insignif-icant effect on profits). We also find significant declines in labor supplied outside the home and salary income, and an insignificant decrease in consumption.
As we mentioned, our test of externality fails to reject the hypothesis of no exter-nality, on every variable considered individually except for two (labor supply out-side the home and income). Of course, a caveat could be the lack of statistical power. We nevertheless move on to present an instrumental variable estimate of the impact of microcredit, using a dummy for being in a treatment village as an instrument for take-up. This essentially scales up our previous estimates, and gives us a sense of what the relatively modest reduced-form impact at the village level (or for likely borrowers) implies for those who actually borrow. On average, the point estimate suggests roughly a 50 percent increase in asset holding, a doubling of sales, and a more than doubling of profits. Labor outside the home declines by about 50 percent both in terms of earnings and hours supplied.
Back-of-the-envelope calculations suggest that our profit estimates imply an average return to microcredit capital in terms of business profit of around 140 per-cent, not taking into account interest payments. Given this appealing figure, why aren’t more people taking out loans? One possible reason is that, according to our estimates, the impacts of credit on profits are very heterogeneous. We present coun-terfactual distributions for profits among compliers based on Imbens and Rubin (1997): 25 percent of the compliers in the treatment groups have negative profits, while almost no one in the control group does. Given this risk level, it is plausible that individuals do not fully know what kind of returns to expect and are therefore hesitant to borrow. Another possibility is that profits do not capture welfare improve-ment. We observe no change in total income and consumption and a drop in hours
worked outside the home. We do not observe a significant increase in labor supply in the household business, but the confidence interval does not rule out a relatively large increase, and it is plausible that labor in the business was not adequately mea-sured, or that the hours spent taking care of a larger business are more stressful for the households. (Otherwise, it would suggest that the entire increase in total income due to microcredit is spent on leisure, which seems somewhat implausible given that households do not work very many hours to start with.)
Overall, our study confirms the key finding from other research: even in an envi-ronment with very little access to credit, the aggregate impact of microcredit on the population at large is fairly limited, at least in the short term. This holds true even for those who are most predisposed to borrow. We can reject that household consump-tion increased by more than 10 percent monthly among those who take up a loan. But our study reveals that, at least in this context, these lackluster impacts appear to result from the combination of several offsetting factors. First, the take-up is low, even in these rural areas of Morocco where there is essentially no formal credit alternative. Second, among those who take up, there are proportionally large average impacts on self-employment investments, sales, and profits although there also appears to be great heterogeneity in these effects. Third, in the Moroccan context, those gains are offset by correspondingly large declines in employment income, stemming from substantial decline in labor supplied outside the household. Thus, some households choose to take advantage of microcredit to change, in pretty significant ways, the way their lives are organized. But even these borrowers do not appear to choose microcre-dit as a means to increase their standard of living, at least in the relatively short run.
I. Context and Evaluation A. Al Amana’s rural credit Program
With about 307,000 active clients and a portfolio of 1,944 million Moroccan dirhams or MAD (US$235 million) as of December 2012, Al Amana is the larg-est microfinance institution in Morocco. Since the start of its activities in 2000, Al Amana expanded from urban areas, into peri-urban and then to rural areas. Between 2006 and 2007, Al Amana opened around 60 new branches in nondensely populated areas. Each branch has a well-defined catchment area served by credit agents permanently assigned to the branch.1
The main product Al Amana offers in rural areas is a group liability loan. Groups are formed by three to four members who agree to mutually guarantee the reim-bursement of their loans. Loan amounts range from 1,000 to 15,000 MAD (US$124 to US$1,855) per member. It can take 3 to 18 months to reimburse loans, through payments made weekly, twice a month, or monthly. For animal husbandry activities, a two-month grace period is granted. Interest rates on rural loans ranged between 12.5 percent and 14.5 percent at the time of the study (i.e. between 2006 and 2009). 1 A map is established and approved by Al Amana headquarters before the branch is opened, specifying the
exact area, and therefore villages, that are eligible to be served by the branch. An intervention area can consist of one to six rural communities, and several villages belong to a community.
To be eligible for a group liability loan, the applicant must be between 18 and 70 years old, hold a national ID card, have a residency certificate, and have been run-ning an economic activity other than nonlivestock agriculture for at least 12 months. Unlike most MFIs worldwide, Al Amana does not restrict its loans to women exclu-sively, but it does generally require that credit agents have at least 35 percent of women among their clients. However, this requirement was first removed among the branches participating in the study and then among all branches.
From March 2008, individual loans for housing and nonagricultural businesses were also introduced in rural areas. These loans were larger (up to 48,000 MAD, or about US$6,000), had an additional set of requirements, and were targeted at clients that could provide some sort of collateral. During our period of focus, households almost only took out group liability loans, so this study is primarily an evaluation of that product.
B. Experimental Design and Data collection
The design of our study tracked the expansion of Al Amana into nondensely populated areas between 2006 and 2007. Before each branch was opened, data was collected from at least six villages located on the periphery of the intervention areas— villages that could either have been included or excluded in the branch’s catchment area. Villages that were close to a rural population center or along a route to other areas served by the branch were excluded, as this would have disrupted Al Amana’s development. A very small number of villages where other MFIs were present (around 2 percent) were also excluded. Selected villages were then matched in pairs based on observable characteristics (number of households, accessibility to the center of the community, existing infrastructure, type of activities carried out by the households, type of agriculture activities). On average, two pairs per branch were kept for the evaluation. In each pair, one village was randomly assigned to treatment, and the other to control. In total, 81 pairs belonging to 47 branches were included in the evaluation. Between 2006 and 2007, Al Amana opened new branches in six phases. These branches were opened throughout rural Morocco.2 For the purposes of our evaluation,
we divided this expansion into four periods, and conducted the baseline survey in four waves of field operations between April 2006 and December 2007. Our sampling strategy followed a novel approach to maximize the evaluation’s power to detect both direct and population-level effects of microfinance access. Specifically, we selected two samples of households: one containing those with the highest probability to become clients of the microfinance institution and one containing a random selection of households from the rest of the population. Using the first sample increases the probability to detect an effect on those who are the most likely to become clients, if there is one. Using both samples together, with appropriate weights, allows us to mea-sure the effect on the whole population of offering access to microfinance services.
2 Our sample is spread throughout rural areas of the entire country. Opened branches, 47 in total, are located in
27 provinces belonging to 11 regions (out of a total of 16 regions in the country) and cover all main dialects spoken in the country. Figure B1 in the online Appendix shows the spatial distribution of Al Amana branches participating of the study.
To this end, in each of the 14 villages of the first wave, we sampled 100 households to whom we administered a full baseline survey. In villages of fewer than 100 house-holds, we surveyed them all. This wave took place in April–May 2006, six months before the scheduled launch of the second wave. We used data from this survey and administrative data on credit take-up in treatment villages over the first six months (reported weekly by credit agents) to estimate a model to predict the likeliness to borrow for each household. We present the result of this model in Appendix Table A1. Based on this model, we designed a short survey instrument including the key vari-ables predicting a higher likelihood to borrow.3 For each of the subsequent waves,
we started by administering this short survey to a random sample of 100 households in each village (or all the households if the village had fewer than 120). We entered survey data on computers on site, and an Excel macro selected the top quartile of households predicted to be the most likely to borrow on the basis of the model, as well as five additional households from the rest of the population. We administered the full baseline survey to this sample.
The baseline survey included questions on assets, investment, and production in agriculture, animal husbandry, nonagricultural self-employment activities, labor supply of all household members (hours and sectors), as well as a detailed con-sumption survey. Since microcredit aims to have broad impacts on behavior and well being, we also included questions on education, health, and women’s decision making power in the households.
After the baseline survey was completed in each wave, one treatment and one control village were randomly assigned within each pair. In treatment villages, credit agents started to promote microcredit and to provide loans immediately after the baseline survey.4 They visited villages once a week and performed various
pro-motional activities: door-to-door campaigns, meetings with current and potential clients, contact with village associations, cooperatives, and women’s centers, etc.
Two years after the start of each wave of the Al Amana intervention, we conducted an endline household survey, based on the same instrument, in the same 81 pairs of villages (May 2008–January 2010), and 4,465 households interviewed at baseline were sampled for endline.5 Of them, 92 percent (4,118 households) were found
and interviewed again. To maximize power, an additional 1,433 households (also predicted to have a high probability to borrow based on the credit model and the data from the short-form survey) were sampled at endline. To select these additional
3 The variables collected in this short survey were the following: household size, number of members older than
18, number of self-employment activities, number of members with trading or services or handicraft as main activ-ity, gets a pension, distance to souk (in km), does trading as self-employment activity, has a fiber mat, has a radio, owns land, rents land, does crop-sharing, number of olive and argan trees, bought agriculture productive assets over the past 12 months, uses sickle, uses rake (in agriculture), number of cows bought over the past 12 months, phone expenses over the past month (in MAD), clothes expenses over the past month (in MAD), had an outstanding formal loan over the past 12 months, would be ready to form a four-person group and guarantee a loan mutually, amount that would be able to reimburse monthly (in MAD), would take out a loan of 3,000 MAD to be repaid in nine monthly installments of 400 MAD.
4 By the time of the baseline survey, branches were fully operational and were conducting business in the center
of their catchment areas (within a 5 km radius of the branch location). Once the baseline survey was completed, credit agents started to cover the whole branch catchment area, with the only exception of control villages.
5 In wave 1 villages, we kept for the analysis 25 percent of households with a high probability to borrow, plus
households, we reestimated the model to predict the likelihood to borrow for each household using administrative data on who borrowed by the time of the endline survey (i.e. over the two years of the evaluation time frame), matched with data collected with the short-form survey before the rollout of microcredit (and, hence, not affected by the rollout), updated the dependent variables including clients over the two-year period, and reestimated the coefficients of the model. This allowed us to much better identify likely borrowers.6 Thus, the endline household survey was
conducted, in total, with 5,551 households.7
C. Potential Threat to Experiment integrity
The experimental design was generally well respected, and we observe essen-tially no entry of Al Amana (or any other MFI, as it turns out) in the control group.8
Villagers did not travel to other branches to get loans either.
Attrition was not a major concern in the experiment since 92 percent of the house-holds in the baseline were found at endline. (Attrition is slightly higher in the treat-ment group at 8.6 percent, compared to 6.8 percent in control; see Table 1, panel B.) Tables B3 and B4 in the online Appendix compare attrition in the treatment and the control groups, and examine the characteristics of the attritors compared to nonat-tritors. Table B3 focuses on attrition of the baseline sample, while Table B4 uses the short-form survey to examine attrition in the full endline sample (including house-holds that were not included at baseline). Attritors belong to smaller households with younger household heads, and are less likely to have a self-employment activity. We then look at whether attritors’ characteristics differ between the treatment and control groups (panel C of Tables B3 and B4). We find only two characteristics that differs for attritors in treatment villages (they are relatively more likely to run a self-employment activity and less likely to borrow from other formal institutions).
Next, we examine balance between treatment and control. Table 1 provides means in the control group and the treatment-control difference for the variables collected in the baseline survey of 4,465 households. In Table B1 and B2, we reproduce the same analysis for the whole sample of 5,898 households and for the 4,934 house-holds with high probability to borrow.
Unfortunately, there are some differences between the treatment and control groups, more than would be expected by pure chance (although we know that the 6 Note that the sample is still selected using a linear combination of variables collected at baseline (the same in
treatment and control villages) and is therefore not endogenous to the treatment.
7 Out of the 5,551, to remove obvious outliers without risking cherry-picking, we trimmed 0.5 percent of
obser-vations using the following mechanical rule: for each of the main continuous variables of our analysis (total loan amount, Al Amana loan amount, other MFI loan amount, other formal loan amount, utility company loan amount, informal loan amounts, total assets, productive assets of each of the three self-employment activities, total production, production of each of the three self-employment activities, total expenses, expenses of each of the three self-employ-ment activities, income from employself-employ-ment activities, and monthly household consumption), we computed the ratio of the value of the variable and the ninetieth percentile of the variable distribution. We then computed the maximum ratio over all the variables for each household and we trimmed 0.5 percent of households with the highest ratios. Analysis is thus conducted over 5,424 observations instead of the original 5,551, and no further trimming is done in the data.
8 A few of the originally selected pairs of treatment and control villages were removed from the sample
early on—before data collection—because it turned out that the treatment and control villages were served by another Al Amana branch. A few more were removed because Al Amana decided not to operate in their area at all. Implementation was done effectively and according to plan in the rest of the sample.
Table 1—Summary Statistics
Control group Treatment - Control
Obs. Obs. Mean SD Coeff. p-value
Panel A. Baseline household sample Household composition:
Number members 4,465 2,266 5.14 2.70 0.04 0.583
Number adults (>=16 years old) 4,465 2,266 3.45 1.99 0.03 0.564
Number children (<16 years old) 4,465 2,266 1.68 1.65 0.01 0.859
Male head 4,465 2,266 0.935 0.246 0.001 0.813
Head age 4,465 2,266 48 16 1** 0.012
Head with no education 4,465 2,266 0.615 0.487 −0.013 0.353
Access to credit:
Loan from Al Amana 4,465 2,266 0.007 0.084 −0.003 0.425
Loan from other formal institution 4,465 2,266 0.060 0.238 0.030** 0.023
Informal loan 4,465 2,266 0.068 0.251 0.023*** 0.006
Electricity or water connection loan 4,465 2,266 0.156 0.363 0.013 0.523
Amount borrowed from (in MAD):
Al Amana 4,465 2,266 34 460 −13 0.534
Other formal institution 4,465 2,266 355 2,340 92 0.188
Informal loan 4,465 2,266 248 2,248 −8 0.880
Electricity or water entities 4,465 2,266 528 1,370 22 0.758
Self-employment activities Number activities 4,465 2,266 1.6 1.2 0.0 0.435 Farms 4,465 2,266 0.599 0.490 0.017 0.321 Investment 4,465 2,266 13 72 0 0.775 Sales 4,465 2,266 9,335 36,981 −392 0.665 Expenses 4,465 2,266 3,369 8,428 266 0.241 Savings 4,465 2,266 1,271 3,505 −77 0.433 Employment 4,465 2,266 22 95 −1 0.477 Self-employment 4,465 2,266 61 102 5 0.122
Does animal husbandry 4,465 2,266 0.533 0.499 0.042** 0.027
Investment 4,465 2,266 397 1,912 67 0.2 Sales 4,465 2,266 3,444 8,831 339 0.184 Expenses 4,465 2,266 4,111 10,897 386 0.206 Savings 4,465 2,266 10,249 17,032 1,066* 0.050 Employment 4,465 2,266 7 49 −1 0.272 Self-employment 4,465 2,266 111 158 7 0.215
Runs a non-farm business 4,465 2,266 0.217 0.412 −0.034** 0.011
Number activities managed by women 4,465 2,266 0.218 0.585 0.004 0.750
Share of HH activities managed by women 4,465 2,266 0.160 0.367 0.007 0.466
Distance to souk 4,125 2,077 20.1 25.2 0.2 0.87
Has income from:
Self-employment activity 4,465 2,266 0.780 0.414 −0.016 0.163
Day labor/salaried 4,465 2,266 0.580 0.494 −0.016 0.194
risks:
Lost more than 50 percent of the harvest 4,125 2,077 0.106 0.308 0.004 0.642
Lost more than 50 percent of the livestock 4,125 2,077 0.030 0.172 0.003 0.606 Lost any livestock over the past 12 months 4,465 2,266 0.189 0.392 0.029** 0.012 HH member illness, death,
and/or house sinister 4,465 2,266 0.218 0.413 0.013 0.168
consumption:
Consumption (in MAD) 4,465 2,266 2,272 1,349 28 0.440
Non-durables consumption (in MAD) 4,465 2,266 2,227 1,295 20 0.559
Durables consumption (in MAD) 4,465 2,266 45 236 8 0.231
HH is poor 4,465 2,266 0.247 0.431 0.002 0.858
Panel B. Attrition
Not surveyed at endline 4,465 2,266 0.068 0.252 0.018** 0.018
notes: Unit of observation: household. Panel A and B: sample includes all households surveyed at baseline. *** Significant at the 1 percent level.
** Significant at the 5 percent level. * Significant at the 10 percent level. Source: Baseline household survey
randomization was well done, since it was carried out in our office, by computer). Jointly, these baseline characteristics are different in the treatment and control groups. At baseline, households in treatment villages had, on average, a slightly larger access to financial services, but not larger loans. They had higher probability to be engaged in livestock activity in treatment villages, and, hence, larger assets, and lower probability to run a nonfarm business. As a result of these imbalances, we include individual-level control variables in our analysis, and present a robustness check without such control variables in the Appendix. Our results are not sensitive to control variables.
II. Reduced-Form Results
For consistency with the other papers in the literature, we first report a set of reduced-from results on the sample of likely borrowers (the top quartile of house-holds selected to be most likely to borrow). We then turn to population-level esti-mates, and estimates of the impact of the treatment on the treated.
A. Specification
We estimate the following reduced-form specification: (1) y pij = α + β T pi + X pij δ +
∑
m=1
p
γ m 1(p = m) + ω ij ,
where p denotes the village pair, i the village, and j the household. T pi is a dummy for the introduction of microcredit in village i , and y pij is an outcome for household j in village i in pair p . X pij is a vector of control variables.9 The regression includes the 81 pair dummies represented by
∑
m=1p
γ m 1(p = m) . Standard errors are clustered at the village level.
Equation (1) is estimated on two different samples. The first is the sample of households more likely to become clients of the microfinance institution (see Section IIB). In Section IIIA, we also present estimation results obtained using the whole sample, using sampling weights to obtain results representative of the whole village population. As we evaluate the effect of microcredit on a large number of outcomes, we account for multiple hypothesis testing. Each table of results we pres-ent focuses on a specific family of outcomes for which we produce (in the last column) an index (which is the average of the z-scores of each outcome within the family). Furthermore we report both the standard p-value and the p-value adjusted for multiple hypotheses testing across all the indexes.10 For a reduced set of
out-come variables (and still for the sample of likely borrowers), we also consider the 9 The basic set of covariates for most of our regression includes the number of household members, number of
adults, head age, does animal husbandry, does other nonagricultural activity, had an outstanding loan over the past 12 months, household spouse responded the survey, and other household member (excluding the head) responded the survey. Since part of the sample includes households that were only included at endline, we do not have baseline information for them. In regressions, we enter a dummy variable identifying them and set to zero the other covari-ates. We present in online Appendix Table B7 regression results in which no covariates are introduced and a table in which an extended set is considered.
corresponding quantile regressions. To perform the regression we follow Chamberlain (1994) and simply compute the desired quantiles of the considered outcome vari-able in each village and then implement minimum distance estimation, explaining the different estimated quantiles by the treatment variable and pair dummy vari-ables. We consider quantiles 10, 25, 50, 75, and 90 percent.
B. Access to credit
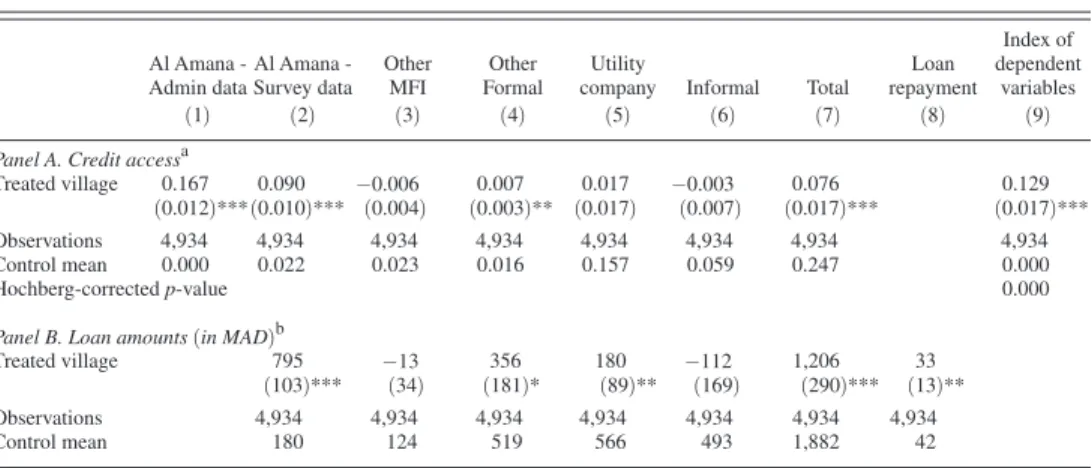
Table 2 presents the results on credit access and borrowing. As in previous studies (Banerjee et al. 2013; Karlan and Zinman 2010), we find that households tend to underreport borrowing: administrative data suggest that 17 percent of households in this sample borrow in the treatment villages (and none in the control villages), while in survey data only 11 percent of households admit to borrowing.
The administrative data is more reliable in this context, and this is what we will use for the first stage in our instrumental variable regressions below. Access to any other form of formal credit is very limited. In the control villages, 2 percent of house-holds report borrowing from another MFI, 2 percent from another bank, and 2 per-cent from any other formal source. Only 6 per2 per-cent report borrowing from informal
Table 2—Credit
Al Amana -
Admin dataSurvey dataAl Amana - OtherMFI FormalOther companyUtility Informal Total repaymentLoan
Index of dependent
variables
(1) (2) (3) (4) (5) (6) (7) (8) (9)
Panel A. credit accessa
Treated village 0.167 0.090 −0.006 0.007 0.017 −0.003 0.076 0.129
(0.012)***(0.010)*** (0.004) (0.003)** (0.017) (0.007) (0.017)*** (0.017)***
Observations 4,934 4,934 4,934 4,934 4,934 4,934 4,934 4,934
Control mean 0.000 0.022 0.023 0.016 0.157 0.059 0.247 0.000
Hochberg-corrected p-value 0.000
Panel B. Loan amounts (in MAD)b
Treated village 795 −13 356 180 −112 1,206 33
(103)*** (34) (181)* (89)** (169) (290)*** (13)**
Observations 4,934 4,934 4,934 4,934 4,934 4,934 4,934
Control mean 180 124 519 566 493 1,882 42
notes: Observation unit: household. Sample includes households with high probability-to-borrow score surveyed at endline, after trimming 0.5 percent of observations (3,525 who got both a full baseline and endline household survey administered, plus an additional 1,409 households who got only the full endline survey administered). (See Section 3 for an explanation of sample strategy.) Coefficients and standard errors (in parentheses) from an OLS regression of the variable on a treated village dummy, controlling for strata dummies (paired villages) and variables specified below. Standard errors are clustered at the village level. Controls include: number of household mem-bers, number of adults, head age, does animal husbandry, does other non-agricultural activity, had an outstanding loan over the past 12 months, HH spouse responded to the survey, and other HH member (excluding the HH head) responded to the survey. Column 9: the dependent variable consists of an index of z-scores of the outcome variables in columns 2–8 (including both credit access and loan amounts) following Kling, Liebman, and Katz (2007). p-val-ues for this regression are reported using Hochberg’s correction method.
a Column 1–8: dummy variable equal to 1 if the households had an outstanding loan over the 12 months prior
to the survey.
b Sum of outstanding loans (in MAD) over the 12 months prior to the survey.
*** Significant at the 1 percent level. ** Significant at the 5 percent level. * Significant at the 10 percent level.
sources though this may be underestimated to the extent that households do not like to admit to borrowing (as it is frowned upon by Islam), or to the extent that informal loans between villagers are recorded as gifts. The only common source of loans is the utility companies: 16 percent of households in control villages borrow from a utility company to finance their electricity or water and sanitation installation. The pattern is very similar in treatment villages, except that households report 1pp more borrowing from other formal sources (there may be some confusion between these other sources and Al Amana, partially accounting for the underreporting of Al Amana loans). Therefore microfinance was introduced by Al Amana in our treat-ment villages in a context where households had very limited alternative access to finance. This is a unique feature that sets our study apart from most other impact evaluations of access to microfinance.
Turning to loan amounts, households in treatment villages report additional out-standing loans of 795 MAD (US$96), on average, from Al Amana over the 12 months prior the survey.11 There are also small but significant increases in reported amounts
borrowed from both other formal credit sources and the utility companies, as well as a small insignificant substitution with informal loans, which might be related to con-fusion between various types of loans, as previously mentioned. In total, average out-standing loan amount increases by 1,206 MAD and repayment per month increases by 33 MAD, as reported by households in treatment villages. Online Appendix Table B5 uses administrative data to provide some characteristics of the loans dis-bursed by Al Amana in treatment villages. According to this administrative data, clients in treatment villages borrowed, on average, 10,571 MAD. This compares to outstanding loan amounts of 8,863 MAD as declared in our survey data.12 Thus,
households underreport borrowing both on the extensive and the intensive margins. In terms of other loan characteristics, clients most often form groups of four people who act as mutual guarantors and reimburse their loans in 12 or 18 monthly install-ments. The average client household took up a loan 5.7 months after microcredit was made available in the village and 50 percent of them took a second loan by the end of the two-year evaluation timeframe. Most of loans were taken within the first six months (67.9 percent). When applying for microcredit, most of clients ( 68 per-cent) declared to be planning to use the loan in animal husbandry activities, mainly cattle and sheep rising, 26.4 percent in trade-related businesses, and the remaining 5.5 percent in other nonagricultural businesses, such as services and handicraft. It is not surprising that no client declared an intent to allocate loans to other agricultural activities (crops and fruit trees), as Al Amana did not lend for such activities.
C. income Levels and composition, and Labor Allocation
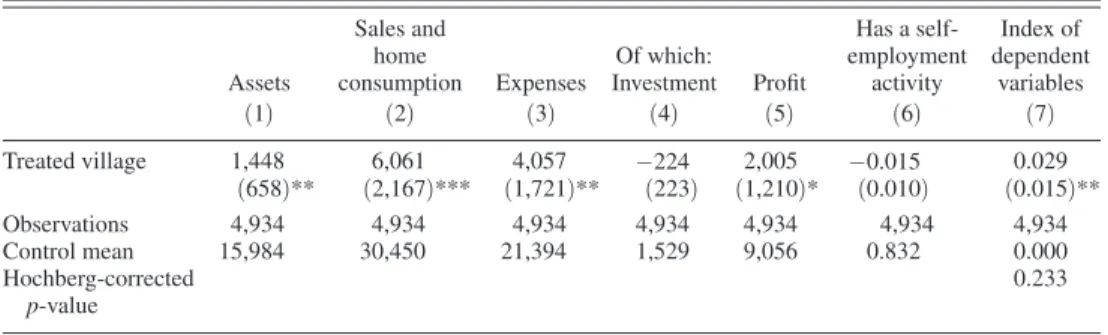
Table 3 shows the impact of the introduction of microcredit on self-employment activities. Eighty-three percent of the households in the control group have some
11 Average outstanding loans of 975 MAD (795 + 180) represent 2.7 percent of average household annual
con-sumption in the control group. If we consider loan amounts declared by actual borrowers in our survey, this share increases to 24 percent of annual consumption.
form of self-employment activity—the dominant forms being animal husbandry and agriculture—whereas only 14.7 percent of households have a nonfarm business (see online Appendix Table B6).
The results of Table 3 suggest that the introduction of microcredit leads to a significant expansion of the existing self-employment activities in agriculture and animal husbandry, but does not help start new activities. We even find a small non-significant reduction in self-employment of 1.5 percentage points for the households in treated villages.
Access to microfinance has a positive effect on assets: the estimated impact is 1,448 MAD. We do not find any effect of microcredit on investments over the last 12 months, probably because most additional investments caused by the new access to microfinance took place in the first year of the intervention (since most loans were disbursed in the first 6 months), thus more than 12 months before the endline.
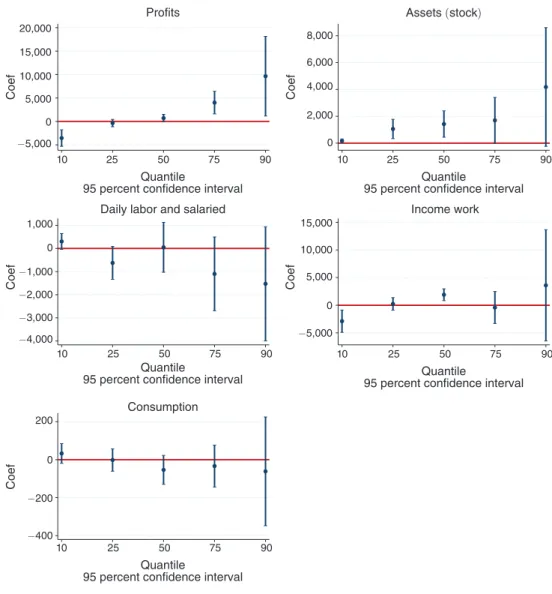
Figure 1 shows that quantile treatment effects on asset accumulation are posi-tive at almost all quantiles. Assets of self-employment activities mainly consist of animals (cows or goats) owned by the households. Additional results reported in Table B6 show that the impact on the stock of assets mainly comes from livestock activities. This building up of assets could correspond to business investment strat-egy (the assets representing unrealized profits), or to a self-insurance mechanism (the assets are in-kind savings), or to a combination of the two.
One other important result in Table 3 is that, summed across all types of activ-ities, there is a significant expansion in self-employment activities (which comes from existing activity since there is no impact on the extensive margin): revenues,
Table 3—Self-Employment Activities: Revenues, Assets, and Profits
Assets
Sales and home
consumption Expenses InvestmentOf which: Profit
Has a self- employment activity Index of dependent variables (1) (2) (3) (4) (5) (6) (7) Treated village 1,448 6,061 4,057 −224 2,005 −0.015 0.029 (658)** (2,167)*** (1,721)** (223) (1,210)* (0.010) (0.015)** Observations 4,934 4,934 4,934 4,934 4,934 4,934 4,934 Control mean 15,984 30,450 21,394 1,529 9,056 0.832 0.000 Hochberg-corrected p-value 0.233
notes: Observation unit: household. Coefficients and standard errors (in parentheses) from an OLS regression of the variable on a treated village dummy, controlling for strata dummies (paired villages) and variables specified below. Standard errors are clustered at the village level. Same controls as in Table 2. Definitions: Column 1 Sum of assets owned in the three activities, including the stock of livestock; column 2 Total Production = sum of agricultural, livestock, and non-agricultural business production over the 12 months prior to the survey. Production includes both sales and self-consumption. Agricultural production also includes stock; column 3 Sum of labor, inputs, rent and investment in all three activities, purchased over the 12 months prior to the survey; column 4 Sum of productive assets purchased over the 12 months prior to the survey. Animal husbandry assets include the purchases of livestock; column 5 Profit = column 2–column 3;column 6 Variable equals 1 if the HH ran a self-employment activity over the 12 months prior to the survey; column 7 The dependent variable consists of an index of z-scores of the outcome variables in columns 1–6 following Kling, Liebman, and Katz (2007). p-values for this regression are reported using Hochberg’s correction method.
*** Significant at the 1 percent level. ** Significant at the 5 percent level. * Significant at the 10 percent level. Source: Endline household survey
expenditures, and profit all significantly increase. Profit, defined as the difference between revenues and expenses, increases by 2,005 MAD, a substantial amount compared to the average profit in the control group, 9,056 MAD. Figure 1 presents the results of quantile regressions. It shows that quantile treatment effects are sig-nificantly negative for the lowest quantile (0.10), nonsignificant at the median, and significantly positive for the quantiles 75 and 90. The finding that the increase in self-employment activity is concentrated at the highest quartile echoes Banerjee et al. (2013) and Angelucci, Karlan, and Zinman (2013). Negative profits at the low end of the distribution might be partially due to long-term investments misclassified as current expenses. These quantile treatment effects are only reduced forms: they do not necessarily mean that the impact of getting credit itself has the same hetero-geneity (since there may be externalities, and we do not know where the compliers lie in the distribution of outcomes). We return to this question in Section IIIC.
Profits Assets (stock)
Daily labor and salaried Income work
Coef Coef Consumption 10 25 50 75 90 1,000 0 −1,000 −2,000 −3,000 −4,000 Coef 15,000 10,000 5,000 0 −5,000 Coef 8,000 6,000 4,000 2,000 0 Coef 20,000 15,000 10,000 5,000 0 −5,000 200 0 −200 −400 Quantile
95 percent confidence interval
10 25 50 75 90
Quantile
95 percent confidence interval
10 25 50 75 90
Quantile
95 percent confidence interval
10 25 50 75 90
Quantile
95 percent confidence interval
Quantile
95 percent confidence interval
10 25 50 75 90
Table 4 shows the impact of microcredit on different sources of income. The major result in this table is that the increase in self-employment profit is offset by a significant decrease in employment income.
Note that, despite the fact that 83 percent of households have a self-employ-ment activity, employself-employ-ment income accounts for as much as 56.9 percent of house-hold income while self-employment activities account for only 32.7 percent. Most (90 percent) of employment income comes from casual (day) labor and very little from stable salaried work (10 percent). The effect of access to microfinance is quite substantial, −1,050 MAD, a reduction of 6.7 percent compared to the control group mean. As a result of the reduction in wage earnings, the net increase of employ-ment and self-employemploy-ment income taken together is small and insignificant. Thus, it appears that, in this context, microfinance access leads to a change in the mix of activities, but no income growth overall.
Table 5 reports on the effect of the introduction of microcredit on the time worked by household members aged 6 to 65 over the past 7 days, for various age ranges.
Column 1 shows that there is an insignificant reduction in the total amount of hours of labor supplied, and columns 2–4 show there is substitution between the different types of activities. Considering all members together, we find a significant reduction in work outside the home of 2.8 hours, or 8.3 percent of the control group mean. Time spent on self-employment activities increases, but not significantly so. Overall, hours of work decline in every age group, although the reduction is signifi-cant only for the youth (16 to 20) and the elderly (51 to 65).
The reduction in labor supplied outside the home is consistent with the results on employment income (Table 4). The relatively small increase in time spent on self-employment activities despite increased investment may be due to the fact that
Table 4—Income
HH income, over the past 12 months, from:
Total Self-employment, daily labor, and salaried Self-employment activities Day labor and
salaried Household asset sales Other
Index of dependent
variables
(1) (2) (3) (4) (5) (6) (7)
Panel A. income (in MAD)
Treated village 447 954 2,005 −1,050 −679 171 0.000 (1,342) (1,267) (1,210)* (478)** (262)** (233) (0.017) Observations 4,934 4,934 4,934 4,934 4,934 4,934 4,934 Control mean 27,669 24,804 9,056 15,748 709 2,157 0.000 Hochberg-corrected p-value 0.981
notes: Observation unit: household. Coefficients and standard errors (in parentheses) from an OLS regression of the variable on a treated village dummy, controlling for strata dummies (paired villages) and variables specified below. Standard errors are clustered at the village level. Same controls as in Table 2. Definitions: column 3: income equals total profit from the self-employment activity; column 7: the dependent variable consists of an index of z-scores of the outcome variables in columns 1–6 following Kling, Liebman, and Katz (2007). p-values for this regression are reported using Hochberg’s correction method.
*** Significant at the 1 percent level. ** Significant at the 5 percent level. * Significant at the 10 percent level. Source: Endline household survey
investments in agriculture and animal husbandry may not need to be coupled with a proportional increase in labor input. Still, this is a remarkable fact: the average quantity of labor (24 hours per week) supplied per adult household member seems relatively low, suggesting that members may have the opportunity to increase their
Table 5—Time Worked by HH Members Hours worked by household members
over the past seven daysa
Number of HH members Index of dependent variables Total Of which: Self-employment activities Outside activities Chores (1) (2) (3) (4) (5) (6)
Household members 6–65 years old
Treated village −3.3 1.1 −2.8 −1.6
(2.5) (1.5) (1.1)*** (1.0)*
Control mean 143.1 46.9 33.8 62.3 5.2
Household members 6–15 years old
Treated village −0.5 0.5 0.2 −1.3
(0.7) (0.4) (0.3) (0.4)***
Control mean 19.2 6.3 3.4 9.4 1.4
Household members 16–20 years old
Treated village −1.4 −0.2 −1.3 0.1
(0.8)* (0.4) (0.4)*** (0.4)
Control mean 21.6 6.6 5.5 9.6 0.8
Household members 21–50 years old
Treated village −0.5 1.1 −1.5 0.0
(1.5) (0.8) (0.8)** (0.6)
Control mean 84.4 26.3 21.9 36.3 2.5
Household members 51–65 years old
Treated village −1.2 −0.5 −0.3 −0.4 (0.6)** (0.3) (0.3) (0.3) Control mean 18.2 8.1 3.1 7.0 0.6 Observations 4,918 4,918 4,918 4,918 4,918 index Treated village −0.017 (0.010)* Observations 4,918 Control mean 0.000 Hochberg-corrected p-value 0.320
notes: Observation unit: household. Coefficients and standard errors (in parentheses) from an OLS regression of the variable on a treated village dummy, controlling for strata dummies (paired villages) and variables specified below. Standard errors are clustered at the village level. Same controls as in Table 2. Column 6: the dependent variable con-sists of an index of z-scores of the outcome variables in all panels of columns 1–4 following Kling, Liebman, and Katz (2007). p-values for this regression are reported using Hochberg’s correction method.
a Sum of hours worked by household members over the past 7 days in self-employment, outside activities and
housework. Households were asked at endline survey about the # of hours worked by each HH member over the past 7 days.
*** Significant at the 1 percent level. ** Significant at the 5 percent level. * Significant at the 10 percent level. Source: Endline household survey
efforts by a large margin (provided that we measure time allocation correctly). This would suggest that households take the opportunity of access to credit to invest in less labor-intensive occupations and increase their leisure time.
D. consumption
Table 6 reports the estimated effects of the introduction of microcredit on house-hold consumption (expenditure and consumption of home production are both included). The table shows the effect on total consumption at the household level (column 1), and by type of consumption expenditures: durables, nondurables, food, health, etc. (columns 2 to 8).
Consistent with the lack of effect of overall income, we find a small, negative, and insignificant point estimate on consumption (46 MAD per month). This absence of effect on consumption is confirmed by quantile treatment effect presented in Figure 1, which shows no effect at any quantile.
Turning to the composition of consumption, we do not find the increase in dura-ble consumption that other papers have reported, but this may be due to the fact that the survey was administered more than 12 months after most people got the loans. Consistent with all the other papers, we find a statistically significant reduction in nonessential expenditures (in this case, festivals, rather than other temptation goods).
E. Education and Female Empowerment
The impact of microfinance is supposed to go beyond the expansion of busi-ness activity and consumption levels. Indirect effects, such as the empowerment of women and improvements in the health status and education levels of children, are often considered potential impacts of microfinance.
Table 6—Consumption
Monthly household consumption (in MAD) in:
Index of dependent
variables Total Durables durablesNon- Food Health Education
Temptation and entertainment Festivals and celebrations (1) (2) (3) (4) (5) (6) (7) (8) (9) Treated village −46 18 −63 3 3 −1 −6 −39 −0.015 (47) (16) (44) (23) (5) (1) (6) (12)*** (0.015) Observations 4,924 4,924 4,924 4,924 4,924 4,924 4,924 4,924 4,924 Control mean 3,057 64 2,993 1,784 46 24 298 425 0.000 Hochberg-corrected p-value 0.938
notes: Observation unit: household. Coefficients and standard errors (in parentheses) from an OLS regression of the variable on a treated village dummy, controlling for strata dummies (paired villages) and variables specified below. Standard errors are clustered at the village level. Same controls as in Table 2. Definitions: column 1–8: Monthly household expenditures, including food self-consumption; column 9: the dependent variable consists of an index of z-scores of the outcome variables in columns 1–8 following Kling, Liebman, and Katz (2007). p-values for this regression are reported using Hochberg’s correction method.
*** Significant at the 1 percent level. ** Significant at the 5 percent level. * Significant at the 10 percent level. Source: Endline household survey
We did not see any shift in the composition of household consumption that would support this hypothesis. Table 7 looks at other “empowerment” outcomes, namely, education and female empowerment. We find no impact on education, despite the reduction in outside labor among teenagers (other randomized controlled trials have found different effects, some finding positive and others negative impacts).
Since the majority of borrowers of our sample are men, the expected effect on female empowerment is less clear cut than for standard microfinance programs, which tend to focus on women. Nevertheless, we do examine the impacts on female empowerment using several proxies. The first is the number of income-generating activities managed by a female household member (column 5). In remote rural areas, such activities are usually managed by male members (1.5 activities, on aver-age, compared to 0.39 for women). We also use a series of qualitative indicators to describe female empowerment such as the capacity of women to make decisions, and their mobility inside and outside the villages. We construct a summary index of these qualitative variables (column 3) as they are part of the same “family” of out-comes. We find no evidence of the effect of microfinance on any of these variables or on the index.
These results are in line with the fact that only a small proportion of women bor-row in remote rural areas and that additional borbor-rowing for men is unlikely to change the bargaining power of women within the household. They are also consistent with the results from all the other microfinance evaluations except for Angelucci, Karlan, and Zinman (2013), which find improvements in female empowerment in Mexico.
Table 7—Social effects Share of kids aged 6–15 in school Share of teenagers (aged 16–20) in school Index of women independencea Share of household with self- employment activities managed by women Number of self- employment activities managed by women Index of dependent variables (1) (2) (3) (4) (5) (6) Treated village 0.004 −0.004 0.169 −0.014 −0.02 −0.007 (0.008) (0.006) (0.205) (0.009) (0.01) (0.012) Observations 4,934 4,934 4,934 4,934 4,934 4,934 Control mean 0.453 0.088 −0.069 0.248 0.39 0.000 Hochberg-corrected p-value > 0.999 notes: Observation unit: household. Coefficients and standard errors (in parentheses) from an OLS regression of the variable on a treated village dummy, controlling for strata dummies (paired villages) and variables specified below. Standard errors are clustered at the village level. Same controls as in Table 2. Column 6: the dependent vari-able consists of an index of z-scores of the outcome varivari-ables in columns 1–5 following Kling, Liebman, and Katz (2007). p-values for this regression are reported using Hochberg’s correction method.
a Effect on the sum of 14 standardized measures (measures include: at least one woman in the household has
currently an own activity, decides by herself on activity assets, buys activity assets herself, decides by herself on activity inputs, buys inputs herself, decides what to produce, commercializes production, decides by herself on commercialization, makes sales herself, had an own activity in the past five years, is allowed to go to the market by herself, is allowed to take public transportation by herself, is allowed to visit family by herself, is allowed to visit friends by herself). Each measure is coded so that 1 reflects independence and 0 reflects lack of independence.
*** Significant at the 1 percent level. ** Significant at the 5 percent level. * Significant at the 10 percent level. Source: Endline household survey
III. Estimation of Externalities and Instrumental Variable Estimates
Section II presented reduced-form estimates of the impacts of access to micro-credit on the specific population of households that were ex ante the most likely to become clients of Al Amana. We were also interested in two other questions: measuring impacts on the population as a whole, and disentangling direct effects on those who choose to borrow from indirect effects on others, such as general equi-librium effects due to changes in prices, or changes in behavior stemming from the possibility to borrow in the future. We now exploit our experimental design to get at both questions.
A. impact of Access to Microcredit over the Whole Population of Selected Villages Measuring the impact of access to credit on the village population is straight-forward given our design: we just reestimate the same set of regressions, but using the whole sample, and weighting appropriately using the sampling weights, so that the estimates are now representative at the village level. Those results are of course representative of the marginal villages selected to be in our experiment (and not of the entire catchment area of Al Amana branch).
Table 8 presents the results for some key outcome variables. Panel A simply reproduces the results presented in Section II for the population of households likely to become clients of Al Amana (those who were in the top quartile of the propen-sity score). Panel B presents intention-to-treat estimates on the same outcomes but over the whole population selected for the endline survey (the households in the top quartile plus the five randomly selected), weighted by the inverse of the probability to be selected in that population.
Not surprisingly, take-up of microcredit is even smaller in this sample (13 per-cent), although the relatively small (though statistically significant) difference with the “high-probability” sample underscores how difficult it is to predict who will take up microcredit. Correspondingly, the impact on most variables of interest is also smaller. However, even at the population level, still we find that microcredit access significantly increases sales and expenditures in the business. We also find significant declines in labor supplied outside the home and in salary income, and an insignificant decrease in consumption. There is now a negative and insignificant impact on profits: combined with the estimate on likely borrowers and the quan-tile regressions, which did show significant negative treatment effects at the lowest quantiles, this suggests that those who are least likely to borrow are those with the most negative treatment effect on profit.
B. Externalities
Prima facie, results in the previous section are not suggestive of strong exter-nalities. We evaluate the effect of the treatment on the samples of households with high and low propensity to borrow. Finding no effect on the households who are predicted not to borrow is an indication that the no effect on nonborrowers (in the form of externalities and anticipation effects). In practice, we estimate the treatment
effect separately for those with the highest 30 percent and lowest 30 percent proba-bility to borrow, and omit the middle group.
To implement this test, we first reestimate the propensity to borrow based on actual endline behavior. By using actual borrowing behavior as measured by the end-line survey, instead of using the model based on only pilot phase 1, we increase the
Table 8—Externalities
Weekly hours worked by HH members aged
16–65 Client
Al Amana - Admin
data (Assets stock)
Sales and home
consumption Expenses Profit
Income from day
labor/
salaried employment Outside
Self-Monthly HH consumption (in MAD) (1) (2) (3) (4) (5) (6) (7) (8) (9) Panel A. Borrowers Treated village 0.167 1,448 6,061 4,057 2,005 −1050 0.6 −3.0 −46 (0.012)*** (658)** (2,167)*** (1,721)** (1,210)* (478)** (1.3) (1.0)*** (47) Observations 4,934 4,934 4,934 4,934 4,934 4,934 4,918 4,918 4,924 Control mean 0.000 15,984 30,450 21,394 9,056 15,748 40.6 30.4 3,057
Panel B. All sample weighted
Treated village 0.132 1,003 3,710 4,186 −476 −1234 0.5 −2.0 −44
(0.011)*** (705) (1,942)* (1,334)*** (1,252) (558)** 1.1 (1.1)* (36)
Observations 5,524 5,524 5,524 5,524 5,524 5,524 5,508 5,508 5,513
Control mean 0.000 15,493 26,376 17,263 9,113 15,911 39 30.0 2,927
Panel c. Top and bottom 30 percent unweighted
Treated village 0.363 1,033 15,774 10,171 5,603 −2,113 2.9 −7.0 −93 × high predicted propensity to borrow (0.011)*** (1,296) (4,154)***(3,555)***(2,452)** (692)*** (2.3) (1.8)*** (94) Treated village 0.015 1,612 647 1,013 −366 −2,453 −1.4 −6.2 82 × low predicted propensity to borrow (0.003)*** (1,132) (2,701) (1,737) (1,734) (795)*** (1.3) (1.6)*** (62) Observations 3,315 3,315 3,315 3,315 3,315 3,315 3,303 3,303 3,307 Control mean 0.000 17,611 31,667 22,343 9,325 16,119 40.0 31.9 3,063 Control mean, high PTB 0.000 21,692 37,988 27,073 10,915 15,652 45.8 32.4 3,253 Control mean, low PTB 0.000 13,691 25,595 17,798 7,796 16,567 34.4 31.4 2,881 p-value: T × low PTB = T × high PTB 0.000 0.724 0.002 0.022 0.049 0.746 0.106 0.727 0.113
notes: Observation unit: household. Panel A: sample includes households with high probability-to-borrow score. Panel B: sample includes both households with high probability-to-borrow score and households picked at ran-dom. Observations are weighted by the inverse probability of being sampled. Panel C: sample includes both house-holds with high probability-to-borrow score and househouse-holds picked at random, but only those in the top 30 percent and in the bottom 30 percent of the predicted propensity to borrow (PTB) distribution. All panels include sample after 0.5 percent trimming of observations. Panel A and B: coefficients and standard errors (in parentheses) from an OLS regression of the variable on a treated village dummy, controlling for strata dummies (paired villages) and variables specified below. Panel C: coefficients and standard errors (in parentheses) from an OLS regression of the variable on a treated village dummy interacted with a dummy equal to 1 if HH predicted propensity to borrow is in the 0–30th percentile of the PTB distribution (Low Predicted PTB), on a treated village dummy interacted with a dummy equal to 1 if HH predicted PTB is in the 70–100th percentile of the PTB distribution (High Predicted PTB) and on a dummy equal to 1 if HH predicted PTB is in the 0–30th percentile of the PTB distribution (not shown), controlling for strata dummies (paired villages) and variables specified below. All panels: standard errors are clus-tered at the village level. Same controls as in Table 2.
*** Significant at the 1 percent level. ** Significant at the 5 percent level. * Significant at the 10 percent level. Source: Endline household survey
predictive power of the model. This is done by estimating a logit regression for the decision to become a client of Al Amana, using the set of baseline variables obtained from the initial short survey (which we collected at baseline well before the interven-tion took place, and which we have for the entire populainterven-tion) and village dummies. This model is estimated on the whole set of households in treatment villages that were interviewed at endline. The results are presented in online Appendix Table B8. Several characteristics are individually significant in the regression, and they are also strongly significant taken together. The predicted probability to borrow ranges from almost 0 to 0.80. It has an interquartile range of 20 percentage points, and a 37 percentage point difference between quantiles of order 90 percent and 10 percent. This allows us to identify reasonably well the heterogeneity related to the propensity to borrow.
Panel C of Table 8 presents estimation results of the main equation with the two interaction terms (high and low propensity sample).13 Column 1 presents the results
on the probability to borrow. Households in the high probability sample are 36 per-centage points more likely to have taken a loan from Al Amana than their control counterparts. In the low-probability sample, the difference between treatment and control households is statistically different than 0 but very small (less than 2 percent-age points). A caveat of our analysis is that a significant part of the low-probability sample comes from villages where there is very little or no access to credit. Thus, the estimates on the low-probability sample capture the effect of credit availability in areas where microcredit was offered but where there is no demand and a combi-nation of credit availability and spillover (from borrowers to non borrowers) effects in villages where some households took loans.
Columns 2 to 9 present the results for the key outcome variables individually. For most outcomes, estimated values for the coefficient associated to the interaction between treatment and the low-probability sample are insignificant and generally fairly small.
An interesting exception to the finding that externalities do not seem to be import-ant arises from the variables on time worked by households outside the home and the income derived from it: there we see highly significant negative impacts on hours worked outside even among low-probability households. This is surprising, as prima facie we might have expected the externalities to run in the other direction (if those who borrow free up opportunities, leading to more jobs or increases in wages). It could be that the ability to borrow (and thus to smooth out shocks if needed) reduces the need for income diversification.
C. Local Average Treatment Effect
Motivated by the finding that externalities (except for labor supply) do not seem to be very important, we present suggestive estimates of the impact of microcredit take-up on outcomes, using a dummy for residing in a treatment village as an instrument for
13 This equation is run without weights, to leverage to the maximum extent the power given to us by our design,
which made sure we had enough people in the sample with relatively high probability to borrow. Under the null, OLS is BLUE and the regressions should not be weighted. With weights, we still reject the hypothesis of no exter-nalities, but the results are noisier.