This item was submitted to Loughborough’s Institutional Repository
(
https://dspace.lboro.ac.uk/
) by the author and is made available under the
following Creative Commons Licence conditions.
For the full text of this licence, please go to:
Cost-sensitive decision tree ensembles for effective
imbalanced classification
Bartosz Krawczyka,∗
, Micha l Wo´zniaka, Gerald Schaeferb
a
Department of Systems and Computer Networks, Wroclaw University of Technology, Poland
b
Department of Computer Science, Loughborough University, Loughborough, U.K.
Abstract
Real-life datasets are often imbalanced, that is, there are significantly more training samples available for some classes than for others, and consequently the conventional aim of reducing overall classification accuracy is not appropri-ate when dealing with such problems. Various approaches have been introduced in the literature to deal with imbalanced datasets, and are typically based on oversampling, undersampling or cost-sensitive classification. In this paper, we introduce an effective ensemble of cost-sensitive decision trees for imbalanced classification. Base classifiers are constructed according to a given cost matrix, but are trained on random feature subspaces to ensure sufficient diversity of the ensemble members. We employ an evolutionary algorithm for simultane-ous classifier selection and assignment of committee member weights for the fusion process. Our proposed algorithm is evaluated on a variety of benchmark datasets, and is confirmed to lead to improved recognition of the minority class, to be capable of outperforming other state-of-the-art algorithms, and hence to represent a useful and effective approach for dealing with imbalanced datasets. Keywords: machine learning, multiple classifier system, ensemble classifier, imbalanced classification, cost-sensitive classification, decision tree, classifier selection, evolutionary algorithms, classifier fusion
1. Introduction
Numerous approaches have been introduced in the literature aiming to pro-vide effective and efficient classification systems [19]. However, it is also well known that according to theno free lunch theorythere is no universal classifier that performs best for all decision problems [41].
∗Corresponding author
Email addresses: [email protected] (Bartosz Krawczyk),
[email protected](Micha l Wo´zniak),[email protected] (Gerald Schaefer)
Canonical machine learning methods are based on the idea of selecting the single best classifier from a set of available models. However, making a decision based on solely a single classifier also discards the possibility that other models may also offer a valuable contribution. Methods that are trying to exploit the strengths of several models are known as multiple classifier systems (MCSs) or classifier ensembles [29], and are one of the most promising research directions in the current field of machine learning and pattern recognition.
There are typically two main challenges when constructing MCSs: how to select classifiers to form an ensemble, and how to fuse the individual decisions of the base classifiers into a single decision. Poor selection may undermine the whole process of designing MCSs, while a good strategy for building an ensem-ble should guarantee an improvement in its diversity. This can be achieved by using different partitions of the dataset or by generating a number of datasets through data splitting, a cross-validated committee, bagging, or boosting [29], so that the generated base classifiers, since trained on different inputs, would be complementary. Among the employed approaches, constructing random sub-spaces [17] is one of the most generic ones, and typically works well with various types of classifiers.
Classifier fusion methods can be categorised into approaches that are based on classifier labels and those that utilise discriminant analysis. The former includes various voting algorithms [4; 46]. While (majority) voting schemes are among the most popular fusion methods, often better results are obtained by approaches that consider the importance of decisions coming from particular committee members [28; 39].
For methods based on discriminant analysis, the main form of discriminants isa posterior probability, although outputs of neural networks or other functions whose values are used to establish the decision of the classifier (so called sup-port functions) can also be considered. While simple aggregation methods (like minimum, maximum, product, mean) can be used, they are typically subject to rather restrictive conditions [12] which limit their practical use. Better results can be achieved by designing fusion models based on a training procedure to arrive at so-called trained fusers [44].
The underlying class distribution can play a crucial role in the derivation of effective classifiers. In many cases the distribution is roughly equal among all the classes but this does not hold for every application. When one of the classes (referred to as the majority class) significantly outnumbers the remaining (mi-nority) class(es), we deal with a problem known as imbalanced classification [16] which occurs in a variety of domains including anomaly detection [20], fault di-agnosis [47], medical data analysis [23], drug design [22], SPAM detection [48] and face recognition [32]. While the performance of classification algorithms is typically evaluated using predictive accuracy, clearly this is not appropriate when the data is imbalanced as it would favour the correct identification of majority class samples.
In this paper, we propose, based on our earlier work [25; 27], a classifier ensemble design algorithm which is built on the basis of a cost matrix for im-proved minority class prediction. As base classifiers we utilise cost-sensitive
decision trees due to their susceptibility to improvement via the ensemble ap-proach, while we employ an evolutionary algorithm to simultaneously perform classifier selection and fusion.
Instead of using a fixed cost matrix we derive its parameters via ROC anal-ysis. To gain a deeper insight into the influence of cost matrices on the minority class recognition, we investigate several imbalanced datasets with different levels of imbalance to identify a useful pattern for setting the cost matrix.
The main contributions of this paper are as follows:
• A new ensemble pruning method based on the combination of decision trees trained on different sets of features.
• Use of an evolutionary algorithm for simultaneous classifier selection and fusion to promote the best base classifiers and boost the recognition rate of the minority class.
• In-depth analysis of the influence of the cost matrix parameters and data imbalance ratio on the performance of the proposed ensemble based on ROC analysis.
The remainder of the paper is organised as follows. In Section 2 we present the pattern recognition background that our approach is based on, while Sec-tion 3 discusses the problem of imbalanced classificaSec-tion. Our new algorithm is introduced in detail in Section 4. Experimental results are reported and discussed in Section 5, while Section 6 concludes the paper.
2. Model of pattern recognition task
The aim of pattern recognition is to assign a given sample to one of a number of pre-defined categories. A pattern recognition algorithm Ψ thus maps the feature spaceX to the set of class labels M
Ψ :X→M. (1)
This mapping is typically established on the basis of examples from a training set which contains learning examples, i.e. observations of features together with their correct classifications. Although it is important for the performance of a classifier, we do not focus on feature selection in this paper, but assume that the set of features is given by an expert or chosen by an appropriate feature selection method [11].
Let’s assume that we have n classifiers Ψ(1), Ψ(2), ..., Ψ(n). For a given
object x, each of them makes a decision regarding class i ∈M = {1, ..., M}. The combined classifier ¯Ψ then makes a decision according to a weighted voting rule ¯ ΨΨ(1)(x), Ψ(2)(x), ..., Ψ(n)(x)= arg max j∈M n X l=1 δj, Ψ(l)(x)w(l), (2)
where
δ(j, i) =
0 if i6=j
1 if i=j , (3)
andw(l)is the weight assigned to thel-th classifier. The weights used in Eq. (2)
play a key-role in establishing the quality of ¯Ψ [42]. In this paper, we construct an ensemble with decision tree classifiers as base classifiers. Therefore, it is not possible to use support functions [45] and we consequently revert to a weighted voting approach which has been shown to behave better than canonical voting methods [43].
3. Imbalanced classification
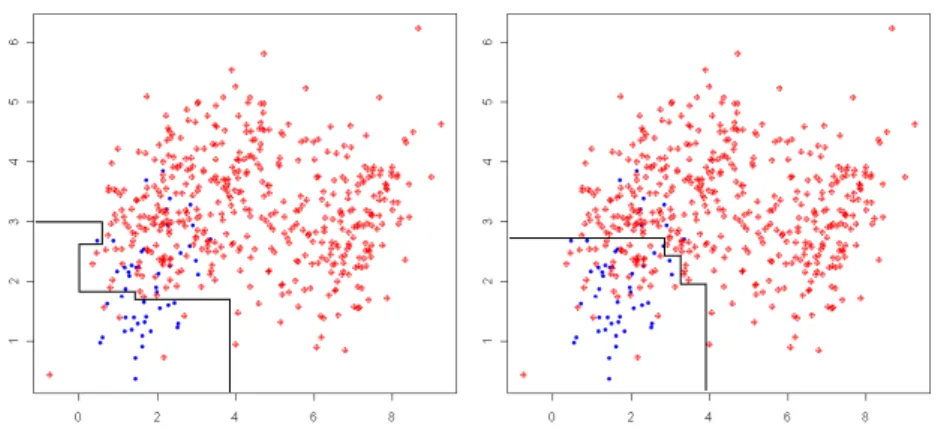
The performance and quality of machine learning algorithms is convention-ally evaluated using predictive accuracy. However, this is not appropriate when the data under consideration is strongly imbalanced, since the decision boundary may be strongly biased towards the majority class, leading to poor recognition of the minority class as illustrated in Fig. 1.
Figure 1: Example of bias towards the majority class in linear classification of an imbalanced problem. The established decision boundary (line) would give poor prediction for minority class samples.
Class imbalance not only makes the learning task more complex [38], it is usually accompanied also by other difficulties such as:
• Small sample size: In many cases the number of minority class samples is insufficient to properly train a classifier, hence resulting in poor gen-eralisation and possibly leading to overfitting. Even though it has been shown, that when the number of minority samples is sufficient the uneven class distribution itself does not cause a significant drop in recognition rate [10], often this is not possible for real-life classification problems.
• Small disjuncts: This problem is connected to the previous one, as it may happen that the minority class is represented by a number of subcon-cepts, meaning that its objects form several spread “chunks” of data [34].
This leads to difficulties due to the lack of uniform structure in the mi-nority class and low sample count in each of the subconcepts.
• Class overlapping: When discriminative rules are constructed in such a way as to minimise the number of misclassified instances, this may lead to poor performance for objects in the overlap area to the minority class [14]. Techniques that address the problems associated with imbalanced datasets can in general be divided into three groups [33]:
• Data level approaches work, in a pre-processing stage, directly on the data space, and attempt to re-balance the class distributions. They are independent of the actual classification stage, and hence can be employed flexibly. The most popular approaches employ an oversampling strategy that introduces artificial objects into the data space. The best known tech-nique here is SMOTE [7], although more recently, improved alternatives such as ADASYN [15] (which also considers which objects are the most difficult to learn) or RAMO [9] (which uses a probabilistically directed approach) have been proposed. Oversampling methods however may also lead to other problems, such as class distribution shift when running too many iterations (since new artificial objects are being created on the basis of previously introduced samples).
• Classifier level approaches try to adapt existing algorithms to the prob-lem of imbalanced datasets and bias them towards favouring the minority class. Here, some more in-depth knowledge about the nature of the used predictors and factors that cause its failure in minority class recognition is required. One possibility is to perform one-class classification, which can learn the concepts of the minority class by treating majority objects as outliers [26].
• Cost-sensitive approaches can use both data modifications (by adding a specified cost to the misclassification) and modifications of the learning al-gorithms (to adapt them to the possibility of misclassification). A higher misclassification cost is assigned for minority class objects and classifica-tion performed so as to reduce the overall learning cost. Costs are often specified in form of cost matrices such as the one presented in Table 1. The main disadvantage of cost-sensitive methods is the lack of knowledge on how to set the actual values in the cost matrix, since in most cases this is not known from the data nor given by an expert.
MCSs have also been adapted to account for possible class imbalances [40], and typically combine an MCS algorithm with one of the above techniques. Ex-amples of a combination of oversampling and classifier ensembles are SMOTE-Bagging [40] and SMOTEBoost [8] which introduce new objects into each of the bags / boosting iterations separately. IIvotes [5] is another interesting ap-proach which fuses a rule-based ensemble with a SPIDER pre-processing scheme
Table 1: Example of a cost matrix for binary problems. C(1,0) stands for cost associated with a minority class object assigned to the majority class, while C(0,1) represents the opposite misclassification scenario.X X X X X X X X XX true predicted
majority class minority class
majority class C(0,0) C(0,1)
minority class C(1,0) C(1,1)
so as to be more robust with respect to atypical data distributions in minor-ity classes and to automatically find an optimal number of bags. A fusion of MCSs and one-class classifiers constructed with respect to maintaining their diversity has been shown to be effective for imbalanced classification [21]. Cost-sensitive MCSs are mostly based on adjusting the object weights in a boosting schema [37], although schemes based on cost-sensitive decision trees have also been exploited [24]. EasyEnsemble [31] uses bagging as the main concept, but since for each of the bags AdaBoost is used as the base model, it can be viewed as an ensemble of ensembles.
4. Proposed cost-sensitive MCS
The problem we are addressing in this paper is how to select and combine individual classifiers of an ensemble with respect to misclassification cost. Our aim is to create an ensemble with minimal classification error P within the cost bounds of a cost matrix C. For this purpose, we require a pool of base classifiers at our disposal. For this, we propose a method to create a start-up pool of classifiers for further evaluation using an evolutionary approach.
As base classifier we have chosen a cost-sensitive classification tree, that has its roots in the idea of the EG2 algorithm [35] whose decision tree induction is based on the misclassification cost rate proposed in [6]. A local sequential search at each node is performed [30]. This way, we can boost the recognition rate of the majority class by assigning a greater cost to a situation when a minority object is misclassified. An example of the differences in outputs of canonical and cost-sensitive decision trees for an imbalanced problem is illustrated in Fig. 2.
To create a representative pool of classifiers, we use a random subspace approach [17], which randomly divides the feature space into several subspaces and trains individual classifiers in each of them. This ensures that the pool is diverse and contains heterogeneous rather than homogenous classifiers.
In order to select individual classifiers for the ensemble, we employ an evo-lutionary algorithm (EA). An individual in the EA population represents a classifier ensemble
Ch= [W], (4)
where componentW represents the weights assigned to each of the base classi-fiers
Figure 2: An example of improvement of minority class recognition using a cost-sensitive decision tree for a toy problem (the same data as in Fig. 1).
and is a real-valued vector with values in [0;1]. When a classifier is not se-lected in a particular individual its weight is automatically set to 0. In earlier work [27], we have used a maximal size of the ensemble, which required the number of ensemble members as a parameter. Our proposed algorithm lifts this restriction. The chromosome always have size equal toL, but when the weight assigned to thel-th classifier drops to 0, the classifier takes no part in the final decision (hence by this we apply the classifier selection procedure). Therefore, the algorithm automatically adjusts the size of the committee.
Our proposed algorithm is given, in pseudo-code form, in Algorithm 1. The control parameters of the EA are as follows:
• Nc - the upper limit of algorithm cycles,
• Np - the population quantity,
• β - the mutation probability,
• γ - the crossover probability,
• ∆m - the mutation range factor,
• V - the upper limit of algorithm iterations without quality improvement. In the following, we detail each of the steps of the algorithm:
Population generation: We generate a set of members in such a way that all constraints and implications resulting from the model’s logic and the input parameter values are preserved.
Population assessment: At the beginning, for each member of the popula-tion, the value of the fitness function is calculated according to Eq. (2).
Choosing elite members: Members with the highest fitness values are taken from the population and carried over to the descendant population without mutation, crossover or selection.
Algorithm 1Evolutionary ensemble algorithm.
Input:
U→set of classifiers
Output:
Q→ensemble after pruning
W→set of weights assigned to classifiers
P= 1.0
B= empty
Create initial population Select individuals for evaluation
for allselected individualsdo if fitness(W)< P then
Replace the overall ensemble error with the lower one Replace the best solution with the current one
end if end for
whiletermination conditions not satisfieddo
Select pairs for crossover from best-ranked individuals Apply crossover operator
Apply mutation operator Select new individuals
for allselected individualsdo if fitness(W)< P then
Replace the overall ensemble error with the lower one Replace the best solution with the current one
end if end for
Create new population
Mutation: The mutation operator changes a selected (one at a time) member of the population by applying some random changes to its chromosome. The chromosome is altered with a probability that is changed during the optimisation progress. In the early phase of the optimisation, a special emphasis is put on searching for possibly best areas of the weights values, while later on attention is shifted to exploring the most promising area for optimal settings. Mutation involves adding a vector of numbers randomly generated according to a normal density distribution (with mean of 0 and standard deviation of ∆m).
Crossover: The crossover operator generates one offspring member from two parents. Offsprings are obtained according to the two-point rule.
Selection of new population: A selection of individuals from the population is formed by merging the descendant population and a set of individuals created by mutation and crossover. The probability of selectionPsof a particular individual is proportional to the value of its fitness. A tournament selection scheme is employed [3].
The weighted voting rule is used to combine the base classifiers following Eq. (2). The ensemble classification error, calculated on the training set, serves as fitness function. Termination conditions can be adjusted; we use the num-ber of iterations without result improvement. The numnum-ber of classifiers in the committee after the pruning procedure is automatically adjusted by the EA.
5. Experimental investigations
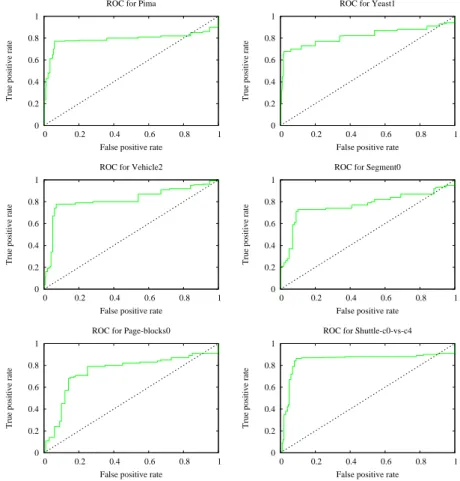
In this section, we present a thorough experimental investigation to examine the behaviour of our proposed cost-sensitive ensemble. Besides a comparison between our new algorithm and several state-of-the-art methods, we also exam-ine the influence of the cost matrix setting on the overall classification accuracy. For this purpose, we apply ROC analysis [13] where as the cut-off points we use the parameter assigned as misclassification cost of the minority class, de-noted as Cminority. This way we may search for correlations between the cost parameter and the overall classification accuracy. The employed cost matrix is given in Table 2. We investigate the performance of our algorithm with three different imbalance ratios to see if there is any correlation between the object distribution disproportion and the optimal value ofCminority in Table 2.
Table 2: Cost matrix used for the experiments.
X X X X X X X X XX true predicted
majority class minority class
majority class 0 1
minority class Cminority 0
5.1. Datasets
For our experiments, we have selected six benchmark binary imbalanced datasets taken from the KEEL Repository [1]. Details of the employed datasets are given in Table 3.
Table 3: Datasets used in the experiments.
dataset # objects # features
Pima 768 8 Yeast1 1484 8 Vehicle2 846 18 Segment0 2308 19 Page-blocks0 5472 10 Shuttle-c0-vs-c4 1829 9 5.2. Experimental setup
A total of 50 cost-sensitive decision trees classifiers were trained using the random subspace approach, consisting of 40% of the original feature space.
As the ensemble pruning procedure is based on an EA, the employed pa-rameters may have a crucial impact on its quality. Therefore, to establish the values of optimisation parameters we ran a grid search procedure [36] over the following intervals of parameters values:
• Nc∈[100,2000], with step-size 100; • Np∈[10,200], with step-size 5; • β∈[0.1,0.9] with step-size 0.1; • γ∈[0.1,0.9] with step-size 0.1; • ∆m∈[0.1,0.9] with step-size 0.1; • V ∈[10,100] with step-size 10.
The intervals for the examined parameter values were dictated by our pre-vious experience with evolutionary-based ensembles [18; 24; 27]. The values, which returned the best final results for the weights optimisation, were as fol-lows: Nc = 1000,Np= 50,β = 0.7,γ= 0.3, ∆m= 0.2, andV = 20.
We compared our method to SMOTEBagging, SMOTEBoost, IIvotes and EasyEnsemble. In addition, we implemented a single cost-sensitive tree, and the cost-sensitive ensemble from our previous work [27], in which the classifiers weights were set according to their individual accuracies and with a maximum ensemble size of 5. Both of these used the same cost matrices as derived for the proposed committee.
A combined 5x2 CV F test [2] was carried out to assess the statistical sig-nificance of the obtained results with classifier sensitivity as the tested value.
Since we would like to examine the behaviour of our proposed method at different levels of imbalance, we derived three new datasets using a random undersampling method so that each of the six datasets were examined at levels of imbalance ratios of 1:10, 1:25, and 1:50.
5.3. Experimental results
In the following, we present the classification results for the three imbalance ratios and the results of the ROC analysis for each of the benchmarks from which we derive theCminority parameter used then in the classifier comparison step. The tested values were taken from the range [5;100] with a stepsize of 5.
The search for the optimal cut-off parameter was performed by measuring the distance from the point on the ROC curve represented by this parameter to the point representing the optimal performance (i.e., 100% sensitivity and specificity - the left top corner of the ROC plot). The cut-off point with the minimal distance was selected as the optimal setting for the cost matrix. 5.3.1. Imbalance ratio 1:10
The ROC plots for an imbalance ration of 1:10 are given in Fig. 3. From the ROC analysis we can derive the best value of Cminority for each of the benchmarks; the derived values are listed in Table 4.
0 0.2 0.4 0.6 0.8 1 0 0.2 0.4 0.6 0.8 1
True positive rate
False positive rate ROC for Pima
0 0.2 0.4 0.6 0.8 1 0 0.2 0.4 0.6 0.8 1
True positive rate
False positive rate ROC for Yeast1
0 0.2 0.4 0.6 0.8 1 0 0.2 0.4 0.6 0.8 1
True positive rate
False positive rate ROC for Vehicle2
0 0.2 0.4 0.6 0.8 1 0 0.2 0.4 0.6 0.8 1
True positive rate
False positive rate ROC for Segment0
0 0.2 0.4 0.6 0.8 1 0 0.2 0.4 0.6 0.8 1
True positive rate
False positive rate ROC for Page-blocks0
0 0.2 0.4 0.6 0.8 1 0 0.2 0.4 0.6 0.8 1
True positive rate
False positive rate ROC for Shuttle-c0-vs-c4
Table 4: OptimalCminorityvalues derived from the ROC analysis (imbalance ratio 1:10). Name Cminority Pima 20 Yeast 25 Vehicle 30 Segment 20 Page-blocks 25 Shuttle 20
Table 5: Classification results on the benchmark datasets with imbalance ratio 1:10. Every sec-ond line indicates the methods compared to the examined one was found to be statistically sig-nificantly better (ST=Single cost-sensitive tree, WE=MCS from [27], SBg=SMOTEBagging, SBst=SMOTEBoost, IIV=IIvotes, EE=EasyEnsemble, PE=Proposed, ALL means all other methods).
Dataset Single CSTree [30] MCS from [27] SMOTEBagging [8] SMOTEBoost [8] IIvotes [5] EasyEnsemble [31] Proposed SE SP SE SP SE SP SE SP SE SP SE SP SE SP Pima 65.21 87.12 76.35 94.21 84.01 96.12 84.01 96.12 82.43 95.13 81.87 98.45 85.23 97.10
- ST ST,WE,IIV,EE ST,WE,IIV,EE ST,WE,EE ST,WE ALL
Yeast 59.23 93.11 67.21 96.42 69.00 98.32 70.25 97.23 69.65 95.32 68.23 96.34 70.25 97.23
- ST ST,WE,IIV,EE ST,WE,IIV,EE ST,WE ST,WE ST,WE,IIV,EE
Vehicle 78.87 84.86 82.11 86.75 85.46 87.65 89.80 90.04 90.12 89.32 87.10 87.67 88.23 89.23 - ST ST,WE ALL ST,WE,SBg,EE,PE ST,WE ST,WE,SBg,EE
Segment 67.21 78.35 70.01 83.11 71.09 82.32 73.40 83.73 73.54 82.89 74.02 083.73 75.24 81.94 - ST ST,WE ST,WE,SBg ST,WE,SBg SBg,ST,WE ALL
Page-blocks 73.22 79.89 75.25 79.59 77.43 77.89 77.98 79.34 81.87 79.00 80.26 82.56 82.95 80.23 - ST ST,WE ST,WE,SBg ST,WE,SBg,SBst ST,WE,SBg,SBst ALL
Shuttle 80.87 86.64 84.24 89.68 87.56 90.23 89.54 90.23 88.34 87.57 89.31 89.23 92.31 89.23 - ST ST,WE ST,WE,SBg ST,WE,SBg ST,WE,SBg ALL
The values of misclassification costs from Table 4 are then used for the pro-posed ensemble comparison with other methods. Results in terms of sensitivity (SE - predictive accuracy on the minority class) and specificity (SP - predictive accuracy on the majority class) are given in Table 5.
5.3.2. Imbalance ratio 1:25
For the experiments with an imbalance ratio of 1:25, the ROC plots are given in Fig. 4, the derivedCminorityvalues in Table 6, and the resulting classification results in Table 7.
Table 6: OptimalCminorityvalues derived from the ROC analysis (imbalance ratio 1:25).
Name Cminority Pima 55 Yeast 40 Vehicle 50 Segment 45 Page-blocks 50 Shuttle 55
0 0.2 0.4 0.6 0.8 1 0 0.2 0.4 0.6 0.8 1
True positive rate
False positive rate ROC for Pima
0 0.2 0.4 0.6 0.8 1 0 0.2 0.4 0.6 0.8 1
True positive rate
False positive rate ROC for Yeast1
0 0.2 0.4 0.6 0.8 1 0 0.2 0.4 0.6 0.8 1
True positive rate
False positive rate ROC for Vehicle2
0 0.2 0.4 0.6 0.8 1 0 0.2 0.4 0.6 0.8 1
True positive rate
False positive rate ROC for Segment0
0 0.2 0.4 0.6 0.8 1 0 0.2 0.4 0.6 0.8 1
True positive rate
False positive rate ROC for Page-blocks0
0 0.2 0.4 0.6 0.8 1 0 0.2 0.4 0.6 0.8 1
True positive rate
False positive rate ROC for Shuttle-c0-vs-c4
Figure 4: ROC plots for the six benchmark datasets with imbalance ratio 1:25.
5.3.3. Imbalance ratio 1:50
For the experiments with an imbalance ratio of 1:50, the ROC plots are given in Fig. 5, the derivedCminorityvalues in Table 8, and the resulting classification results in Table 9.
5.4. Discussion
Let us first discuss the cost parameter properties. Interestingly, for all three levels of imbalance a similar pattern emerges with the optimal cost tending to oscillate around twice the reciprocal imbalance ratio (e.g., for an imbalance ratio of 1:25, the optimalCminority value was around 50). Deviations from this are surprisingly small, so that this trend was found to be stable and to hold for all datasets. This leads to the conclusion that for the proposed method, the optimal results are given when the cost is correlated to the imbalance ratio with the associated misclassification cost about twice the ratio. This is an interesting
Table 7: Classification results on the benchmark datasets with imbalance ratio 1:25, given in the same fashion as those of Table 5.
Dataset Single CSTree [30] MCS from [27] SMOTEBagging [8] SMOTEBoost [8] IIvotes [5] EasyEnsemble [31] Proposed SE SP SE SP SE SP SE SP SE SP SE SP SE SP Pima 67.34 88.24 72.67 90.11 75.21 92.32 75.43 94.35 74.32 92.33 73.67 93.94 77.13 94.50
- ST ST,WE,IIV,EE ST,WE,IIV,EE ST,WE,EE ST,WE ALL
Yeast 54.34 92.67 60.46 97.45 63.21 97.82 66.31 97.82 66.31 97.82 63.21 97.82 67.78 98.11 - ST ST,WE ST,WE,SBg,EE ST,WE,SBg,EE ST,WE ALL
Vehicle 69.56 91.65 72.11 93.04 74.12 92.25 76.98 94.34 77.02 93.89 78.03 92.95 77.67 93.45 - ST ST,WE ST,WE,SBg ST,WE,SBg ST,WE,SBg ST,WE,SBg
Segment 65.64 87.65 69.03 87.11 70.12 88.54 72.89 90.11 71.15 91.06 72.89 90.11 72.89 90.11 - ST ST,WE ST,WE,SBg,IIV ST,WE,SBg ST,WE,SBg,IIV ST,WE,SBg,IIV
Page-blocks 69.77 79.08 72.98 82.35 71.25 83.65 73.89 82.97 59.98 80.21 68.12 80.23 70.76 81.23 - ST ST,WE ST,WE,SBg,PE ST,WE,SBg,PE ALL ST,WE Shuttle 77.47 86.35 82.04 88.98 83.10 90.58 85.02 91.89 84.90 90.66 85.02 91.89 86.28 91.05
- ST ST,WE ST,WE,SBg ST,WE,SBg ST,WE,SBg ALL
0 0.2 0.4 0.6 0.8 1 0 0.2 0.4 0.6 0.8 1
True positive rate
False positive rate ROC for Pima
0 0.2 0.4 0.6 0.8 1 0 0.2 0.4 0.6 0.8 1
True positive rate
False positive rate ROC for Yeast1
0 0.2 0.4 0.6 0.8 1 0 0.2 0.4 0.6 0.8 1
True positive rate
False positive rate ROC for Vehicle2
0 0.2 0.4 0.6 0.8 1 0 0.2 0.4 0.6 0.8 1
True positive rate
False positive rate ROC for Segment0
0 0.2 0.4 0.6 0.8 1 0 0.2 0.4 0.6 0.8 1
True positive rate
False positive rate ROC for Page-blocks0
0 0.2 0.4 0.6 0.8 1 0 0.2 0.4 0.6 0.8 1
True positive rate
False positive rate ROC for Shuttle-c0-vs-c4
Figure 5: ROC plots for the six benchmark datasets with imbalance ratio 1:50.
finding since setting an appropriate cost matrix is a difficult task and in most cases there is no direct information on how to do it [33].
Table 8: OptimalCminorityvalues derived from the ROC analysis (imbalance ratio 1:50). Name Cminority Pima 90 Yeast 95 Vehicle 100 Segment 95 Page-blocks 100 Shuttle 100
Table 9: Classification results for benchmark datasets with imbalance ratio 1:50, given in the same fashion as those of Table 5.
Dataset Single CSTree [30] MCS from [27] SMOTEBagging [8] SMOTEBoost [8] IIvotes [5] EasyEnsemble [31] Proposed SE SP SE SP SE SP SE SP SE SP SE SP SE SP Pima 59.56 90.43 66.45 89.43 70.02 90.11 71.43 92.67 70.95 92.33 72.00 93.05 71.43 92.67
- ST ST,WE ST,WE,SBg ST,WE,SBg ST,WE,SBg ST,WE,SBg
Yeast 53.73 93.16 55.47 96.11 58.56 95.32 59.76 94.33 59.54 96.32 58.99 96.21 60.34 96.22 - ST ST,WE ST,WE,SBg ST,WE,SBg ST,WE,SBg ALL
Vehicle 58.72 88.56 62.54 88.86 64.49 89.75 66.12 92.43 66.48 89.76 67.00 88.86 67.37 90.98 - ST ST,WE ST,WE,SBg ST,WE,SBg ST,WE,SBg ST,WE,SBg
Segment 59.45 90.64 65.05 93.08 68.43 92.05 68.97 94.15 68.52 94.11 69.68 93.86 70.02 93.43 - ST ST,WE ST,WE,SBg ST,WE,SBg ST,WE,SBg ST,WE,SBg,IIV
Page-blocks 51.22 85.29 55.22 86.03 58.98 57.00 86.37 61.78 89.09 61.00 88.20 59.19 88.04 87.64 - ST ST,WE ST,WE,SBg,EE,PE ST,WE,SBg,EE,PE ST,WE,SBg,PE ST,WE Shuttle 64.48 89.51 71.06 90.33 72.13 91.21 73.16 93.97 73.94 92.56 74.17 94.03 75.98 92.98
- ST ST,WE ST,WE,SBg ST,WE,SBg ST,WE,SBg,IIV ALL
As for the comparison with the other four state-of-the-art ensembles, the proposed method displays a quite satisfactory performance. For a small imbal-ance ratio it outperforms in most cases the other methods.
For more extreme imbalance ratios, the performance of the tested methods tended to converge to similar results. Still, for an imbalance ratio of 1:50, our proposed method was statistically better on two of the datasets, while on three others there was no significant difference to competing methods. The achieved results thus indicate the high quality of our proposed approach as even in cases of highly imbalanced datasets it still delivers good results, comparable, or even better than, other well-known ensembles.
All ensemble methods outperform significantly a single cost-sensitive tree and the previous simpler version of the cost-sensitive ensemble. This is due to the high levels of imbalance in the tested dataset; to cope with such a difficulty more sophisticated methods are required.
6. Conclusions
Imbalanced classification constitutes a major challenge in machine learning. In this paper, we have introduced a novel ensemble dedicated to imbalanced classification problems. Combining cost-sensitive decision trees with random subspace based feature space partitioning results in the creation of a pool of in-dividual classifiers capable of improved recognition of the minority class. From
the classifier pool, complementary classifiers are selected with the aid of an evo-lutionary algorithm while at the same time, the assignment of classifier weights, used in the fusion step, is treated as an optimisation problem and also embed-ded into the evolutionary approach. Consequently, simultaneous selection and weighted fusion is performed to exploit the individual strengths of classifiers available at hand.
One of the major issues in cost-sensitive classification is the derivation of cost-matrices. In our approach, we addressed this based on ROC analysis, and showed that there exists a direct correlation between the dataset imbalance ratio and the optimal cost matrix settings.
We evaluated our method on six binary imbalanced benchmarks and with three different levels of data imbalance. Our results conclusively show that our proposed method provides an effective tool for the classification of imbalanced datasets, often outperforming other state-of-the-art ensembles.
7. Acknowledgments
This work is supported by the Polish National Science Centre under grant N N519 650440 (2011-2014).
References
[1] J. Alcala-Fdez, A. Ferndedez, J. Luengo, J. Derrac, S. Garcia, L. Sanchez, and F. Herrera. Keel data-mining software tool: Data set repository, in-tegration of algorithms and experimental analysis framework. Journal of Multiple-Valued Logic and Soft Computing, 17(2-3):255–287, 2011.
[2] E Alpaydin. Combined 5 x 2 cv f test for comparing supervised classification learning algorithms. Neural Computation, 11(8):1885–1892, 1999.
[3] Daniel Ashlock.Evolutionary Computation for Modeling and Optimization. Springer, New York, USA, 1st edition, 2006.
[4] B. Biggio, G. Fumera, and F. Roli. Bayesian analysis of linear combiners. In Proceedings of the 7th international conference on Multiple classifier systems, MCS’07, pages 292–301, Berlin, Heidelberg, 2007. Springer-Verlag. [5] J. Blaszczynski, M. Deckert, J. Stefanowski, and S. Wilk. Integrating selec-tive pre-processing of imbalanced data with ivotes ensemble. volume 6086 LNAI of Lecture Notes in Computer Science, pages 148–157. 2010. [6] L. Breiman, J. H. Friedman, R. A. Olshen, and C. J. Stone. Classification
and regression trees. Chapman and Hall, 1984.
[7] N. V. Chawla, K. W. Bowyer, L. O. Hall, and W. P. Kegelmeyer. Smote: Synthetic minority over-sampling technique. Journal of Artificial Intelli-gence Research, 16:321–357, 2002.
[8] N. V. Chawla, A. Lazarevic, L. O. Hall, and K. W. Bowyer. Smoteboost: Improving prediction of the minority class in boosting. InLecture Notes in Artificial Intelligence, volume 2838, pages 107–119, 2003.
[9] S. Chen, H. He, and E. A. Garcia. Ramoboost: Ranked minority oversam-pling in boosting. IEEE Transactions on Neural Networks, 21(10):1624– 1642, 2010.
[10] X. Chen and M. Wasikowski. Fast: A roc-based feature selection metric for small samples and imbalanced data classification problems. InProceedings of the ACM SIGKDD International Conference on Knowledge Discovery and Data Mining, pages 124–132, 2008.
[11] R. O. Duda, P. E. Hart, and D. G. Stork. Pattern Classification. Wiley, New York, 2. edition, 2001.
[12] R.P.W. Duin. The combining classifier: to train or not to train? In Pattern Recognition, 2002. Proceedings. 16th International Conference on, volume 2, pages 765 – 770 vol.2, 2002.
[13] T. Fawcett. An introduction to roc analysis. Pattern Recognition Letters, 27(8):861–874, 2006.
[14] V. Garcia, R. A. Mollineda, and J. S. Sanchez. On the k-nn performance in a challenging scenario of imbalance and overlapping. Pattern Analysis and Applications, 11(3-4):269–280, 2008.
[15] H. He, Y. Bai, E. A. Garcia, and S. Li. Adasyn: Adaptive synthetic sam-pling approach for imbalanced learning. InProceedings of the International Joint Conference on Neural Networks, pages 1322–1328, 2008.
[16] H. He and E. A. Garcia. Learning from imbalanced data. IEEE Transac-tions on Knowledge and Data Engineering, 21(9):1263–1284, 2009.
[17] T. K. Ho. The random subspace method for constructing decision forests. IEEE Trans. Pattern Anal. Mach. Intell., 20:832–844, August 1998. [18] K. Jackowski and M. Wo´zniak. Algorithm of designing compound
recogni-tion system on the basis of combining classifiers with simultaneous splitting feature space into competence areas. Pattern Analysis and Applications, 12(4):415–425, 2009.
[19] A.K. Jain, R.P.W. Duin, and Jianchang Mao. Statistical pattern recog-nition: a review. IEEE Transactions on Pattern Analysis and Machine Intelligence, 22(1):4 –37, jan 2000.
[20] W. Khreich, E. Granger, A. Miri, and R. Sabourin. Iterative boolean combination of classifiers in the roc space: An application to anomaly detection with hmms. Pattern Recognition, 43(8):2732–2752, 2010.
[21] B. Krawczyk. Diversity in ensembles for one-class classification. In Mykola Pechenizkiy and Marek Wojciechowski, editors, New Trends in Databases and Information Systems, volume 185 of Advances in Intelligent Systems and Computing, pages 119–129. Springer Berlin Heidelberg, 2012.
[22] B. Krawczyk. Pattern recognition approach to classifying cyp 2c19 isoform. Central European Journal of Medicine, 7(1):38–44, 2012.
[23] B. Krawczyk, L. Jelen, A. Krzyzak, and T. Fevens. Oversampling meth-ods for classification of imbalanced breast cancer malignancy data. In Leonard Bolc, Ryszard Tadeusiewicz, Leszek Chmielewski, and Konrad Wojciechowski, editors, Computer Vision and Graphics, volume 7594 of Lecture Notes in Computer Science, pages 483–490. Springer Berlin / Hei-delberg, 2012.
[24] B. Krawczyk, G. Schaefer, and M. Wo´zniak. Breast thermogram analy-sis using a cost-sensitive multiple classifier system. In Proceedings of the IEEE-EMBS International Conference on Biomedical and Health Informat-ics (BHI 2012), pages 507–510, 2012.
[25] B. Krawczyk and M. Wo´zniak. Designing cost-sensitive ensemble - genetic approach. In Ryszard Choras, editor, Image Processing and Communica-tions Challenges 3, volume 102 of Advances in Intelligent and Soft Com-puting, pages 227–234. Springer Berlin / Heidelberg, 2011.
[26] B. Krawczyk and M. Wo´zniak. Combining diverse one-class classifiers. In Emilio Corchado, Vaclav Snasel, Ajith Abraham, Michal Wozniak, Manuel Grana, and Sung-Bae Cho, editors, Hybrid Artificial Intelligent Systems, volume 7209 ofLecture Notes in Computer Science, pages 590–601. Springer Berlin / Heidelberg, 2012.
[27] B. Krawczyk, M. Wo´zniak, and G. Schaefer. Improving minority class prediction using cost-sensitive ensembles. In16th WSC Conference on Soft Computing in Industrial Applications, 2012.
[28] L. Kuncheva, J. C. Bezdek, and R. P. W. Duin. Decision templates for multiple classifier fusion: an experimental comparison.Pattern Recognition, 34(2):299–314, 2001.
[29] L. I. Kuncheva. Combining Pattern Classifiers: Methods and Algorithms. Wiley-Interscience, 2004.
[30] C. X. Ling, Q. Yang, J. Wang, and S. Zhang. Decision trees with minimal costs. InProceedings, Twenty-First International Conference on Machine Learning, ICML 2004, pages 544–551, 2004.
[31] X. Liu, J. Wu, and Z. Zhou. Exploratory undersampling for class-imbalance learning. IEEE Transactions on Systems, Man, and Cybernetics, Part B: Cybernetics, 39(2):539–550, 2009.
[32] Y. Liu and Y. Chen. Face recognition using total margin-based adaptive fuzzy support vector machines. IEEE Transactions on Neural Networks, 18(1):178–192, 2007.
[33] V. Lopez, A. Fernandez, J. G. Moreno-Torres, and F. Herrera. Analysis of preprocessing vs. cost-sensitive learning for imbalanced classification. open problems on intrinsic data characteristics. Expert Systems with Applica-tions, 39(7):6585–6608, 2012.
[34] K. Napierala and J. Stefanowski. Identification of different types of minority class examples in imbalanced data. volume 7209 LNAI ofLecture Notes in Computer Science, pages 139–150, 2012.
[35] M. Nuenz. The use of background knowledge in decision tree induction. Machine Learning, 6:231–250, 1991.
[36] M. Srinivas and Lalit M. Patnaik. Genetic algorithms: A survey.Computer, 27:17–26, June 1994.
[37] Y. Sun, M. S. Kamel, A. K. C. Wong, and Y. Wang. Cost-sensitive boosting for classification of imbalanced data. Pattern Recognition, 40(12):3358– 3378, 2007.
[38] Y. Sun, A. K. C. Wong, and M. S. Kamel. Classification of imbalanced data: A review.International Journal of Pattern Recognition and Artificial Intelligence, 23(4):687–719, 2009.
[39] M. van Erp, L. Vuurpijl, and L. Schomaker. An overview and comparison of voting methods for pattern recognition. In Frontiers in Handwriting Recognition, 2002. Proceedings. Eighth International Workshop on, pages 195 – 200, 2002.
[40] S. Wang and X. Yao. Diversity analysis on imbalanced data sets by using ensemble models. In2009 IEEE Symposium on Computational Intelligence and Data Mining, CIDM 2009 - Proceedings, pages 324–331, 2009. [41] D. H. Wolpert. The supervised learning no-free-lunch theorems. InIn Proc.
6th Online World Conference on Soft Computing in Industrial Applications, pages 25–42, 2001.
[42] M. Wo´zniak. Experiments on linear combiners. In Ewa Pietka and Jacek Kawa, editors,Information Technologies in Biomedicine, volume 47 of Ad-vances in Soft Computing, pages 445–452. Springer Berlin / Heidelberg, 2008.
[43] M. Wo´zniak and K. Jackowski. Some remarks on chosen methods of clas-sifier fusion based on weighted voting. In Emilio Corchado, Xindong Wu, Erkki Oja, Alvaro Herrero, and Bruno Baruque, editors, Hybrid Artificial Intelligence Systems, volume 5572 ofLecture Notes in Computer Science, pages 541–548. Springer Berlin / Heidelberg, 2009.
[44] M. Wo´zniak and M. Zmyslony. Designing combining classifier with trained fuser - analytical and experimental evaluation. Neural Network World, 20(7):925–934, 2010.
[45] M. Wo´zniak and M. Zmyslony. Designing fusers on the basis of discrimi-nants - Evolutionary and neural methods of training, volume 6076 LNAI of Lecture Notes in Computer Science (including subseries Lecture Notes in Artificial Intelligence and Lecture Notes in Bioinformatics). 2010.
[46] L. Xu, A. Krzyzak, and C.Y. Suen. Methods of combining multiple classi-fiers and their applications to handwriting recognition. IEEE Transactions on Systems, Man and Cybernetics, 22(3):418 –435, may/jun 1992.
[47] Z. Yang, W. H. Tang, A. Shintemirov, and Q. H. Wu. Association rule mining-based dissolved gas analysis for fault diagnosis of power transform-ers. IEEE Transactions on Systems, Man and Cybernetics Part C: Appli-cations and Reviews, 39(6):597–610, 2009.
[48] M. Zmyslony, B. Krawczyk, and M. Wo´zniak. Combined classifiers with neural fuser for spam detection. In Alvaro Herrero, Vaclav Snasel, Ajith Abraham, Ivan Zelinka, Bruno Baruque, Hector Quintin, Jose Luis Calvo, Javier Sedano, and Emilio Corchado, editors, International Joint Confer-ence CISIS12-ICEUTE12-SOCO12 Special Sessions, volume 189 of Ad-vances in Intelligent Systems and Computing, pages 245–252. Springer Berlin Heidelberg, 2012.