Testing the influence of herding behaviour on the Johannesburg Securities Exchange
Raramai Patience Munetsi
Student Number: 3118596
A thesis submitted in full fulfilment of the requirements for a Master’s Degree in Commerce (Finance) in the School of Business and Finance, Faculty of Economic and Management Sciences at the University of the Western Cape.
Supervisor: Professor Pradeep Brijlal
Co-Supervisor: Mr Mark Botha
Declaration
I, Raramai Patience Munetsi hereby declare that this thesis, titled, Testing the evidence of herding behavior on the Johannesburg Securities Exchange, is my own original work which has not previously been tendered by me for a degree at this or other university or institution, all materials contained herein have been duly acknowledged.
Raramai Patience Munetsi
Dedication
ACKNOWLEDGEMENTS
First and foremost, I would like to thank God for guiding me through my Masters journey. I also would like to express my heartfelt gratitude to my supervisor Professor Pradeep Brijlal for his guidance and support throughout my master’s study. His patience, motivation and invaluable contribution were instrumental in the completion of my study. It has been an honour working with him.
My sincere gratitude also goes to my co-supervisor Dr Mark Botha for her priceless support, his contribution as well as the help to locate relevant academic literature. Without his support, I could not have completed my study.
I would like to also appreciate my family and friends for all their emotional support. My sincere gratitude also goes to Shingirai Nyakabawu for providing editorial assistance and Emmanuel Fongwa for all the help. Last but not least I would like to express my deepest gratitude to my husband Munyaradzi Masiwa, my twin boys Samuel Masiwa and Seth Masiwa, my father Obert Munetsi, my twin Rangarirai Munetsi, my sister Loice Munetsi and her twin brother Liberty Munetsi and Sally Huni for their countless sacrifices to support me throughout my study period.
Abstract
Since the discovery of herding behaviour in financial markets in the 1990s, it has become an area of interest for many investors, practitioners and scholars. Herding behaviour occurs when investors and market participants trade in the same direction during the same time period, as a result of the influence of other investors. Studies on herding behaviour have been undertaken in both the developed and developing economies and majority of these studies have confirmed the existence of herding behaviour in the stock markets. Despite its tremendous growth, the South African financial markets are not immune to such market anomaly.
Herding behaviour on the JSE was first investigated in 2002 focusing in the unit trust industry on the South African stock market. Motivated by this, this study assessed the presence of herding behaviour using the Johannesburg Securities Exchange tradable sector indices. Four indices were employed, namely Financials, Industrials and Resources and were benchmarked against the JSE All Share Index for the period from January 2007 to December 2017. The industrials index ((FINI15) constitutes of 25 largest industrial stocks by market capitalization, the financials index (FINI15) comprises of 15 largest financial stocks by market capitalization, the resources index (RESI10) which represents 10 largest resources stocks by market capitalization and lastly the FTSE/JSE All Share Index defined as a market capitalization-weighted index which is made up of 150 JSE listed companies and is the largest index in terms of size and overall value JSE. The FTSE/JSE All Share Index was used as a benchmark for investors to check how volatile an investment is.
The South African economy experienced the effects of the 2008 global financial crisis from 01 July 2007 to 31 August 2009. This study split the examination period into three categories namely before the global financial crises which was the period starting from 1 January 2007 to 30 June 2007, then the period during the global financial crisis which was from 1 July 2007 to 31 August 2009 and lastly the period after the global financial crises which was from 1 September 2009 to 31 December 2017. Apart from the diversity of the indices, the length of the examination period also had a significant influence towards the magnitude of herding behaviour on the JSE.
The study builds upon the efficient market hypothesis, portfolio theory and behavioural finance to provide evidence of the herding behaviour on the JSE tradable indices in an emerging market. The study adopted the convectional measures of herding behaviour by Christie and Huang (1995) and Chang, Cheng, and Khorana (2000). This research overall found evidence of herding behaviour on the indices RESI10, INDI25 and FINI15 indices during the global financial crisis. Conversely no herding behaviour was documented during normal periods. These findings were also documented by was recorded by Angela, Miruna and Andreea (2015) on the study that was done on Czech Republic, Poland, Hungary, Romania and Bulgaria using the measure by Chang, Cheng, and Khorana (2000). The performance of the indices was compared against the JSE ALSI to deduce the cross-sectional standard deviation of returns and cross-sectional absolute deviation of returns. An in-sample composite return graph for the three indices was plotted against the benchmark which is the JSE ALSI index. Statistical inference was run in the form of a t-test to assess whether the performance of the indices is statistically significant against the JSE ALSI. In this regard, the findings of each time frame assists investors to make more informed decisions depending on the volatility of the markets.
Key words:
Herding behaviour; Johannesburg Securities Exchange; global financial crisis; bull markets; bear markets
List of Tables
Table 2.1 Comparison of the MPT models……….26
Table 3.1 Names and codes of companies in the tradable sector indices from 2007 to 2017 ………69
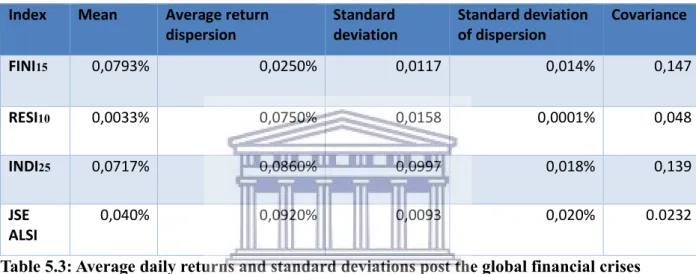
Table 5.1 Average daily returns and standard deviations before the global financial crises…79 Table 5.2 Average daily returns and standard deviations during the global financial crises…80 Table 5.3 Average daily returns and standard deviations after the global financial crises……80
Table 5.4 Average daily returns and standard deviations for the whole period of study….….82 Table 5.5: CSSD for the period before the global financial crises………84
Table 5.6: CSSD for the period during the global financial crises………85
Table 5.7: CSSD for the period after the global financial crises………86
Table 5.8: CSSD for the 11-year period of study………..87
Table5.9: CSAD for the period before the global financial crises………92
Table 5.10: CSAD for the period during the global financial crises……….93
Table 5.11: CSAD for the period after the global financial crises……….…...94
List of figures
Figure 2.1 Forms of Efficient Market Hypothesis………..11
Figure 2.2 Random Walk ……….………..14
Figure 2.3 Systematic and unsystematic risk………..17
Figure 2.4 Minimum variance portfolio………..20
Figure 2.5 Capital Market Line (most efficient portfolio).………...23
Figure 2.6 Security market line………..24
Figure 2.7 Prospect theory………...33
Figure 5.1: RESI Comparative returns for the 2007 to 2017 period………....89
Figure 5.2: INDI Comparative returns for the 2007 to 2017 period ………90
List of abbreviations and acronyms
ALSI All Share IndexAPT Arbitrage Pricing Theory
BVB Romanian Bucharest Stock Exchange CAPM Capital Asset Pricing Model
CASD Cross-sectional absolute deviation of returns CSSD Cross-sectional standard deviation of returns CML Capital Market Line
E(r) Expected Return
FDI Foreign Direct Investment FINI SA Financial Index
FTSE Financial Times Stock Exchange
GARCH Generalised Autoregressive Conditional Heteroscedasticity ICB Industry Classification Benchmark
IMP Impact Developer and Contractor INDI SA Industrial Index
JSE Johannesburg Securities Exchange MAD Mean Absolute Deviation
MPT Modern Portfolio Theory MV Minimum Variance NSE Nepalese Stock Exchange PMPT Post Modern Portfolio Theory RESI SA Resources Index
SA South Africa S &P Standard and Poor STDEV Standard Deviation USA United States of America
Table of contents
Abstract ... v
List of Tables ... vii
List of figures ... viii
List of abbreviations and acronyms ... ix
Chapter One – Introduction and Background ... 1
1.1 Research Background ... 1
1.2 Overview of the Johannesburg Securities Exchange ... 4
1.3 Problem Statement ... 5
1.4 Aim ... 6
1.5 Research objectives ... 6
1.6 Research questions ... 7
1.7 Justification of the study ... 7
1.8 Ethical statement ... 9
1.9 Structure of the dissertation ... 9
Chapter Two – Theoretical Overview ... 11
2.1 Introduction ... 11
2.2 Traditional Finance: ... 11
2.2.1 Efficient Market Hypothesis (EMH) ... 11
2.2.2 Random Walk ... 14
2.2.3 Modern Portfolio Theory (MPT) ... 15
2.2.4 Separation Theorem ... 22
2.2.7 Comparison of the MPT models ... 27
2.3 Rolls Critique ... 28
2.4 Behavioural Finance ... 29
2.4.1 Background of Behavioural Finance ... 29
2.4.2 Assumptions and attributes of behavioural finance ... 31
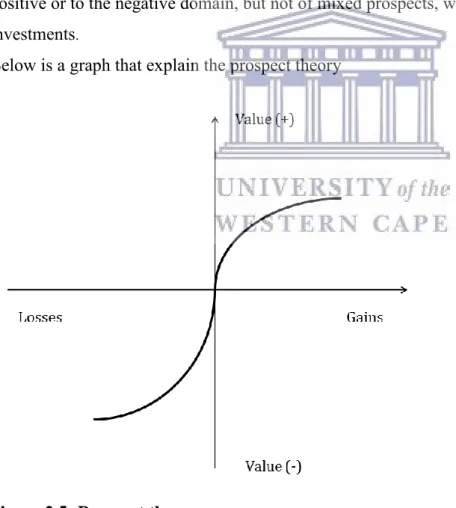
2.4.3 Prospect Theory ... 32
2.4.4 Limits to arbitrage ... 35
2.4.5 Overreaction Hypothesis and Investor Irrationality ... 35
2.4.6 Traditional Finance versus Behavioural Finance ... 36
2.5 Herding behaviour ... 38
2.5.1 Types of herding behaviour ... 39
2.5.2 Reasons for herding behaviour ... 40
2.5.3 Causes of herding behaviour ... 41
2.5.4 Consequences of herding behaviour ... 43
2.5.7 Herding behaviour on the Johannesburg Securities Exchange ... 43
2.6 Conclusion ... 45
Chapter Three – Review of Prior Literature ... 46
3.1 Introduction ... 46
3.2 Herding in the developed markets ... 46
3.2.1 Herding behaviour in developed markets during normal periods ... 46
3.2.2 Herding behaviour in developed markets during normal periods ... 50
3.3 Herding in the developing market ... 57
3.3.1 Herding behaviour in developing markets during normal periods ... 57
3.3.2 Herding behaviour in developing markets during periods of market volatility ... 59
3.4 Conclusion ... 65
4.1 Introduction ... 67
4.2 Research design ... 67
4.3 Possible Biases in Research and Their Remedies ... 69
4.5 Population / sample description and data sources ... 70
4.6 Data Collection ... 73
4.7 Data used and analysis ... 74
4.7.1 Data analysis ... 74
4.7.2 Herding during normal periods- pre and post global financial crisis ... 75
4.7.3 Herding during periods of market stress-during the global financial crisis ... 77
4.8 Conclusion ... 78
Chapter Five – Results and Analysis ... 79
5.1 Introduction ... 79
5.2 Restatement of research objectives ... 80
5.3 Results ... 80
5.3.1 Descriptive statistics ... 80
5.3.2 Descriptive statistics before the global financial crisis ... 81
5.3.3 Descriptive statistics during the global financial crisis... 82
5.3.4 Descriptive statistics after the global financial crisis ... 84
5.3.5 Descriptive statistics for the entire study period ... 85
5.4.1 Herding behaviour on the JSE tradable indices ... 86
5.4.2 CSSD before the global financial crisis ... 86
5.4.3 CSSD during the global financial crisis ... 87
5.4.4 CSSD after the global financial crisis ... 88
5.4.5 CSSD for the entire period of study ... 90
5.4.6 Herding behaviour on the JSE indices during the global financial crisis period using CSAD ... 95
5.4.7 CSAD before the global financial crisis ... 95
5.7.8 CSAD during the global financial crisis ... 96
5.4.9 CSAD after the global financial crisis ... 97
5.4.10 CSAD for the entire period of study ... 98
5.5 Conclusion ... 99
Chapter Six – Conclusion ... 101
6.1 Introduction ... 101
6.2 Summary of findings... 101
6.3 Significance of this research outcome to investors ... 102
6.4 Recommendations for future research ... 106
Chapter One – Introduction and Background
1.1 Research BackgroundIn developed and developing economies, the volatility of financial markets is a major concern to scholars, stock market investors and practitioners in the finance field. The South African (SA) financial market is not immune to such volatilities as it is integrated with other global markets. It is influenced by both micro and macro-economic factors such as inflation, interest rates, oil prices and exchange rates (Szczygielski & Chipeta, 2015). In this regard, these market volatilities tend to influence investors to follow each other’s investment decisions in search for profitable returns.
Herding behaviour is a phenomenon that is found when investors follow each other’s investment decisions. It can also be defined as the tendency by investors to imitate the actions of other market participants (Angela, Miruna & Andreea, 2015). This idea is located on the border between the theory of market efficiency and behavioural finance. The theory of market efficiency coined by Fama in 1960 is the base of most financial literature and will be discussed in detail in chapter two. The market efficient hypothesis is based on the idea that prices of a stock fully reflect all new information. Even when an uninformed investor buys a diversified portfolio at a price given by the market, returns obtained will be as generous as those achieved by the investment experts (Gupta, Preetibedi & Poonamlakra, 2014).
Critics emerged to counter this school of thought with the behavioural aspect of investors in the stock market to expose the irrationality of capital market participants (efficient market hypothesis). They revealed that there is a psychological principle on investor’s decision making, which is decisions to buy or sell stocks (Gupta, Preetibedi & Poonamlakra, 2014). Herding behaviour is a branch of behavioural finance. Herding behaviour is a mindset that is described by the lack of individual decision-making, causing investors to think and act in the same way as the majority of those around them (Bikhchandani & Sharma, 2001). Herding behaviour was exhibited in the 1990s when private investor’s excitedly invested large amounts of money into internet related companies (Bikhchandani & Sharma, 2001). This was done
irrespective of the financial performance of the companies. Boortz and Jurkatis (2013) assumed that the driving force was the reassurance the investors got from seeing so many other market participants doing the same thing. Another good example to explain herding behaviour is when Warren Bufett buys a stock, it is reported as news, and that news affects the stock prices. The impact of such news may be rational, but investors are often regarded of irrationally because of the presence of the herding behaviour (Hirshleifer & Hong Teoh, 2003).
Ouarda, El Bouri and Bernard (2013) argue that since behavioural finance assumes that investors are irrational and markets are inefficient, herding behaviour has different types of irrationality which reflects why investors tend to follow what others do. These two forms are irrational and rational herding behaviour. Irrational herding behaviour refers to a set-up of collective actions that are taken by an investor in uncertain market conditions. Irrational behaviour occurs when traders ignore the information available to them, and refuse to make their own decisions, in order to follow the conclusions of others, even if they do not agree (Christie & Huang, 1995). Investors benefit from such behaviour since it reduces the uncertainty and the fear of the unknown that some investors possess (Devenow & Welch, 1996). Rational herding behaviour is seen in situations where investors, are unable to fulfill their expectations and then replicate the actions of investment experts they believe to be better informed. These investment expects are believed to possess a source of more reliable information, which makes the investors to obtain returns above the market (Demirer & Kutan, 2006).
This research focuses on the rational herding behaviour and provides an analysis of herding behaviour on the JSE tradable indices. Amongst the 22 African stock exchanges the Johannesburg Securities Exchange is the biggest. It is among the top 20 security markets in the world JSE (2017) and more than 800 securities with different risk-return characteristics trade daily on the JSE equity market (JSE, 2018). In 2017 the JSE stock market recorded number of trades that amounted to 26 081 with a yearly reported volume of 5 359 000 000 (JSE, 2017).
JSE has a wide range of products and services which include commodities, currencies and resources. The JSE sector indices provide an easy way to determine the overall performance of
the stock market or a segment of the stock market over a period of time (JSE, 2017). Of all the indices on the JSE the Top40 index is the largest. It comprises of 40 largest listed companies on the JSE by market capitalization (JSE, 2017). The JSE has a number of sub-indices such as the Mid Cap, Small Cap and Tradable indices. The MidCap index comprises stocks ranked from 41 to 100 on the market by market capitalization, after the Top40 index. Small caps are the companies with values smaller than the top 100 listed companies by market capitalization. The tradable indices which include the industrials index (INDI25) constitutes of 25 largest industrial stocks by market capitalization, the financials index (FINI15) comprises of 15 largest financial stock by market capitalization and lastly the resources index (RESI10) which represents 10 largest resources stocks by market capitalization.
With so many investments opportunities to choose from and also so much trading activities, an average investor may face challenges in order to decide where to invest (Baker & Haugen; 2012; Blitz & van Vliet; 2007; Haugen & Baker, 1991; Jagannathan & Ma, 2003). In order to make the process of choosing an investment simple, investors can consider the past and present performance of the desired stock. However, a challenge comes in not knowing whether the stock will produce profitable returns (Lombard; 2015). In order to rectify this a benchmark normally represented by a market index can be used to evaluate the performance of the chosen investment (Elton & Gruber, 1999; Lombard, 2015).
This study uses a market index as the FTSE/JSE All Share Index (ALSI), defined as a market capitalization-weighted index which is made up of 150 JSE listed companies and is the largest index in terms of size and overall value (JSE, 2017). This index was formed after JSE had tied up with the London FTSE to form the JSE/FTSE indices. The companies included in this index constitutes to the top 99 percent of the total pre free-float market capitalization of all listed companies on the Johannesburg Securities Exchange (JSE, 2017).
The FTSE/JSE All Share Index as a benchmark for investors assisted this research to check how volatile an investment is and the investment’s performance against a benchmark (Lombard, 2015). According to Cairns (2016), the volatility of the SA market as measured by the South African Volatility Index (SAVI) for the period 2007 to 2016 ranged from as low as
12 to 60 and this high volatility of the SA market is due to the weakening rand, political instability and a series of rating downgrades recently.
1.2 Overview of the Johannesburg Securities Exchange
The JSE was formed on 8 November 1887 after the discovery of gold in Witwatersrand to raise the ample desired capital to invest in the mining sector (Smith, Jefferis & Ryoo, 2002). The first trading done on the JSE started in a small tent which was later upgraded to an automated electronic trading system in the early 1990s. Back then the JSE was known as Johannesburg Stock Exchange because only shares were being traded, but in 2000 it changed its name to Johannesburg Securities Exchange (JSE, 2017). To date, the JSE is among the world’s top twenty largest stock markets with a market capitalisation $1,007 billion at the end of 2013. Among the developments of the JSE is its agreement with the London Stock Exchange in 2001, which permitted the cross-trading between the two securities exchanges (JSE, 2014). This was followed by the acquisition of the Bond Exchange of South Africa (BESA) in 2009 which formed debt market has allowed in the inclusion of South African government and corporate bonds as well as interest rate derivatives on the JSE. In 2012, the JSE together with other exchanges founded the United Nations Sustainable Stock Exchanges as an initiative to explore how exchanges can operate with stakeholders such as investors, regulators and companies so as to create more conducive capital markets. The JSE was re-branded in 2017 in order to show its identity as a modern African securities market that links investors to growth opportunities in both the SA market and the global market. In 2017 the JSE also changed its logo following the re-branding (JSE, 2017).
According to the Industry Classification Benchmark (ICB), the SA sector categorizes all listed instruments into one of three sectors, namely Resources, Financials and Industrials, based on their revenue (JSE, 2017). As mentioned earlier, the industrials index (INDI25) constitutes of 25 largest industrial stocks by market capitalization, the financials index (FINI15) comprises of 15 largest financial stock by market capitalization and lastly the resources index (RESI10) which represents 10 largest resources stocks by market capitalization. JSE (2017) shows that the industrial sector is the most represented sector in terms of market capitalization on the JSE.
This research will focus on the JSE tradable indices which are RESI10, FINI15 and INDI25.
1.3 Problem Statement
Financial research incorporates human behaviour in describing the actions of investors in financial markets. Herding behaviour is a behavioural anomaly which defies the efficient market hypothesis. Herding behaviour is known to influence the investors buy and sell decisions. It has implications on investor trading, financing choices, managerial investment, market prices and market regulation. Investors are shown to follow herding behaviour because they undertake risky speculations without adequate information and appreciation of the risk-reward trade-offs (Demirer & Kutan, 2006).
Friedman (1953) first examined the relationship between investor behaviour and market volatility, arguing that irrational investors destabilize stock prices. Irrational investors are believed to buy stocks when the prices are high and sell when the prices are low which is in contrast to rational investors that buy low and sell high (Messis & Zapranis, 2014). According to De Long, Shleifer, Summers and Waldmann (1990), the presence of irrationality on investors in financial markets can increase price volatility and the risk related with investing. In addition, Froot, Scharfstein, and Stein (1992) demonstrates that investors imitate one another by this means increasing the instability in the financial markets. Wang (1993) accounts that uninformed investors are likely to follow the market trend and such behaviours are considered to be the same as herding.
On the JSE, Seetharam and Britten (2013) studied the impact of herding behaviour on the market cycle focusing on the assumption that herding behaviour dramatically fluctuated before a market contraction. Monthly data was collected for all shares listed on the JSE and the All Share Index (ALSI) from 1995 to 2011. Seetharam and Britten (2013) found evidence that a negative market reaction was led by an increase in herding during a South African market contraction. Ababio and Mwamba (2017) examined evidence of herding behaviour on South Africa’s financial industry. They collected data from January 2010 to September 2015 and used the quantile regression model in order to evaluate the effects of herding behaviour. Results
showed evidence of herding behaviour in the banking and real estate sectors during the sample period.
Angela, Miruna and Andreea (2015) note that nothing has been tested on the JSE Limited tradable indices. After the occurrence of global financial crisis, herding behaviour could cause stock prices to deviate from their fundamental value. The presence of herding behaviour could provide useful information for financial models that are used to estimate evolution of stock prices. Research by Ababio and Mwamba (2017) showed that real estate sector investors presented herding behaviour to be present during periods when the market is rising. Angela, Miruna and Andreea (2015) show that investors followed herding behaviour more during periods of downward trend. This research focuses on herding behaviour on the JSE focusing on the tradable indices. It looks at the presence of herding behaviour before global financial crisis, during global financial crisis and after global crisis. This study uses the convectional measures namely the Cross-sectional standard deviation of returns measure by Christie and Huang (1995), and Cross-sectional absolute deviation of returns measure by Chang et al.. (2000) to analyze if the herding behaviour was evident on the JSE tradable indices.
1.4 Aim
The aim of the study is to investigate whether investors follow herding behaviour based on the SA
tradable sector index namely the industrials index (INDI25), the financials index (FINI15) and
lastly the resources index (RESI10). The measures of herding behaviour by Christie and Huang (1995) and Chang et al. (2000) used to determine the presence of herding behaviour on the JSE tradable indices using JSE ALSI as a benchmark for comparison and results analysis.
1.5 Research objectives
In order to guide this study, the following research objectives are stated:
1. To establish whether the JSE tradable sector index (RESI10, INDI25, FINI15) had evidence of herding behaviour before the global financial crisis
2. To establish whether the JSE tradable sector index (RESI10, INDI25, FINI15) had evidence of herding behaviour during the global financial crisis
3. To establish whether the JSE tradable sector index (RESI10, INDI25, FINI15) had evidence of herding behaviour after the global financial crisis
1.6 Research questions
1. Does evidence of herding behaviour exist on the JSE tradable indices (RESI10, INDI25, and FINI15) before the global financial crisis during the study period 2007 to 2017?
2 Does evidence of herding behaviour exist on the JSE tradable indices (RESI10, INDI25, and FINI15) during the global financial crisis during the study period 2007 to 2017?
3 Does evidence of herding behaviour exist on the JSE tradable indices (RESI10, INDI25, and FINI15) after the global financial crisis during the study period 2007 to 2017?
1.7 Justification of the study
The issue that investors follow herding behaviour is the rationale for carrying out this research (Nofsinger & Sias, 1999). Herding behaviour is related to investor’s psychology in which different investors follow each other in the financial world rationally or irrationally. The existence of herding behaviour shows that markets are inefficient. Asset prices may be misleading and the markets are inefficient and enough consideration should be taken by local and foreign investors in order to attain a higher number of securities to diversify their investment (Sarpong & Sibanda, 2014).
Studies conducted by Ababio and Mwamba, (2017) also presented evidence that herding behaviour is present in financial markets and it influences how investors buy and sell stocks. The implication of this study was therefore to determine if herding behaviour existed at the JSE before the global financial crisis, during the global financial crisis and after the global financial crisis using the three major JSE tradable sector indexes. This study makes a comparison with the JSE ALSI as a benchmark. The global market crush in 2008 affected the JSE stock performances (Venter, 2011). The outcome of this study will provide investors with the knowledge on the influence of herding behaviour and this will ultimately help investors when making investment decisions.
According to Coetzee (2017), the SA local index performance for the last 10 years recorded that the INDI25 index (25 largest industrial stocks on the JSE) outperformed major global markets and even the S&P500(an American stock market index which is based on the market capitalizations of 500 large companies having common stock listed on the NASDAQ) by 143 percent. Coetzee (2017) documented that the FINI15 index (comprises of 15 largest financial stocks) gained 34.4 percent in its overall performance while the SA-listed property retained 87.9 percent of its value. Conversely, the RESI10 index (which represents 10 largest resources stocks) lost 59.9 percent of its overall performance over the past decade. With such a performance trend of the local indices, it is essential for this research to investigate if these indices performances are in any way influenced by herding behaviour.
Furthermore, investigating herding behaviour aids to analyze the more complex elements of the market by identifying biases in human behaviour and using such findings to explain some of the observed anomalies such as market crashes (Dangi & Rathore, 2011). Research that has been done both in developed and developing economies has showed overwhelming evidence that investors make major systematic inaccuracies and there is evidence that psychological biases affect market prices significantly (Dangi & Rathore, 2011).
Studies of herding behaviour on the SA stock market had been done focusing on component indices, mutual funds, financial industry and property industry and found herding behaviour present (Gilmour & Smit, 2002; Seetharam & Britten, 2013; Sarpong & Sibanda, 2014; Ababio & Mwamba, 2017). This research deviates from the empirical studies on the JSE by focusing on the JSE tradable sector indices. South Africa tradable sector indices are a representation of all the JSE listed instruments, classified according to their sector categories, which are Resources (RESI10), Financials (FINI15) and Industrials (INDI25) (JSE, 2018). Using the JSE tradable sector indices will permit a comprehensive investigation of the performance of JSE stocks as a whole. The present study focuses on three different market volatility periods in South Africa namely before, during and after the global financial crisis period in order to capture herding behaviour during different market periods. In order to address this hypothesis, two major testing measures (cross-sectional absolute deviation of returns and cross-sectional
standard deviation of returns) of herding behaviour by Christie and Huang (1995) and Chang et al. (2000) are used.
1.8 Ethical statement
The main purpose of the study is not to make any critical remarks against any investor. Since information on JSE ALSI index constituents are publicly available and the study does not use private information, there are no major ethical issues that arise during the study.
1.9 Structure of the dissertation
The rest of the dissertation is structured as follows:
Chapter 2: Theoretical Overview
This chapter opens by discussing the basic theory of the Markowitz model and explain the derivation of behavioural finance and ultimately leading to herding behaviour, its causes and consequences.
Chapter 3: Literature review
Chapter three reflects on the past studies that were done both in developed and developing markets on herding behaviour, leading to studies that have been done the JSE.
Chapter 4: Research methodology
The chapter discusses the methodological issues employed to achieve the stated objectives, the data employed, as well as the measures on how to calculate herding behaviour. Daily data of closing share prices of the main three tradable sector indices on the JSE was collected as well as the JSE ALSI, which was used as a benchmark. Research objectives were restated and potential research biases relating to this study will also be discussed in this chapter.
Chapter 5: Research findings and discussion
This chapter presents descriptive statistics, results on the analysis of herding behaviour during normal periods and periods of market stress. Also empirical findings on herding behaviour in both international and domestic economies were discussed in relation to the findings of this research.
Chapter 6: Conclusion
The final chapter concludes the study. It presents a summary of findings from the examination results performed in this research and ends by proffering recommendations, the significance of this study and suggestions for further research.
Chapter Two – Theoretical Overview
2.1 IntroductionThis chapter discusses the theoretical underpinnings of herding behaviour starting from the efficient market hypothesis (EMH) until behavioural finance leading to herding behaviour. Behavioural finance is the study of the influence of psychology on investors and how they invest as a result of thereof. Behavioural finance arises due to the inefficiency of the Capital Asset Pricing Model (CAPM) which was developed from the Efficient Market Hypothesis (EMH) (Malkiel, 1989). Behavioural finance helps explain how and why markets might be inefficient and herding behaviour is a branch of behavioural finance. This chapter discusses the logical development of herding behaviour, traditional and behavioural finance with a rational and irrational explanation as to why they both exist. Lastly, this chapter will discuss how behavioural finance leads on to the development of herding behaviour.
2.2 Traditional Finance:
Traditional finance explains financial markets using mathematical models that assume the rationality of investors. Nofsinger (2001) states that the field of finance has progressed over the past years based on the assumption that investors make rational decisions. A rational investor is defined as an investor that always makes choices that are normatively acceptable and upgrade their knowledge consistently with new information (Thaler, 2005). Traditional finance consists of Efficient Market Hypothesis (EMH), Random Walk and Modern Portfolio Theory. To elaborate on the development herding behaviour this chapter will start by discussing EMH and all its forms, CAPM, Rolls Critique on CAPM and the Arbitrage Pricing Theory (APT).
2.2.1 Efficient Market Hypothesis (EMH)
The Efficient Market Hypothesis (EMH) theory was introduced by Eugene Fama in 1960. This school of thought is central to all financial literature and is used by both academics and practitioners. EMH postulates that it is impossible for market participants to outperform the market in a consistent manner and earn abnormal risk-adjusted returns (Malkiel, 1989). It
contends that markets are efficient and current prices reflect all information, therefore attempts to outperform the market are a game of chance rather than a skill (Fama & French, 2004). With the objective of wealth maximisation, investors use all accessible information when trading securities. As a result, stocks always trade at their fair value on the market exchange thereby eliminating opportunities of arbitrage (Fama & French, 2004). LeRoy (2010) argues that it is impossible to beat the market on a constant basis through stock selection or market timing variables and the only way investors can obtain higher returns is through acquiring riskier stocks. This is because investors are rational and they are compensated for the amount of risk they bear.
2.2.1.1 Forms of EMH
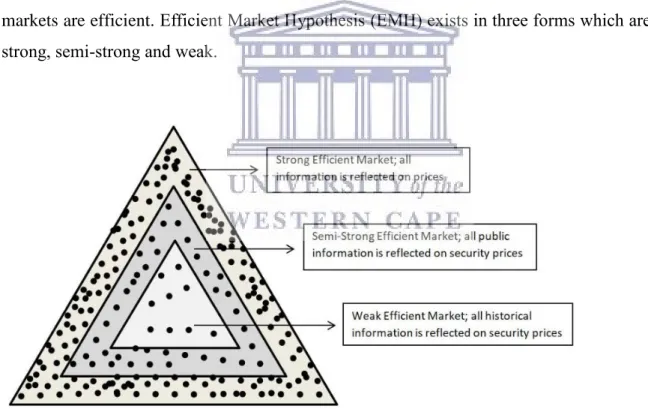
Fama (1970) suggests that a stock price fully reflects all information at any given time as markets are efficient. Efficient Market Hypothesis (EMH) exists in three forms which are the strong, semi-strong and weak.
Figure 2.1: Forms of Efficient Market Hypothesis Source: Timmermann and Granger, (2004)
The diagram above presents the detailed sequence of these levels of market efficiency. The first form of market efficiency, the weak-form of EMH implies that the market is efficient, based on historical information. Stock prices are believed to reflect all information, derived by
examining market trading data such as the history of past prices and trading volumes (Malkiel, 1989). This form of EMH stresses that trend analysis commonly used by technical analysts is ineffective because it cannot be used to predict and outperform the market. Technical analysis uses charts and trading volumes when deciding which stocks to purchase. If there are signals of market inefficiencies, investors would have found them and exploited them, resulting in movements in the shares price towards its intrinsic value (Fama, 1970). The rates of return on the market should be independent, meaning the past rates have no effect on future rates. With the help of the numerous techniques, technical analysts attempt to time the markets and sell or buy stocks when stocks are considered to be overbought or oversold, in relation to the overall market trends. Goodspeed (2013) agrees with Marshall and Cahan (2005) that technical analysis, involves observing and analyzing past asset price series and trading volume data in attempt to gain from periodic deviations in these trends. By these definitions, technical analysis can be seen to fall under the weak form of the EMH.
The second form of market efficiency, the semi-strong form states that all publicly available information concerning the prospects of a firm is reflected in the stock price. This information also incorporates the weak-form hypothesis. Semi strong form uses fundamental data on the company’s product which include quality of management, balance sheet structure, patents, earning forecasts, and accounting practices amongst others. This implies that a fundamental analyst, who analyses macro-economic variables and the firm’s performance, will not be able to beat the benchmark on a consecutive basis. Warren Buffet uses his entrepreneurship skills to find mispriced securities so as to outperform the market (Bruner, 2003).
The last and final form of market efficiency, strong-form of EMH views the market as efficient, reflecting all information both public and private. It incorporates the weak-form EMH and the semi-strong form EMH (Fama, 1992). Strong form, suggests that corporate insiders and specialists have access to pertinent information long before it is publicly released, and enables insiders and specialists to gain from trading with the information. The Securities and Exchange Commission (SEC) is directed toward preventing insiders from profiting by disabling their advantaged position (Malkiel, 1989). Thus, trading by all corporate officers, directors and owners is required to be reported to the SEC. Although there is evidence that contradicts EMH
whereby specialists use controlling information to earn profits. Fama (1970) proves that management of mutual funds do not earn abnormal returns, the fund risk-reward is below market line over the period. As stated by efficient market hypothesis under the weak form that past and future returns are independent and evenly distributed, that is past and future returns are not correlated. This belief agrees to the idea of the random walk model. Fama (1970) supports that the theory of random walk leads to the evidence of weak-form EMH.
2.2.2 Random Walk
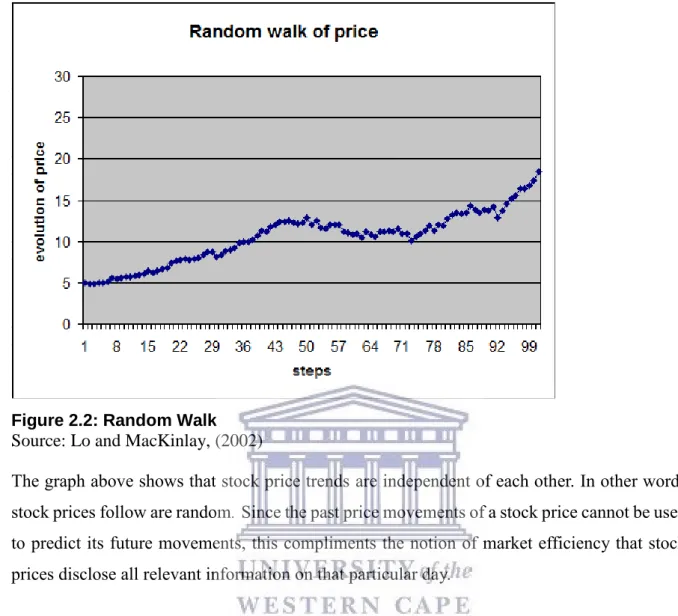
The random walk theory argues that stock price changes are independent of each other and as a result, the past trend of a stock price cannot be used to predict its future movement (Kendall, 1953). The theory of random walk supports the efficient market hypothesis’s weak form which argues that stock markets are believed to be efficient since the historical information of the stock price is available to all investors. Thus, individuals that buy and sell stocks consist of a large number of rational investors with access to this information (Van Horne & Parker, 1967). Kendall (2005) argues that stock prices follow a random walk because investors cannot predict the future market prices of a stock. In other words, the price changes are independent of another. Past news or information does not influence stock prices tomorrow (Fama, 1965). Applying the random walk theory to finance and stocks suggests that a follower of the random walk theory believes it's impossible to outperform the market without assuming additional risk. This complements what advocates of the efficient markets suggests that it is impossible for an investor to constantly outperform the market. Below is graph that shows how stock prices are random:
Figure 2.2: Random Walk Source: Lo and MacKinlay, (2002)
The graph above shows that stock price trends are independent of each other. In other words stock prices follow are random. Since the past price movements of a stock price cannot be used
to predict its future movements, this compliments the notion of market efficiency that stock prices disclose all relevant information on that particular day.
Some scholars argue that there is no distinct difference between the random walk theory and the efficient market hypothesis. However, LeRoy (1973) and Lucas (1978) suggest that there is a clear distinction between the two. The distinction comes from one of the central ideas of modern financial economics mentioned above, the necessity of some trade-off between risk and expected return. Furthermore, prices move only with the introduction of new information and this information is random and unpredictable (Jiang & Tian, 2012)
2.2.3 Modern Portfolio Theory (MPT)
The Morden Portfolio Theory is a passive portfolio management approach based on the portfolio risk-return profile for portfolio selection and construction, constituting three portfolio theories (Garaba, 2000; Vukovic & Bjerknes, 2017). These three theories include the
mean-variance analysis (MVA) by Markowitz (1952), the CAPM independently developed by Treynor (1961), Sharpe (1964), Lintner (1965) and Mossin (1966) as well as the arbitrage pricing theory (APT) by Ross (1976). The pioneering research by Markowitz (1952) on portfolio optimisation qualified him to be the father of modern portfolio theory (Darko, 2012). The research by Markowitz is considered as the foundation of portfolio optimisation. In this regard, Markowitz’s MVA is explained as the root theory of MPT, followed by Tobin’s (1958) separation theorem, which extends upon the works of Markowitz. In order to cater for the shortcomings of the previous theories, the CAPM was introduced and lastly, the APT, which forms the final block of the MPT.
Markowitz (1952) is the pioneer of MPT, which was the first theory to include risk into the portfolio management process. A combination of diversification for risk reduction and efficient capital markets resulted in an increase in expected returns of a portfolio. The MPT theory placed portfolio selection scenario into steps starting with observing and experiencing and ending with the belief in the future performance of available stocks. The second step on the MPT theory began with relevant beliefs about prospect performance and ends with selection of assets that would be incorporated into a portfolio. Markowitz (1952) developed the efficient frontier, with the function to maximise expected returns at the given level of risk in a portfolio. In order to manage portfolio, risk investors should include a proportion of risk-free assets into their portfolio to ensure a certain level of return. This usually is a risk free asset which has a high level of liquidity with almost no chance of defaulting. Any point on the efficient frontier that contains both risky and risk free assets is referred to as the optimal portfolio. This allows investors to select portfolios with high expected returns given a certain level of risk (Markowitz; 1952).
Prior to Markowitz's work, the calculation of the rewards and risks of portfolios was carried out through the analysis of specific securities individually. By formalizing the concept of diversification, Markowitz suggested that investors should focus on selecting portfolios based on their joint risk-reward features instead of merely compiling individually attractive securities (Bera & Park; 2008). Using past returns of each asset on a portfolio and statistical measures
such as standard deviation and average return, the expected return and volatility of any portfolio is constructed. Markowitz used volatility and expected return as proxies for risk and reward. Previously MPT investors used to calculate performance of individual securities based on judgement and experience. The standard pattern for investing was to construct a portfolio by first identifying the securities that hold great probabilities for gain with the low risk chances (Brown, 2012; Marx, Mpofu, De Beer, Nortje & Van de Venter, 2010). In this regard, investors would think that bank stocks have good risk return characteristics and construct an entire portfolio using only the bank stocks. By doing so, the investors will be omitting the effect of unsystematic risk which can be eliminated by diversification. With the vastness of securities available on stock markets, it can be tedious and challenging for investors to pick stocks individually that would yield the investors’ desired outcomes.
The MPT theory hypothesises on diversification benefits (Joshipura & Joshipura, 2015). By formalising the concept of diversification, Markowitz proposes that investors should consider portfolios based on their collective risk - return characteristics rather than focusing on individual securities without considering how they will perform collectively as a portfolio (Brown, 2015). According to Markowitz (1952), the process of selecting a portfolio can be divided into two stages. The first stage deals with observation, experience and ends with the beliefs about the future performances of available securities. The second stage on the other hand started with the relevant beliefs about future performances and ends with choice of portfolio. Therefore, the collective performance of assets in a portfolio can be estimated by using the individual assets historical returns, the standard deviation and their covariance to calculate the portfolio risk and return. Joshipura and Joshipura (2015) note that since return and risk (mean and variance) relationship is the main backbone of this theory, the model was then referred to as the mean- variance portfolio model.
There are two types of risk namely systematic and unsystematic risk (Rutterford & Sotiropoulos, 2016). Systematic risk is related to an economy as a whole and macro in nature for example inflation and interest rate (Rutterford & Sotiropoulos, 2016). Systematic risk is also referred to as undiversifiable risk since nothing can be done by investors in order to reduce
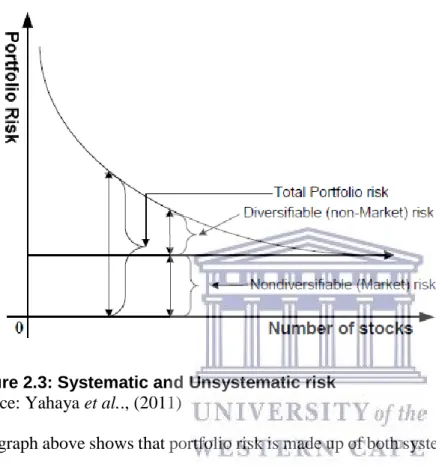
systematic risk. Conversely, unsystematic risk is firm specific and is also referred to as diversifiable risk (Fragkiskos, 2014). Diversification can be used to eliminate unsystematic risk (Markowitz, 1952). According to the MPT theory, as the number of securities in a portfolio increase, the level of portfolio risk decreases (Yahaya, Abubakar & Garba; 2011). This can be diagrammatically presented in Figure 1 below:
Figure 2.3: Systematic and Unsystematic risk Source: Yahaya et al.., (2011)
The graph above shows that portfolio risk is made up of both systematic and unsystematic risk. From the graph, diversifiable risk is subjective to the risk appetite of the investor and non-diversifiable risk is constant to every investor irrespective of the risk appetite. Markowitz (1952) argued that for diversification to be effective, there must be a correlation between the different investment vehicles, thus the securities in a portfolio must have a different reaction to certain market events. In order to obtain superior diversification benefits investors should select assets from different industries and asset classes that are uncorrelated (Popina & Martyniuk, 2016). Different asset classes such as bonds and stocks react differently to hostile negative market events. The sensitivity of the entire portfolio will be reduced as a favourable movement in one asset class will offset an unpleasant movement in another asset class. Thus the more uncorrelated the stocks are, the less the portfolio risk (Popina & Martyniuk, 2016).
Markowitz (1952) notes that the law of large numbers states that an investor can diversify many several assets at the same time maximising returns whereby the actual return of the portfolio will be almost the same as the expected return. In other words, the rule argues that there is a portfolio which gives a maximum return at the same time having a minimum variance. However, Markowitz overlooked the rule based on the fact that the portfolio with the maximum return is not necessarily the one with the lowest variance hence diversification does not eliminate portfolio risk exclusively since there is always systematic risk which cannot be diversified away (Markowitz, 1952).
2.2.3.1 Expected return measurement - The Capital Asset Pricing Model (CAPM)
The value of a security is best evaluated by its mean, variance, and its correlation to other securities in a portfolio (Markowitz, 1952). Optimal results within an infinite number of possible alternatives that an investor has to construct a portfolio can be yield by balancing the risk and return features of the portfolio.
Portfolio return refers to the anticipated earnings generated from the invested securities. Markowitz (1999), Mossin (1966), Sharpe (1964) and Lintner (1965) all independently contributed towards the development of CAPM which is an extension on Markowitz’s (1952) portfolio theory. CAPM is a one-factor model which illustrates the relationship between risk and return associated with assets within a portfolio. It is constructed with an understanding that diversifiable risk is mitigated through diversification therefore an investor’s portfolio is only exposed to is market risk.
CAPM builds on the Markowitz mean, variance and efficiency model in which focused on risk-averse investors. These investors choose only efficient portfolios with maximum expected return with minimum variance. CAPM believes that unsystematic risk can be mitigated through diversification (Hseih & Hodnett, 2012; Sharp, 1964; Lintner, 1965; Mossin, 1966). Investors only require to be rewarded for bearing systematic risk. Systematic risk is measured by beta (β) which is the sensitivity of either assets or portfolios returns in relation to the market and has a market beta of 1. This implies that stocks with high beta coefficients are subject to higher risk and higher expected returns compared to those with low betas. However, investors have
different degrees of risk aversion and adjust their exposures by altering their proportions invested in risk-free and risky assets. According to Markowitz (1999) the assumptions of CAPM are listed below:
1. The wealth of individual investors is small in comparison to the market, which means an individual investor cannot impact prices with trades.
2. Investors plan for identical holding period (no rebalancing during the period). 3. The investment universe is limited to that of publicly traded financial assets. 4. Investors pay neither tax nor transaction costs.
5. All portfolios are constructed on basis of the efficient frontier and they are seen as mean-variance optimizers.
6. All investors analyse securities similarly and share the same economic view of the world which results in investors holding the same approximations of the probability distribution of future cash flows from investing in the available securities.
All investors’ use the same expected returns, standard deviations and correlations to generate the efficient frontier and the unique optimal risky portfolio. Its computation comprises finding the weighted average return of securities included in a portfolio by multiplying individual securities by their respective weights (Nawrocki, 1999).
2.2.3.2 Variance and covariance calculation
Markowitz (1999) states that the portfolio variance (risk) is a measure of how returns of a set of securities constituting a portfolio fluctuate and deviate from the expected rate of return, that is the chance of unfavorable events happening. Covariance is a measure of how the assets in a portfolio can move in relation to each other Markowitz (1959).
The portfolios constructed in this optimal manner follow Markowitz’s efficient frontier. Any point below the efficient frontier is attainable and efficient; however, portfolios below the frontier are inefficient. Depending on the investors risk averse they should select a portfolio that lies on the efficient frontier. Below is an example of the efficient frontier
Y
X Figure 2.4: Minimum variance portfolio
Source: Ayodeji and Ingram (2015:44)
The graph above shows that investors with low risk appetite will invest in efficient portfolio 1 on the efficient frontier and conversely investors with high risk appetite will invest in efficient portfolio 2. The essence of MPT is that even very risky assets can reduce a portfolio’s total risk if the covariance of returns between the risky asset and other assets in the portfolio is low. A vital assumption of Minimum Variance Portfolio is that all investors desire to maximize return and minimize risk. Markowitz’s work established that a mean-variance efficient frontier exists for any collection of risky assets. Thus rational investors tend to choose their optimal portfolios along the efficient frontier depending on their personal risk tolerances and preferences (Msimanga, 2010).
Additionally, there is a rule which implies that an investor should diversify and maximise expected return. The rule states that an investor does or should diversify their portfolio amongst various securities which would in return produce maximum expected return. However, the expected or anticipated returns rule is insufficient alone. If the returns from securities are too
inter-correlated diversification cannot eliminate all variance. Markowitz (1952) states that one should consider the expected returns-variance (E-V) rule. The E-V rule states that an investor should or does want to select a portfolio which gives rise to the E-V, which are those portfolios with minimum Variance (V) for a given Expected return (E). This hypothesis implies the right kind and reason of diversification, and shows the necessity of avoiding to invest in securities with high covariance among themselves. Sharpe (1964) states that in equilibrium, capital assets prices have adjusted so that an investor, if he follows rational procedures such as diversification, is able to obtain a desired point along the Capital Market Line (CML). An investor may gain a higher expected return by acquiring additional risk.
2.2.4 Separation Theorem
In 1958 Tobin extended on Markowitz's work by adding a risk-free asset to the analysis. This theory is referred to as called the Separation Theory. Tobin assumed that by adding a risk free asset such as a government asset to a portfolio, it is possible to outperform a risky portfolio in terms of both risk and return. In this regard if an investor seeks to avoid risk they can lend at the risk-free rate and if the investor is risk seeking, they can borrow at the risk-free asset rate and invest into market at their desired level of risk (Kroll & Levy, 1992).
The Separation theory proposes that investors should separate their portfolios choices by identifying the mean-variance efficient risky portfolio, also known as the market portfolio and allocating capital to a combination of the risk-free asset and the market portfolio (Kroll & Levy, 1992). By combining a risk free asset with a portfolio on the efficient frontier, a portfolio with superior risk-return profiles as compared to those on the efficient frontier can be constructed. Tobin (1958) argues that using the risk free asset, investors who hold the super-efficient portfolio may leverage their position by shorting the risk free asset and invest the proceeds in additional holdings in the super-efficient portfolio or deleverage their position by selling some of their holdings in the super-efficient portfolio and investing the proceeds in the risk free asset (Trammell, 2006).
Holding a risk free asset will also protect investors from losing all of their investments during market crushes. One of the key assumptions brought by Tobin (1959) was that in the world
there is only one safest asset, which is the risk free asset. Therefore, portfolio choice by any risk averse portfolio holder can be described as a choice between the safe asset and the same portfolio of risky assets. In summary Tobin believed that investors should not put all their eggs in one basket, which clearly shows the need for diversification and the incorporation of risk free within a portfolio (Tobin, 1958).
The Separation theory provides a better understanding of how to diversify risk profiles and it also provides a comprehensive standard of how to allocate capital in efficient markets. This perspective aided to the development of the CAPM. According to Tobin (1958) the assumptions of the separation theorem are listed below:
1. At least one asset is riskless (has a zero return variance). 2. Investors can borrow or lend at the riskless rate of interest.
3. A set of assets with known means, variances and pairwise covariance’s. 4. Investors are risk averse.
5. Every investor should the optimal portfolio.
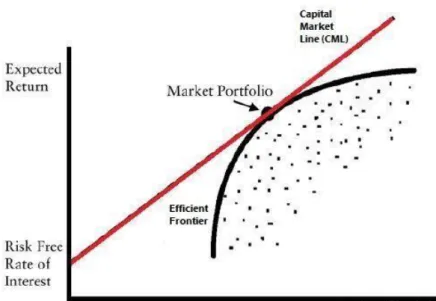
With all the explanation above, Tobin used the Capital Market Line (CML) to identity efficient portfolios. The CML is used in conjunction with the efficient frontier in order to show the rates of return for efficient. The level of risk an investor would accept is dependent on their risk tolerance. Fig 2.5 shows an example of the CML together with the efficient frontier.
Figure 2.5: Capital market line
Source: Ayodeji and Ingram (2015:46)
Figure 2.5 above shows the capital market line drawn tangent to the efficient frontier. The efficient portfolio is shown by the point super-efficient portfolio. According to Dayala, (2012) CML intercepts at the risk free return which has a standard deviation of zero and is tangent at Markowitz’ efficient frontier, as a result it dominates the remainder of Markowitz efficient frontier in terms of risk reward features. The efficient portfolio with all risky assets held by all investors at equilibrium is reflected by point of tangency.
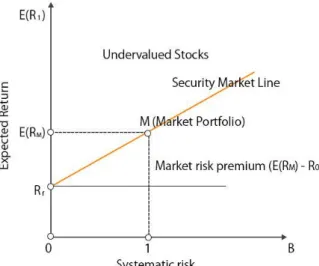
This single factor model ignores real world complexities but give us an intuitive insight into the nature of equilibrium within capital markets. Subsequently, leading to development of the Security Market Line (SML) which describe the equilibrium relationship between risk and expected return for both individual assets and portfolios respectively. Below is an SML graph which shows the risk and return relationship. Investors should buy undervalued stocks and sell overvalued stocks.
Figure 2.5: Security market line
Source: Dybvig, P. H., & Ross, S. A. (1985:16)
According to Mossin (1966) asset prices that are in equilibrium will adjust so that investors can achieve their desired point on the market line however, this is only if the portfolio is completely diversified. The SML focuses on individual stocks and the appropriate measure would be beta as it relates to an asset contribution of risk to a portfolio. The beta of a security is calculated by using covariance returns of the underlying asset i and the market. The SML uses beta to model the relationship between expected return and risk of asset. Alternatively, the CML concentrates on a portfolio of risky assets by measuring the total risk of a portfolio relative to the total risk of the market.
The CAPM was developed to determine the impact of risk adjusted returns on stocks in efficient financial markets. It predicts what a particular asset expected return should be relative to its risk and the market return. CAPM is a single factor model because there is only one relevant risk measure of this model which is the beta coefficient. Herding behaviour is witnessed when then beta coefficient is either high or low.
2.2.6 Arbitrage Pricing Theory (APT)
inefficient, allowing investors to make riskless profits without making an initial investment. For example, if a stock is overpriced in the market, an arbitrageur will sell the overpriced stock and purchase a similar lower priced stock in the market. This results in asset prices reverting back to equilibrium whereby mispriced stocks adjust for market inefficiencies. This theory contradicts CAPM which states that holding the market portfolio is the optimal mean-variance portfolio.
The Arbitrage Pricing Theory (APT) was developed predominantly by Ross (1976). It is an asset pricing model in which every investor believes that the returns of capital assets can be modeled as a linear function of various macro-economic factors. Ross argues that if equilibrium prices offer no arbitrage opportunities over fixed portfolios of the assets, then the expected returns on the assets are approximately linearly related to the macro-economic factors.
The APT theory suggests that rational investors undo price deviation (Ross, 1976). The arbitrage earned by investors is derived from the discrepancies between the fundamental values of a stock with its market price. It is an alternative method for the pricing of securities which addresses issues of identifying the market proxy. APT separates risk components that find that market risk is not the only systematic risk and explain long-term average returns. It seeks to identify which systematic factors of market risk determine the variation in assets returns thereby assisting investors and managers in understanding which variables are most powerful in explaining assets returns. The APT model provides investors with the opportunity to develop intuitive models that are absent from CAPM due to its restrictive assumptions. Chen, Ross and Roll (1986) suggest the various macro-economic factors that should be incorporated into the model. The significant risk factors when determining stock market returns are listed below:
1. The industrial production (indication of future cash flow). 2. Inflation.
3. The yield spread between low yield and government bonds. 4. The slope of the term structure of the interest rate (yield curve).
The APT permits businesses and investors to recognise various attributions of securities returns and their relative impact in determining these asset returns (Modigliani & Pogue, 1988). APT
follows the law of one price which states that two assets that tolerate identical levels of risk cannot sell at dissimilar prices.
A benefit of APT is that it identifies the unexpected portion of returns that are not explained by CAPMs beta. Portfolio managers are faced with the decision of what their preferred risk exposures are for their clients. In this regard, Roll and Ross (1984) argue that if all investors were to use the same investing strategy, markets would not function. This permits portfolio managers to segment risk and actively manage uncertainties through predicting stock price movements.
The above models are based on the notion of the efficient market hypothesis. These theories suggest that investors or managers can only outperform the market if they diversify their portfolios by using assets which are perfectly uncorrelated. However, Damodaran (2010) suggests that managers have got two kinds of abilities, selectivity (stock picking) ability and timing ability. Managers or investors can acquire potential gains if they time the market correctly so as to switch between asset classes, investment styles or sectors.
2.2.7 Comparison of the MPT models
Model MVO CAPM APT
Originator(s) Markowitz (1952) Treynor (1961), Sharpe (1964), Linter (1965) and Mossin (1966) (independently)
Ross (1976)
Contributions -The first model on portfolio theory which
conceptualises on diversification
-An expansion of the MVO which introduced valuation of systematic risk
-Was later modified by Sharpe (1964) to make it more
practically easier and operational
-In addition to market risk, there are more variables to consider when pricing assets such as investor
confidence, inflation and interest rates
-The model is based on less restrictive assumptions Risk measure Standard deviation Beta Beta
Similarities
Differences
-Based on the assumptions of EMH
-Single model for asset pricing -Formula: 𝐸(𝑟𝑝)=Σ𝑤𝑖𝑛𝑖=1𝐸(𝑟𝑖) - Based on the assumptions of EMH
-Single model for asset pricing
-Formula: (r) = rf +b (rm - rf)
-Based on the assumptions of EMH though less restrictive
-Multi-factor model for asset pricing
-There is no arbitrage -Formula: (r)= = rf + b1 (factor 1) + b2 (factor 2) + b3 (factor 3) 2.3 Rolls Critique
CAPM and APT are based on the belief that investors are rational and consider all available information when making decisions. Investment markets are therefore efficient, reflecting all available information in security prices (Fama & French, 2004). In this regard Roll (1977) studies have found that it is impossible to create or rather observe a truly diversified market portfolio. CAPM has been criticized because of its restrictive assumptions that expected returns are based on historical variables. For that reason, it cannot be used reliably to predict an assets performance in the future. Studies on CAPM have mostly been conducted on stock markets including the Morgan Stanley Capital International (MSCI) world index and Standard and Poor’s 500 (S&P500) index when constructing market proxies. Roll (1977) pointed out that the market portfolio does not only include equities and other tradable assets for example, bonds and property, and non-tradable assets which include human capital.
In addition, Roll (1977) argues that unless the market portfolio is known with confidence, CAPM cannot be accurately tested. This is primarily due to the inaccuracy of beta coefficients which can be attributed to either an incorrect specified market portfolio or to a weak model. Roll (1978) believes that an incorrect beta coefficient results in problems with the benchmark proxy which is used to price an asset. The equations that make up the CAPM are highly sensitive to the initial variables hence a small change in the market rate of return can have a large impact on the solution set.
Evidence has been found which contradicts the Efficient Market Hypothesis (EMH) and these are referred to as market anomalies. Various anomalies have shown results inconsistent with the implying that EMH failed to depict trading operations in real world. The presence of these market anomalies has been documented extensively for the last two decades in financial markets. Behavioural finance is a market anomaly which led to the development of herding behaviour.
2.4 Behavioural Finance
2.4.1 Background of Behavioural Finance
Efficient Market Hypothesis (EMH) is the base for many financial theories. EMH is an investment theory based on the belief that investors are rational and consider all available information when making investment decisions. Investment markets are efficient, reflecting all available information in security prices (Fama & French, 2004). Traditional finance theorists hold a perspective that any mispricing created by irrational traders, will create attractive investment opportunities which will be quickly capitalized by the rational traders and the mispricing will be corrected (Boortz & Jurkatis, 2013). Behavioural finance theorists argue that the strategies required to correct the mispricing can be costly thus, resulting the mispricing to be unattractive.
Many studies have found long-term historical variables in securities markets that contradict the efficient market hypothesis and cannot be captured reasonably in models based on perfect investor rationality. These researchers have discovered evidence of irrationality amongst investors and behavioural finance tries to fill the gap (Shiller, 1995). De Bondt and Thaler (1985) introduced the phenomena of behavioural finance. Behavioural finance models were developed to explain investor behaviour and market anomalies when rational models provide insufficient explanations. The theory of behavioural finance has tested the existence of overreaction in the market and found that investors systematically overreact to unexpected news resulting in weak form inefficiencies in the stock market (Thaler. 2005).
Behavioural finance believes in the existence of limits to arbitrage in the stock market, which allows investor irrationality to have long lived impact on stock prices (Shleifer, 2000). In an