Introduction
Testing procedures are currently widely used by coaches to eval-uate the effect of training programs, ergogenic aids, or nutrition on physiological responses to exercise. With the advances in sport sciences, trainers can assess training status of athletes from the determination of various indices. Nevertheless, certain methodological considerations have to be taken into account to ensure good measurement accuracy. Testing procedures have to be valid, accurate and reliable.
Poor reliability in performance could lead to misinterpretations of the results of a study by investigators and/or coaches. In the case of a longitudinal study, trainers and researchers have to
use a kind of test which accurately assesses the training status of an athlete and its modification over a training season. Thus, the reproducibility of the measurement has to be verified. In this way, Jeukendrup et al. [11] attempted to determine the most liable type of performance test in cycling by comparing the re-producibility of 1) Constant work-load test (i.e Constant Power Test; CPT), 2) a test in which a fixed amount of work is to be per-formed as fast as possible (i.e. Constant Work Test; CWT), and 3) a test setting with a given time during which the highest amount of work is to be developed (i.e. Constant Time Test; CTT). They found that CPT is less reliable than CWT and CTT, although it is commonly used in the laboratory. It is generally accepted that CPT provides variable results from one trial to another [2,11,12, 15,17]. Conversely, a good reproducibility of the performance Abstract
A variety of testing procedures are used to assess the effects of particular treatments on the training status of athletes. The pres-ent study aims to investigate the reproducibility of selected tests in swimming. Sixteen trained swimmers performed three kinds of test: 1) Constant Distance Test (CDT), 2) Constant Time Test (CTT), and 3) Constant Velocity Test (CVT). The analysis of the reproducibility was based on a test-retest procedure. The test-re-test performances were highly correlated for the three kinds of test (r = 0.98, 0.98, and 0.93 for CDT, CTT and CVT, respectively). The mean Coefficient of Variation (CV) was computed between test-retest for each subject and each procedure. A repeated measures one-way ANOVA showed that CVT was significantly less reliable (CV = 6.46 ± 6.24 %) than CDT and CTT (CV = 0.56 ±
0.60% and 0.63 ± 0.54 % respectively) (p < 0.001). Psychological factors and a lack of familiarity with CVT (not extensively used during training session) could explain its greater variability. Thus, CDT and CTT seem to be the most reliable tests to detect the smallest meaningful change in the training status of swimmers. Post-hoc power calculations of the experimental de-sign showed the sample size would have to increase to 80, 113, and 228 subjects for CWT, CDT and CPT respectively, to reach a power of 80 %. The minimal detectable differences have to be cal-culated to ensure a real effect of a particular treatment on a group of swimmers, according to the kind of test used.
Key words
Reliability · constant distance test · constant time test · constant velocity test
T
rai
ning
&
T
est
ing
623 Affiliation Laboratoire d’Etudes de la Motricite Humaine, Faculté des Sciences du Sport, Université de Lille 2, France Correspondence Michel Sidney · Faculté des Sciences du Sport · 9 rue de l’Université · 59790 Ronchin · France · Phone: + 33 3 20 88 73 66 · Fax: + 33 3 20 88 73 63 · E-mail: [email protected]Accepted after revision:June 4, 2005 Bibliography Int J Sports Med 2006; 27: 623 – 628 © Georg Thieme Verlag KG · Stuttgart · New York · DOI 10.1055/s-2005-865814 · Published online August 30, 2005 · ISSN 0172-4622 M. Alberty M. Sidney F. Huot-Marchand J. Dekerle L. Bosquet P. Gorce G. Lensel
Reproducibility of Performance in Three Types of
Training Test in Swimming
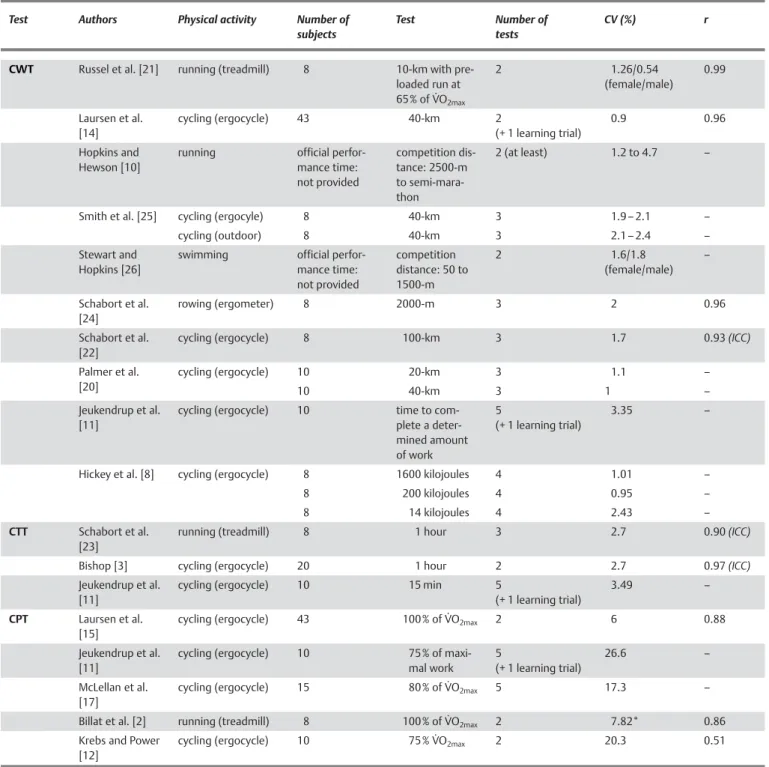
has been reported for CWT and CTT. Table1presents the results of the different studies investigating reproducibility of perfor-mance of such kinds of tests.
The procedure to assess the training status of an athlete must take into account the specificity of the activity [5]. In swimming, CWT, CTT, and CPT are widely used to assess the training status of
the swimmers [6, 7,19, 28, 30 – 32]. Nevertheless, there is a lack of information about the reliability of such tests in swimming. Hence, the aim of this study was to test the reproducibility of the CPT and to compare it with those of CWT and CTT in swimming. It was hypothesised that the reproducibility of CWT and CTT are higher than that of CPT in swimming.
Table1Results of some studies on the reproducibility of performance on different type of tests in various physical activities
Test Authors Physical activity Number of
subjects
Test Number of
tests
CV (%) r
CWT Russel et al. [21] running (treadmill) 8 10-km with
pre-loaded run at 65% of V˙O2max 2 1.26/0.54 (female/male) 0.99 Laursen et al. [14] cycling (ergocycle) 43 40-km 2 (+ 1 learning trial) 0.9 0.96 Hopkins and Hewson [10]
running official
perfor-mance time: not provided competition dis-tance: 2500-m to semi-mara-thon 2 (at least) 1.2 to 4.7 –
Smith et al. [25] cycling (ergocyle) 8 40-km 3 1.9 – 2.1 –
cycling (outdoor) 8 40-km 3 2.1 – 2.4 –
Stewart and Hopkins [26]
swimming official
perfor-mance time: not provided competition distance: 50 to 1500-m 2 1.6/1.8 (female/male) – Schabort et al. [24] rowing (ergometer) 8 2000-m 3 2 0.96 Schabort et al. [22]
cycling (ergocycle) 8 100-km 3 1.7 0.93(ICC)
Palmer et al. [20] cycling (ergocycle) 10 10 20-km 40-km 3 3 1.1 1 – – Jeukendrup et al. [11]
cycling (ergocycle) 10 time to
com-plete a deter-mined amount of work 5 (+ 1 learning trial) 3.35 –
Hickey et al. [8] cycling (ergocycle) 8 1600 kilojoules 4 1.01 –
8 200 kilojoules 4 0.95 –
8 14 kilojoules 4 2.43 –
CTT Schabort et al.
[23]
running (treadmill) 8 1 hour 3 2.7 0.90(ICC)
Bishop [3] cycling (ergocycle) 20 1 hour 2 2.7 0.97(ICC)
Jeukendrup et al. [11]
cycling (ergocycle) 10 15 min 5
(+ 1 learning trial)
3.49 –
CPT Laursen et al.
[15]
cycling (ergocycle) 43 100% of V˙O2max 2 6 0.88
Jeukendrup et al. [11]
cycling (ergocycle) 10 75% of
maxi-mal work 5 (+ 1 learning trial) 26.6 – McLellan et al. [17]
cycling (ergocycle) 15 80% of V˙O2max 5 17.3 –
Billat et al. [2] running (treadmill) 8 100% of V˙O2max 2 7.82* 0.86
Krebs and Power [12]
cycling (ergocycle) 10 75% V˙O2max 2 20.3 0.51
CWT: Constant Power Test, the performance measured is the time to perform the determined amount of work or to cover a distance; CTT: Constant Time Test, the per-formance measured is the work or the distance completed in a given amount of time; CPT: Constant Power Duration, the perper-formance measured is the time to exhaustion. ICC corresponds to the Intraclass Coefficient of Correlation* the data of Billat et al. [2] have been treated according to the process of the present study.
T
rai
ning
&
T
est
ing
624Material and Methods Subjects
Sixteen well trained swimmers (20.7 ± 2 years; four females and twelve males) volunteered for this study. Height, body mass and arm span values were, 179 ± 8 cm and 170 ± 7, 70 ± 8 and 61 ± 5 kg, and 185 ± 7 and 172 ± 7 cm, for male and female respec-tively. They had been training for 11 ± 2 years, at a frequency of 6 ± 2 training sessions per week, prior to the study being con-ducted. Their performances in the 400 m front crawl stroke cor-responded to 75 ± 3 % of the world record on the short course pool, with values of 75 ± 4 % and 76 ± 1 % for female and male, re-spectively. Before the protocol, they were informed of the proce-dure and gave written consent to participate and then under-went a complete medical examination. During the testing period, the subjects also performed their training programs between the test days, but adapted the intensity and total volume of training. Testing procedures
The tests were performed in a 25-m indoor swimming pool, us-ing the front crawl stroke, and the start of the trials took place in the water. During all the tests, environmental conditions were standardised (water temperature was fixed at 298). The subjects performed all the trials with at least 24 h of rest between each trial to minimise the fatigue effects. To avoid any influence of cir-cadian variance, they performed their trials at the same time of the day. They were also asked to maintain their normal diet throughout the study. For the day prior to each exercise trial, the ingestion of alcohol and caffeine was not allowed. All sub-jects performed three trials of each type of test adapted from the constant work, constant time, and constant power laboratory test (CWT, CTT, and CPT) used in cycling and running. The first trial corresponded to a learning trial to accustom the swimmers to the conditions of the different types of performance tests and was not included in the statistical analysis [17,18]. Thus, the sta-tistical analysis was based on a test test procedure. The re-maining trials were realised by subjetcs in a randomized order. The swimmers were asked to carry out their own warm-up and to repeat the same one before each trial of the same type of test. The subjects were encouraged during each trial to perform as well as possible in each repetition. All tests were designed to last the same duration to allow comparison of the reproducibility of the results.
Protocol 1: The Constant Distance Test (CDT)
This test was an adaptation of the Constant Work Test (CWT). Subjects were required to cover 400-m as fast as possible. The mean velocity over this distance has been shown to be highly correlated to the Maximal Aerobic Velocity in swimming [16]. The performance measured corresponded to the time spent per-forming a trial (expressed in second s).
Protocol 2: The Constant Time Test (CTT)
For this type of test, the subjects had to cover the longest dis-tance possible in a five-minutes time trial. During these trials, the swimmers were unaware of the elapsed time. An experi-menter walked along the edge of the pool at the level of the swimmer’s head, which was the anatomical reference to mea-sure the distance covered. When the five minutes had elapsed, the operator stopped at the location of the swimmer’s head at
that precise moment. Then the performance measured corre-sponded to the distance travelled by the swimmers within five minutes, expressed in meters (m).
Protocol 3: The Constant Velocity Test (CVT)
This test was an adaptation of the Constant Power Test (CPT) [10]. Subjects were required to swim at a Constant Velocity (CVT), un-til exhaustion. Despite the randomised order of the tests, at least one CDT preceded the first CVT. For instance, to determine the imposed velocity, mean velocity (V400in m · s–1) in the CDT was calculated from the ratio between the distance (400 m) with the time spent covering it. The swimming velocity corresponded to 100 % of V400and was imposed by a visual pacer with flashing lights (Baumann, Cologne, Germany). This apparatus is com-posed of an independent computer and a row where lights are placed every 5 m from the wall of the pool. The firing rate of the lamps was directed via an independent computerised control unit. The swimmers were instructed to keep their feet above the active lamp and the test continued until the swimmer’s head showed behind the active lamp. Some swimmers had difficulties to adapt their own velocity instantaneously to the imposed one, due to the space which separated each light. Thus two operators walked on each edge of the pool at the prescribed velocity so that the swimmers could see them. Some marks had been laid out ac-cording to the lamps of the visual pacer, and the corresponding split times were provided to the operators. To ensure that opera-tors imposed the correct velocity, they had a period of familiar-isation for each velocity before each test. The swimmer was asked to maintain his feet at the level of the pacer. When the ex-perimenter’s feet were at the same level as the swimmer’s head, the test was stopped. Measurement of performance is the time from the start of the trial until the point of exhaustion, expressed in seconds (s).
Statistical analysis
As the first trial was devoted to learning, the statistical analysis was conducted on the second and the third trials.
Means and standard deviations were used to represent the aver-age and the typical spread of values of the performance for CDT, CTT, and CVT. The Normal Gaussian distribution of the data was verified by the Shapiro-Wilk’s test. Homoscedasticity was tested by the Levene test. The compound symmetry, orsphericity,was checked by the Mauchley test [34]. Sphericity is defined as the assumption that, in repeated measures designs, the variance among the repeated measurements is the same (homogeneity of variance), and that the relationships or correlations among all the combinations of repeated measurements are the same (ho-mogeneity of covariance). When the assumption of sphericity was not met, the significance of F-ratios was adjusted according to the Greenhouse-Geisser procedure, when the epsilon correc-tion factor was < 0.75, or according to the Huyn – Feld procedure, when the epsilon correction factor was > 0.75; [29]. A paired Stu-dent’s “t” test was performed to detect the presence of a system-atic bias between trials. The test-retest correlation of the mea-surements between the two tests was evaluated through the cal-culation of the Pearson’s product moment (r). The within-subject variability was calculated as the Standard Deviation (SD) of an individual’s repeated measurement, expressed as a percent of their individual mean tests score [9]. An overall CV was
calculat-T
rai
ning
&
T
est
ing
625ed as the mean ± SD of the individual’s CV over the two repeti-tions in each type of test. A one-way analysis of variance (ANOVA) was then used to compare the mean CV values of the three types of test. Pairwise comparisons were made with the Newman-Keuls post-hoc test. The threshold for significance was set at the 0.05 level of confidence. This part of the statistical anal-ysis was realised with the use of the STATISTICA 6.0 software for PC.
Secondly, the power (p) of the experimental design (t-test) was calculated according to the method presented by Bausell and Li [1]. The power is the ability of a test to correctly reject a false null hypothesis and thus allows the experimenters to estimate the probability of the type II error (i.e an incorrect decision to accept the null hypothesis). Based on the power value, the investigators can decide whether additional subjects are needed before reject-ing or acceptreject-ing the null hypothesis and thus reach a sufficient power (a power value p of 0.8). In this way, nestrepresents the number of subjects in the sample required to reach a power of 0.8. However, a great majority of studies in physical activities do not show considerable numbers of subjects. Thus, the calculation of the power design allows determination of the smallest differ-ence (diff in percentage [%]) that the experimental design can de-tect with a reasonable sample size. This value represents the minimum value which can be found to lead to the statement that there is a significant test-retest difference on the dependant vari-able studied for a group of subjects with a power value of 0.8. This procedure was performed for CDT, CTT, and CVT.
Results
The Constant Distance Test
The mean time values for CDT were 292.79 ± 20.43 s and 294.13 ± 20.63 s for the first and second trials respectively. This resulted in a mean CV value of 0.56 ± 0.60 %. The values of indi-vidual CV ranged from 0.05 % to 1.99 %. The correlation coefficient between the performance values of the first and the second trials was 0.98. No significant difference was observed between the first and the second trials. The power of the t-test was then 0.22. To reach a power value of 0.8, the sample (nest) must in-clude at least 80 subjects. The minimum detectable difference value (diff) was 1.06 %.
The Constant Time Test
The mean distances covered by the swimmers during five min-utes were 408.93 ± 27.01 m and 410.25 ± 26.54 m for the first and the second trial respectively. These performances did not differ significantly. The mean CV value was 0.69 ± 0.54 %, and in-dividual CV values ranged from 0% to 1.99 %. The correlation co-efficient value was 0.98 between the performances of the two trials. The statistical power of t-test for CTT was 0.17. To reach a power value of 0.8, the sample (nest) must include at least 113 subjects. The minimum detectable difference value (diff) was 0.89 %.
The Constant Velocity Test
The mean values of time to exhaustion were 286.93 ± 73.79 s and 281.15 ± 82.52 s for the first and the second trial respectively. These mean results yielded a mean value of CV of 6.46 ± 6.24 %.
Individual CV values ranged from 0.27 to 20 %. The retest coeffi-cient of correlation was 0.93. No significant difference was ob-served between the two trials. The power value of thet-test was 0.11. The sample of subjects (nest) needed to reach a power value of 0.8 was 228. The minimum detectable difference value (diff) was 6.6 %.
Both CDT and CTT showed significant lower mean values of CV than CVT (p < 0.01). The mean values of CV for CDT and CTT did not differ significantly.
Discussion
The aim of this study was to compare the reproducibility of the measurement of performance carried out in three types of test used in swimming. As the planning of a training program over a season is based on regular checking of the training status of the swimmer, reliability in measurement is vital. Thus, the tests used have to be the most sensitive to detect the smallest meaningful modification in the training level.
The present study is the first which aims to compare the repro-ducibility of CVT, CDT and CTT in swimming. The main results of this study showed the poorer reproducibility of CVT, in compar-ison with CDT and CTT, as previously observed in other physical activities. The within-subject variability for CDT and CTT was sig-nificantly lower (mean CV values of 0.56 ± 0.6 % and 0.63 ± 0.54 % respectively) than for CVT (mean CV value of 6.46 ± 6.24 %). The retest correlation was also higher for CDT and CTT (r = 0.98 for both) than for CVT (r = 0.93).
A continuous exercise at a constant power or velocity until ex-haustion is widely used as a performance test in the laboratory to assess the training status of athletes. The within-subject vari-ability in swimming is in accordance with previous studies [2, 15] which propose protocols at comparable intensities in cycling and running respectively (mean values of CV of 6 % and 7.82 %). In contrast, the mean CV value of the current study was less than those previously reported by Krebs and Power [12], McLellan et al. [17], and Jeukendrup et al. [11], (means CV of 20.3 %, 17.3 %, 26.6 %, respectively) which proposed protocols at submaximal intensities. According to the whole results, it can be supposed that the lesser the intensity imposed, the higher the within-sub-ject variability of the results. Tests at submaximal intensity could require more motivation to reach a complete state of exhaustion, which might induce a greater variability in the performance re-sults. CVT at different intensities has to be conducted on the same population to assess this supposition.
CDT and CTT are strongly reproducible. The mean values of CV and the values of Pearson’s moment product suggest that CDT and CTT are reliable and sensitive to the smallest meaningful var-iation of the physical fitness of the swimmers. Whatever the physical activity, the CV rarely exceeds 4 % (Table1). These results do not seem to be affected by the distance (or work) to be cov-ered or the length of the time trial. Nevertheless, our mean CV values are slightly less than those of the previous studies. This could be explained by the environmental conditions of the proto-col, which might give some information to the swimmers [4] (i.e.
T
rai
ning
&
T
est
ing
626the count of pool lengths realised; so-called informative factor) that an athlete on a motionless ergocycle cannot establish. For example, the tests of the current study could have been per-formed in a swimming flume. Further studies could be conduct-ed to determine the influence of informative factor on the per-formance (via an analysis of its variability, for example). It seems that the reliability is higher when the end of the test is set beforehand, as already mentioned by Jeukendrup et al. [11]. Several factors can explain the greater variability of CVT pared to CTT and CDT. Firstly, CVT does not mimic normal com-petitive situations in which athletes compete over a set distance [22]. This is, however, a type of exercise not used extensively dur-ing traindur-ing, when the majority of the exercises are based on a set distance or on a certain time, during which the maximal distance is to be covered. Thus, the fact of the swimmers being unused to performing CVT, despite the learning trial, could contribute to the variability of their performances. Secondly, the swimmer does not have a concrete objective in an open-ended exercise. Psychological factors may contribute in significant performance changes, independent of the experimental manipulation. In this way, Wilmore [33] suggested that these factors could affect the amount of work that an athlete can deliver. Motivation, boredom and/or monotony might influence the will of the swimmer to reach a complete exhaustion state in an open-ended exercise compared to a test where the end-point is known [11]. This vari-ability leads to the conclusion that time-to-exhaustion tests pre-vents any prediction in terms of exercise duration at a precise imposed intensity [27] and prevents coaches from reaching con-clusions about an unquestionable enhancement of the physical fitness, when only one swimmer is considered (CV ranging from 0.27 to 20 %). Nevertheless, the absence of any systematic bias between test and retest suggests that, on a group of swimmers, CVT is suitable to analyse the effects of any constraints on the time to exhaustion at an imposed velocity. Moreover, CVT en-sures that the swimming intensity is well controlled during tests, whatever the constraint imposed.
Even if CDT is a closed-loop task, its greater reproducibility could also be explained by its characteristics, which are identical to the competition event. Thus, subjects can more easily repeat an ex-ercise to which they are accustomed. Nevertheless, as already underlined by Stewart and Hopkins [26], who analysed competi-tion results which were spaced 20 days apart (mean CV of 1.7 %), the very small within-subject variations in the 400 m are suffi-cient to strongly influence the performance and thus, determine the final place of the swimmer in competition. It seems relevant to determine the causes of such variation considering the differ-ent compondiffer-ents of the trials, through the time spdiffer-ent to swim, and turn, and start. Such analysis was not conducted in the pres-ent study and represpres-ents a perspective for further investigations. The good CTT reliability could also be explained by the use of swimmers practicing this kind of exercise during training ses-sion.
The second main finding of this study concerns the post-hoc power calculation of thet-test. According to Bausell and Li [1] the statistical power is computed before the study’s final data are collected. It involves hypothesising the smallest effect size which is most likely to occur based on the study’s theoretical
and empirical context. It ensures, with a sufficient power (80 %), that there will be an effect, or a significant difference in perform-ance of an experimental group induced by a training program or other treatment. However, no study provides any value of effect size which can be expected to occur in a procedure based on a test-retest protocol in physical activities. Thus, the statistical power process is conducted in an inverse manner, i. e. the power of the experimental design is determined in a first step, after the data collection. This process was carried out by Kyle et al. [13] on three repetitions of an incremental protocol and by McLellan et al. [17] on five repetitions of time to exhaustion at submaximal intensity. The post-hoc power calculations of the present study showed lower values than those of McLellan et al. [17]. The num-ber of trials could explain this difference. However, because of the high intensity of the tests in the present study, the overall number of the trials, and to avoid any loss of interest for the ex-perimental design, the swimmers only performed three trials of each type of test. The low power of CVT could be explained by greater typical spread of values of the performance, compared to those of CDT and CTT.
As underlined by McLellan et al. [17], a sample size of 16 subjects should be adequate to perform a study in physical activity. How-ever, whatever the type of performance test-retest considered, the statistical power of the experimental design (t-test) was in-sufficient to ensure that there was no significant difference be-tween the second and the third trial. Hence, theoretical sample size was determined. The most powerfult-test required the low-est sample size (n = 80 for CDT). In this way, CVT requires a very great number of subjects (n = 228). The limited number of repe-titions could explain these values which are higher than those of Kyle et al. [13] and McLellan et al. [17]. Nevertheless, such sample size is rarely used in physical activity studies. In this way, the minimum detectable difference (diff) was determined. Due to the typical value spread of the performance for CVT, the largest diff value was found in this test. In practical terms, it means that if one were to study the effects of any constraint or treatment on the time-to-exhaustion in CVT at 100 % of V400on a group of 16 trained swimmers, at least a difference of 6.6 % of the value of the preconditioning time to exhaustion (which represents a dif-ference of 21 s) would have to be observed before considering that a true effect could be reliably detected. This value could serve as a basis for future investigations, the aim of which would be to study the effects of any constraints on performance by us-ing CVT.
Conclusion
To conclude, CDT and CTT seem to be highly reliable. They allow detection of the smallest meaningful changes in physical fitness of swimmers and should be sensitive enough to detect any effect of diet regime or other treatment. If the variability of time to ex-haustion during CVT prevents us from concluding on any modifi-cations in the training status of a swimmer, this kind of test of-fers the advantage to the experimenter of analysing the effects of any constraint on performance in controlled experimental conditions (i.e. without any variation in the imposed swimming intensity) on a group of swimmers. The calculation of the mini-mal detectable difference in the present study could serve as a
T
rai
ning
&
T
est
ing
627basis for further investigations, whose aim would be to analyse the effect of any treatment on a sample of swimmers.
Reference
1Bausell RB, Li Y-F. Power Analysis for Experimental Research. Cam-bridge United Kingdom: CamCam-bridge University Press, 2002: 376 2Billat V, Renoux JC, Pinoteau J. Reproducibility of running time to
ex-haustion at V˙O2maxin subelite runners. Med Sci Sports Exerc 1994; 26: 254 – 257
3Bishop D. Reliability of a 1-h endurance performance test in trained female cyclists. Med Sci Sports Exerc 1997; 29: 554 – 559
4Chollet D, Moretto P, Pelayo P, Sidney M. Energetics effects of velocity and stroke rate control in non-expert swimmers. In: Troup JP, Hol-lander AP, Strasse D, Trappe SW, Cappaert JM, Trappe TA (eds). Swim-ming Science VII. London: E & F. N. SPON, 1996: 172 – 176
5Dekerle J, Dupont L, Caby I, Marais G, Vanvelcenaher J, Lavoie JM, Pe-layo P. Ventilatory thresholds in arm and leg exercises with spontane-ously chosen crank and pedal rates. Percept Motor Skills 2002; 95: 1035 – 1046
6Dekerle J, Sidney M, Hespel JM, Pelayo P. Validity and reliability of critical speed, critical stroke, and anaerobic capacity in relation to front crawl swimming performances. Int J Sports Med 2002; 23: 93 – 98
7Fernandes RJ, Cardoso CS, Soares SM, Ascensao A, Colaco PJ, Vilas-Boas JP. Time limit and VO2 slow component at intensities corre-sponding to VO2max in swimmers. Int J Sports Med 2003; 24: 576 – 581
8Hickey MS, Costill DL, McGonell GK, Widrick JJ, Tanaka H. Day to day variation in time trial cycling performance. Int J Sports Med 1992; 13: 467 – 470
9Hopkins WG. Measures of reliability in sports medicine and science. Sports Med 2000; 30: 1 – 15
10Hopkins WG, Hewson DJ. Variability of competitive performance of distance runners. Med Sci Sports Exerc 2001; 33: 1588 – 1592 11Jeukendrup A, Saris WH, Brouns F, Kester AD. A new validated
endur-ance performendur-ance test. Med Sci Sports Exerc 1996; 28: 266 – 270 12Krebs PS, Power SK. Reliability of endurance tests (abstract). Med Sci
Sports Exerc 1989; 21: S10
13Kyle SB, Smoak BL, Douglass LW, Deuster PA. Variability of responses across training levels to maximal treadmill exercise. J Appl Physiol 1989; 67: 160 – 165
14Laursen PB, Shing CM, Jenkins DG. Reproducibility of a laboratory-based 40-km cycle time-trial on a stationary wind-trainer in highly trained cyclists. Int J Sports Med 2003; 24: 481 – 485
15Laursen PB, Shing CM, Jenkins DG. Reproducibility of the cycling time to exhaustion at V˙O2peak in highly trained cyclists. Can J Appl Physiol 2003; 28: 605 – 615
16Lavoie JM, Montpetit RR. Applied physiology of swimming. Sports Med 1986; 3: 165 – 189
17McLellan TM, Cheung SS, Jacobs I. Variability of time to exhaustion during submaximal exercise. Can J Appl Physiol 1995; 20: 39 – 51
18Murray R, Seifert JG, Eddy DE, Paul GL, Halaby GA. Carohydrate feed-ing and exercise: Effet of beverage carbohydrate content. Eur J Appl Physiol 1989; 59: 152 – 158
19Olbrecht J, Madsen O, Mader A, Liesel H, Hollman W. Relationship be-tween swimming velocity and acid lactic concentration during con-tinuous and intermittent training exercise. Int J Sports Med 1985; 6: 74 – 77
20Palmer GS, Dennis SC, Noakes TD, Hawley JA. Assessment of the re-producibility of performance testing on a air-braked cycle ergometer. Int J Sports Med 1996; 17: 293 – 298
21Russel RD, Redmann SM, Ravussin E, Hunter GR, Enette Larson-Meyer D. Reproducibility of endurance performance on a treadmill using a preloaded time trial. Med Sci Sports Exerc 2004; 36: 717 – 724 22Schabort EJ, Hawley JA, Noakes TD. A new reliable laboratory test of
endurance performance for road cyclists. Med Sci Sports Exerc 1998; 30: 1744 – 1750
23Schabort EJ, Hopkins WG, Hawley JA. Reproducibility of self-paced treadmill performance of trained endurance runners. Int J Sports Med 1998; 19: 48 – 51
24Schabort EJ, Hopkins WG, Hawley JA. High reliability of performance of well-trained rowers on a rowing ergometers. J Sports Sci 1999; 17: 627 – 632
25Smith MF, Davison RCR, Balmer J, Bird SR. Reliability of mean power recorded during indoor and outdoor self-paced 40-km cycling time trails. Int J Sports Med 2001; 22: 270 – 274
26Stewart AM, Hopkins WG. Consistency of swimming performance within and between competition. Med Sci Sports Exerc 2000; 32: 997 – 1001
27Vandewalle H, Vautier JF, Kachouri M, Lechevalier JM, Monod H. Work-exhaustion time relationship and critical power concept: A crit-ical review. J Sports Med Phys Fitness 1997; 37: 89 – 102
28Vilas-Boas JP, Lamares JP, Fernandes R, Duarte JA. Relationship be-tween anaerobic threshold and swimming critical speed determined with competition times. Abstracts book of the FIMS 9th European Congress of Sports Medicine. Porto, 1997: 88 – 91
29Vincent JW. Statistics in Kinesiology. 2nd ed. California State Univer-sity: Northridge Publisher, Human Kinetics, 1999
30Wakayoshi K, Ikuta K, Yoshida T, Udo M, Moritani T, Mutoh Y, Miyashi-ta M. Determining and validity of critical velocity as an index of swimming performance in the competitive swimmer. Eur J Appl Physiol 1992; 64: 153 – 157
31Wakayoshi K, Yoshida T, Ikuta Y, Mutoh Y, Miyashita M. Adaptations to six months of aerobic swim training. Changes in velocity, stroke rate, stroke length and blood lactate. Int J Sports Med 1993; 14: 368 – 372 32Wakayoshi K, Yoshida T, Kasai T, Moritani T, Mutoh Y, Miyashita M. A
simple method for determining critical speed as swimming fatigue threshold in competitive swimming. Int J Sports Med 1992; 13: 367 – 371
33Wilmore JH. Influence of motivation on physical work capacity and performance. J Appl Physiol 1968; 24: 459 – 463
34Winter EM, Eston RG, Lamb KL. Statistical analyses in the physiology of exercise and kinanthropometry. J Sports Sci 2001; 19: 761 – 775