This is the author’s version of a work that was submitted/accepted for pub-lication in the following source:
Zhang, Yuyu, Monroe, Gary, Shailer, Gregory, Gasbarro, Dominic, & Cullen, Grant
(2013)
Aligning off-balance sheet risk, on-balance sheet risk and audit fees: a PLS path modelling analysis. In
Accounting and Finance Association of Australia and New Zealand Annual Conference 2013, 2-6 July 2013, Perth, WA. (Unpublished)
This file was downloaded from: http://eprints.qut.edu.au/74335/
c
Copyright 2013 The Author(s)
Notice: Changes introduced as a result of publishing processes such as copy-editing and formatting may not be reflected in this document. For a definitive version of this work, please refer to the published source:
1
ALIGNING OFF BALANCE SHEET RISK, ON BALANCE
SHEET RISK AND AUDIT FEES:
A PLS PATH MODELLING ANALYSIS
2
Abstract
This study focuses on using the partial least squares (PLS) path modelling methodology in archival auditing research by replicating the data and research questions from prior bank audit fee studies. PLS path modelling allows for inter-correlations among audit fee determinants by establishing latent constructs and multiple relationship paths in one simultaneous PLS path model. Endogeneity concerns about auditor choice can also be addressed with PLS path modelling. With a sample of US bank holding companies for the period 2003-2009, we examine the associations among on-balance sheet financial risks, off-balance sheet risks and audit fees, and also address the pervasive client size effect, and the effect of the self-selection of auditors. The results endorse the dominating effect of size on audit fees, both directly and indirectly via its impacts on other audit fee determinants. By simultaneously considering the self-selection of auditors, we still find audit fee premiums on Big N auditors, which is the second important factor on audit fee determination. On-balance-sheet financial risk measures in terms of capital adequacy, loan composition, earnings and asset quality performance have positive impacts on audit fees. After allowing for the positive influence of on-balance sheet financial risks and entity size on off-balance sheet risk, the off-balance sheet risk measure, SECRISK, is still positively associated with bank audit fees, both before and after the onset of the financial crisis. The consistent results from this study compared with prior literature provide supporting evidence and enhance confidence on the application of this new research technique in archival accounting studies.
3
I. Introduction
This study focuses on using the partial least squares (PLS) path modelling technique in archival auditing research by replicating the data and research questions from prior bank audit fee studies (Fields et al. 2004; Cullen et al. 2012). In particular, with a sample of US bank holding companies for the period 2003-2009, we examine the associations among on-balance sheet financial risks, off-balance sheet risks and audit fees. We also address the pervasive client size effect, and the effect of the self-selection of auditors. The change of audit fee determinations over the onset of the GFC is also investigated.
Prior literature extensively investigates the audit fee determinations (Hay et al. 2006 and 2011). However, limited research has been done with regard to the role of off-balance sheet risks on audit fees. Off-balance sheet instruments have been widely used in the banking institutions since 1980s which have been identified as an effective tool to improve the entity’s liquidity and leverage initially before 2000 (Foley et al. 1999; Schwarcz 2004) but increasingly deemed as risky financial instruments with significant technical complexity, management discretion and information ambiguity after Enron’s collapse in 2001 (Chen et al. 2008; Barth et al. 2012). From an auditor’s point of view, the risks embedded in the off-balance sheet exposures can be associated with audit risk in several ways: (1) The technical and reporting complexity in off-balance sheet instruments lead to increased level of relevant misstatement risk; (2) the management have incentives to employ off-balance sheet tools to window dress financial statements; in case the management discretion is abused, this management discretion leads to increased control risk and misstatement risk (Healy and Wahlen
4
1999; Degeorge et al. 1999; Matsumoto 2002); and (3) high business risk associated with the off-balance sheet activities is also considered by auditors. Cullen et al. (2012) provide empirical evidence that off-balance sheet asset securitization risks are positively related to bank audit fees. Comparative to Cullen et al. (2012), we use asset securitization risk as the proxy for off-balance sheet risk to test the impact of off-balance sheet risks on bank audit fees and its change after the onset of the global financial crisis (GFC).
Auditors’ perceived audit risk associated with off-balance sheet risks is indirectly influenced by the entity’s on-balance sheet financial risk. On-balance sheet financial risks are a set of well-established audit fee determinants as summarized in Hay et al. (2006). Narrowing to the banking industry, Fields et al. (2004) establish a set of on-balance sheet financial risks representing the bank's capital adequacy, asset composition, asset quality and earnings performance, and market risk sensitivity. Subsequent bank audit fee studies find that the on-balance sheet financial risks are highly correlated and may lead to potential multicollinearity (Ettredge et al. 2011; Cullen et al. 2012), and additionally, there are high correlations among on-balance sheet financial risks and off-balance sheet financial risks (Cullen et al. 2012). In audit practice, auditors are required to evaluate audit risk based on the entity's overall business situation and financial status, including all aspects of risks from on-balance sheet items and off-balance sheet activities. Due to the fact that off-balance sheet activities are often used as a financial instrument to improve on-balance sheet leverage and liquidity, we argue that auditors should have considered on-balance sheet risks when evaluating audit risks associated with off-balance sheet items. Along with Cullen et al. (2012), we examine whether the on-balance sheet financial risk influence
5
off-balance sheet activities and further influence the association between audit fees and off-balance sheet securitization risks.
We employ the partial least squares (PLS) path modelling methodology to simultaneously re-examine the direct and indirect relationships among off-balance sheet risks, on-balance sheet financial risks and audit fees. In addition to the main research questions on the association between off-balance sheet securitization risks and audit fees and its change over the onset of the GFC, the PLS path modelling methodology allows for further analysis on the impact of bank size on other audit fee determinants and the endogeneity of auditor choice in a simultaneous picture. Entity size is deemed as a dominating audit fee determinant (Simunic 1980; Hay et al. 2006) and has pervasive impact on different aspects of the bank's operation and financial decisions, including risk-taken activities (Demsetz and Strahan 1997), liquidity strategies (Fields et al. 2004), off-balance sheet transactions (Cullen et al. 2012) and auditor choice (Hay et al. 2006). Auditor choice is a debating issue with regard to its endogeneity nature and self-selection proposition (Chaney et al. 2004; Francis et al. 2012). Aligning with prior literature, we examine the direct and indirect effects of entity size on audit fees, and the endogeneity of Big N auditor choice and its impact on audit fees.
The results confirm the dominating effect of size on audit fees, both directly and indirectly via its impacts on other audit fee determinants. By simultaneously considering the self-selection of auditors, we still find audit fee premiums on Big N auditors, which is the second important factor on audit fee determination. On-balance-sheet financial risk measures in terms of capital adequacy, loan composition, earnings and asset quality performance have positive impacts on audit
6
fees. After allowing for the positive influence of on-balance sheet financial risks and entity size on off-balance sheet risk, the off-balance sheet risk measure, SECRISK, is still positively associated with bank audit fees, both before and after the onset of the financial crisis.
We hope this study could have introduced an easily applicable research method, the PLS path modelling, in archival accounting research that provides an additional analytical tool for accounting and auditing researchers. By combining principal component analysis (PCA) and linear regression technique on one path model, the PLS approach is able to test interrelated hypothesized relations among multiple latent constructs in one comprehensive picture. In this study, in addition to the main research questions on the associations among off-balance sheet risks, on-balance sheet financial risks and audit fees, we also investigate the inter-linked relationships among bank size, auditor choice, financial risks and audit fees simultaneously so that all the direct and indirect effects of certain factor can be explicitly quantified to form the total effect. The consistent results from this study compared with prior literature can add some confidence on the application of this new research technique in archival accounting studies.
The remainder of the paper is organized as follows. Section II explains the suitability and advantages of PLS path modelling method in this audit fee study. Section III presents the literature review and empirical predictions. Section IV focuses on research method, and Section V presents the model validity and the test results. The study concludes in Section VI.
7
II. Why Do We Use the PLS Path Modelling Methodology
The PLS methodology has the ability to overcome difficulties that have confounded methods previously used in audit fees studies. First, it is hard to disentangle the true effect of a particular type of audit risk on audit fees when there are serious high correlations among the audit fee determinants. Prior literature following Simunic (1980) demonstrates that audit fees are associated with measures of client size, client risk and client complexity and are also subject to certain auditors' characteristics. Among them, client size, client complexity, client risk and auditor choice are often highly correlated (Hay et al. 2006). Client size, not only directly affects audit fees, but also has an indirect effect on audit fees via its impact on other independent variables, e.g., client complexity.1 Current research methodology with ordinary least squares (OLS) regressions cannot fully capture the total effect (direct plus indirect effects) of a particular determinant. This issue becomes particular critical in this study, in which bank financial risk measures are highly correlated with each other, and then further correlated with client size, auditor choice and off-balance sheet risk measures, leading to a potential multicollinearity problem.
The second issue is the endogeneity existed in the self-selection of auditor choice and the self-selection of engaging in off-balance sheet activities. Endogeneity is a prevailing issue in auditing research as pointed out in Hay et al. (2006), which overlaps but is
1
Investigations uncover that the competing results of Big N firms’ impact on audit fees may be sensitive to the definition of ‘large’ and ‘small’ for client size (Simunic 1980 vs. Palmrose 1986). This issue is examined by Carson et al. (2004) with a sample of Australian fee data for 1995-1999. They report that Big N firms receive premiums in the small client segment but not in the large client segment. They also find that audit fees are not linearly related to client size as is typically assumed in audit fee models. Their results suggest that failure to control the non-linearity between log of audit fees and log of client size can potentially result in misspecification of the model and misinterpretation of the results.
8
superior to the high correlations issue. An example is the effect of the existence of governance mechanisms on the demand for quality auditing, which increases audit fees due to a change in the assurance level provided by auditors (Eilifsen et al. 2001; Hay et al. 2006). Hay et al. (2006) identify that the differences in audit quality, the ability to provide non-audit services, and specialization can proxy for demand attributes that endogenously influence the empirical results of audit fee studies (Copley et al. 1994, 1995; Chaney et al. 2004).
High correlations among determinants and endogeneity are critical issues in bank audit fee determination. On a U.S. BHC sample of 2424 BHC-year observations for the period 2003-2009, Cullen et al. (2012) found that financial risk variables are highly inter-correlated and further correlated with client size, auditor choice and market risks; the interest variables, off-balance-sheet asset securitization risk variables, are also inter-correlated. Additionally endogeneity is suspected for the self-selection of Big N auditors as well as the self-selection of securitization activities.
Two approaches have been used to deal with Endogeneity problems in prior research. First, Heckman’s two-stage approach has been widely used to correct for self-selection issues in OLS audit fee models (Chaney et al. 2004; Knechel and Willekens 2006). Second, two-stage least squares regression analysis (2SLS) is used because of the simultaneity/joint determinations of audit fees and some of the other variables, e.g., non-audit service fees (Whisenant et al. 2003; Antle et al. 2006; Hay et al 2006b). However, although endogeneity is assumed to be corrected either with Heckman two-stage approach or 2SLS simultaneously determination models, certain limitations restrict their validity and usefulness in audit fee research. Recent studies on
9
self-selection bias in accounting research demonstrate that Heckman two-stage approach might be misleading if there is no solid theoretical and model justification for excluding independent variables from the first stage regression and multicollinearity could be a critical issue in application of the Heckman approach (Tucker 2010; Francis et al. 2012). Moreover it is difficult to apply both Heckman and 2SLS approaches simultaneously to solve more than one joint determination issue and self-selection issue together due to the complexity of two approaches.
We expect the methodology we used in this paper, the PLS path modelling, could shed some lights on the issues mentioned above. PLS is a component-based structural equation modelling technique that merges path analysis and factor analysis therefore allows researchers to simultaneously model the structural paths (the inner model relationships among latent variables) and measurement paths (the outer model relationships between latent variables and their manifest variables).
Compared with first-generation techniques such as multiple regression analysis, principal component analysis, factor analysis and discriminant analysis, PLS accommodates a set of relationships among multiple independent variables and multiple dependent variables by establishing multiple relationship paths and constructing latent constructs in one comprehensive model (MacKinnon, 2008; Henseler et al. 2009), leading to the following strengths:
Simultaneous estimations in PLS rather than multi-step processing by regressions. For sequential hypotheses, researchers with traditional regression analysis employ multi-step process by firstly estimating the fixed values (or residuals) from the first order hypothesis tests and then inputting the fixed
10
values (or residuals) obtained into the hypothesis testing in the following order. Under PLS, sequential relationships can be constructed either by multiple-order paths in the structural model or by latent constructs in the measurement model2, and then the sequential relationships can be assessed simultaneously.
The simultaneous nature of PLS facilitates mediation analysis on the direct and indirect effects of the explanatory variables in the model. With regressions, each of the hypotheses within a mediated model must be tested using separate regressions where each potential mediator is examined in a multi-step process (e.g. Baron and Kenny, 1986). In PLS, mediating effects can be examined by establishing additional paths from the explanatory variables to the mediator and then from the mediator to the dependent variables. The direct effects from the explanatory variable to the dependent variable and the indirect effects via the mediator can be tested simultaneously in one-step under one PLS path model framework.
The latent constructs in the reflective measurement model3 allow for potential multicollinearity among manifest variables. By its nature, the reflective measurement model expects high correlations among manifest variables that capture the variances in the unobserved latent construct. Therefore, a combination of reflective measure models and the path modelling among latent
2
The PLS path model comprises two types of sub-models: the measurement model and the structural model. The measurement model depicts the relationships between each latent construct and its correspondent manifest variables. The structural model captures the relationships among the latent constructs (Kock 2012).
3
A reflective measurement model refers to that within a measurement model, the relationship between the latent construct and the manifest variables is reflective, i.e., that the changes in the manifest variables reflect the change in the latent construct. (Coltman et al. 2008). In contrast, another type of measurement model is the formative measurement model, in which a number of manifest variables are combined to form a latent construct and the causality flows from the manifest variables to the latent construct.
11
constructs allows for the potential multicollinearity among highly correlated manifests that are not allowed for in the regression technique.
Moreover, compared with covariance-based structural equation modelling (SEM) techniques, the PLS algorithm attempts to obtain the best parameter estimates for each constructs and manifests by maximizing of the explained variances of the dependent variables (Chin, 1998), which is similar to regression techniques. In contrast, covariance-based SEM techniques are based on the maximum likelihood approach by minimizing the difference between the sample covariance and that predicted by the theoretical model. Prior literature reports that PLS is less demanding on measurement scales, sample size and residual distributions (Wold 1985) and PLS also avoid inadmissible solutions (e.g. no solution for path parameters) and factor indeterminacy (e.g. no numerical scores obtained for latent variables), which are quite possible in covariance-based SEM techniques (Fornell and Bookstein 1982). Studies comparing PLS and covariance-based SEM techniques with Monte Carlo simulations find that (1) when a formative latent variable is introduced, the PLS method shows better robustness compared to covariance-based SEM (Vilares et al. 2009), and (2) on a normal data scenario, covariance-based SEM provides similar accuracy and robustness in parameter estimates as PLS. However, if the data assumptions on covariance-based SEM are violated, PLS offers more robust approximations (Ringle et al. 2007).
The comparative strengths in PLS are particularly beneficial in this bank audit fee research. First, audit fee studies usually involve interrelated research questions. For example, audit fees are a function of client size, complexity and risks, and other auditor attributes. Meanwhile, client size not only dominates the audit fee determination but
12
also affect other client attributes in complexity and risks. In addition, the self-selection of auditor argument implies that auditor attributes are also influenced by client attributes. In another words, the audit fee determination framework involves multiple relation paths in multiple directions. A certain variable that is the dependent variable in one modelling block can be the explanatory variable in another modelling block. Traditional OLS audit fee models cannot capture these complex interrelated relationships in a single stage whereas PLS provides a tool to cope with it in a path modelling framework, and both the direct effect and the indirect effect of interested variables in the framework can be obtained with PLS.
Second, multicollinearity, a prevailing problem in audit fee research, can be addressed using PLS in two alternative ways. PLS supports latent variables, which are linear composites of the associated manifest variables within one construct. Therefore, multicollinearity among manifests within one construct can be allowed in PLS. Alternatively, multicollinearity among constructs can be captured and controlled by establishing paths between constructs.
Third, self-selection and joint determination issues can be addressed in PLS. Self-selection of a high quality audit can be settled with a construct for auditor choice. Paths are established from the constructs of client attributes to the construct of auditor choice, to control for self-selection effect of auditor choice. Joint determination of audit fees and non-audit service fees can be controlled by a construct for service fees, which consists of audit fees and non-audit fees as manifest variables.
Finally, compared with covariance-based SEM techniques, PLS have fewer restrictions on sample size and distribution, which makes PLS to be easily applied by researchers.
13
III. Empirical Predictions
This study focuses on the PLS methodology and the predictions developed in this study are consistent with prior audit fee literature, especially replicated from Cullen et al. (2012) for the purpose of comparability.
3.1 Off-Balance Sheet Securitization Risk and Audit Fees
The purpose of an audit is to reduce information risk by providing assurance that an entity’s financial report is free from material omissions or misstatements. Auditing standards require auditors to reduce audit risk to an acceptable level when planning and conducting an audit. An auditor who identifies higher risk of material misstatement is expected to reduce detection risk by allocating more audit resources (expending more effort) to the higher risk areas of the engagement to achieve an acceptable level of audit risk (O’Keefe et al. 1994; Pratt and Stice 1994; Lyon and Maher 2005; Hay et al. 2006).
We expect off-balance sheet financial risks to increase auditors’ assessment of the risk of material misstatement. First, off-balance sheet transactions usually involve complex transaction procedures between multiple parties, which involve complex legal documents and increase inherent risk. Second, off-balance sheet transactions are often used from earnings management (Healy and Wahlen 1999; Degeorge et al. 1999; Matsumoto 2002) and capital management (Moyer 1990; Karaoglu 2005) motives. These factors increase the risks of a material misstatement in the financial statements of banks engaged in off-balance sheet transactions. Therefore, we argue that off-balance sheet risks will increase auditors’ assessment of the risks of material misstatement and
14
that auditors will adjust their audit effort accordingly, thus increasing audit fees.
H1: There is a positive association between off-balance sheet financial risks and audit fees.
In this study, off-balance sheet financial risk is proxied by asset securitization risks, consistent with Cullen et al. (2012). Furthermore, as asset securitizations have been identified as significant off-balance sheet contributors to the financial crisis, following Cullen et al. (2012), we investigate if there is a change in the positive association between off-balance sheet securitization risks and audit fees with the onset of the GFC (H2).
3.2 The impact of On-Balance Sheet Financial Risk
On-balance sheet financial risks are associated with regulatory risk, business risk as well as inherent risk in bank audits. The banking industry is a highly regulated industry and banks are more responsible to supervisory agencies. Fields et al. (2004) argue that measures important to supervisory agencies are primarily important for auditors to attend in audit engagements. Bank regulators in U.S. and in other countries adopt CAMELS rating system with a focus on risks at capital adequacy, asset quality, management efficiency, earnings, liquidity and sensitivity to market risks.
CAMELS risks align with business risks of the banks and are considered as inherent risks by auditors. Inherent risks are positively priced in audit engagements as they may lead to higher risk of misstatements in associated parts in the audit and also may require specialized audit procedures (Simunic 1980; Hay et al. 2006). It is usually cited that inventory and receivables are the areas with high inherent risks in non-bank audits
15
(Newton and Ashton 1989; Hay et al. 2006). Current asset and systematic risk are also been used as proxies for inherent risk in prior research and are found positively significant (Hay et al. 2006). In bank audits, banks with unfavourable capital ratios, asset quality and liquidity status are vulnerable to unfavourable business environmental changes, leading to going concern considerations from auditors. Management deficiency can attract fraud and errors in management and operations, leading to higher audit risk. Furthermore, earnings ratios are one of the important signals in going concern consideration; unfavourable earnings performance are also regarded as an incentive to manipulated reporting.
Prior bank audit fee studies fully support the overall importance of financial risks in audit fee determination (Fields et al. 2004; Boo and Sharma 2008; Ettredge et al. 2011). However, the effect of particular financial risk on audit pricing is still inclusive. For example, the commercial loan ratio and mortgage loan ratio are positively significant in Fields et al. (2004); in Cullen et al (2012), the commercial loan ratio is insignificant and the mortgage loan ratio shows a negative sign. Despite of the period difference between the two studies, the correlation analysis indicates these two loan composition ratios are seriously correlated with other financial risk measures, and also highly driven by bank size and associated with Big N auditor choice.
Literature suggests associations between on-balance-sheet financial risks on off-balance sheet activities. In particular for asset securitizations, by their nature, securitization activities are closely correlated with the originating bank’s loan stock, therefore relating to the loan composition measures. In addition, securitization transactions may arise from motives for on-balance sheet financial distress or pressure (Healy and Wahlen
16
1999; Degeorge et al. 1999; Matsumoto 2002; Moyer 1990; Karaoglu 2005); and bank management may exploit the information veil to use securitizations for manipulation purposes (Karaoglu 2005; Ambrose et al. 2005; Rosenblatt et al. 2005; Dechow and Shakespeare 2009). Cullen et al. (2012) indicate significant associations between on-balance sheet asset quality and earnings measures and off-balance sheet securitization risks.
In summary, we expect significant influences of on-balance-sheet financial risks on off-balance sheet risks. Moreover, we also expect positive impacts of on-balance sheet financial risks on bank audit fees.
3.3 Additional Predictions
We consider the effects of BHC size and auditor choice in audit fee determinations, particularly their impact on on-balance sheet and off-balance sheet risks and their overall effects in the audit fee model.
Size Effect
Size is widely accepted as the dominant audit fee determinant which has an overwhelmingly positive relationship with audit fees (Simunic 1980; Hay et al. 2006). Typical size measures include the transformed total assets and sales revenues. In a comprehensive meta-analysis study, Hay et al. (2006) confirm that the size effect is so strong that there would have to be more than 100,000 unpublished studies with an opposite result to deny this size effect.
Bank audit literature demonstrates the same effect of bank size. Cullen et al. (2012) indicate that the client size by itself (as proxied by the natural logarithm of total assets)
17
explains over 70% variances in audit fees. In addition, bank size is highly correlated with a series of bank financial risk measures, asset securitization risk measures and auditor attributes, suggesting the effect of bank size could be either direct or via its indirect effects on other audit fee determinants.
The indirect effect of bank size is reasonable in banking practice. First, auditor choice literature indicates that large organizations tend to use Big N auditors for differentiated audit quality and/or seeking better protections under Big N’s “deep pocket” and bank reputation. Second, large banks have better resources to accommodate complex financial profiles and have more liquidity buffer in response to risky financial transactions (Demsetz and Strahan 1997; Fields et al. 2004). In a sensitivity test to compare the different audit pricing patterns for large and small banks, Fields et al. (2004) find auditors price differently on financial risk measures for large banks and small banks. Some asset types, e.g., mortgage loans positively affect fees for large banks but not for small banks. Fee premiums on capital adequacy are more important in small banks than in large banks, suggesting auditors adopt the regulators’ concern on capital adequacy for small banks. On liquidity, auditors are attentive to securities in small banks as securities are relied by small banks to meet their liquidity needs while large banks have more other options (Demsetz and Strahan 1997; Fields et al. 2004). Bank size also affects off-balance sheet activities. Cullen et al. (2012) find that the majority of off-balance sheet asset securitization transactions are undertaken by large banks as larger banks are more likely to undertake complex off-balance sheet transactions with better resources and expertise.
18
directly and via indirect effects on financial risks, off-balance sheet risks and auditor choices.
Auditor choice
Big-N auditor choice is positively associated with audit fees with supportive evidence from audit fee studies on non-bank industries and on banks (Hay et al. 2006). However, the endogeneity issue associated with auditor choice that certain client attributes can influence the demand of audit quality and therefore affect auditor choice (Chaney et al. 2004). The Heckman two-stage method is used to control for self-selection of auditors in prior studies with mixed results on fee premiums on Big-N auditors (Chaney et al. 2004; and Giroux and Jones 2007). Recent studies on self-selection bias in accounting research suggest that the Heckman method could be biased if there is no solid theoretical justification for excluding independent variables from the first stage regression and multicollinearity could be a critical issue in applying the Heckman approach (Tucker 2010; Francis et al. 2012).
The PLS path modelling approach allows for the control on auditor self-selection by using Big N auditor choice as a mediator in the structural model. Align with prior literature, we expect a positive effect of Big N auditors on audit fees, in which following Chaney et al. (2004), effects of size and financial risks mediated by Big N auditor choice are also expected.
IV. Research Method
19
issues with bank audit fee modelling, including high correlations among financial risk proxies, complex interrelationships between bank audit fees and its determinants in one simultaneous framework and also catering for the auditor self-selection problem at the same time.
Off-balance sheet risk is proxied by a latent construct representing asset securitization risks, SECRISK, comprised of multiple manifest variables, total assets (ABS), the retained interests to total assets (RETINT), non-performance ratio of securitized assets (NPL_SEC) and the charge-off ratio of securitized assets (CHGOFF_SEC), consistent with Cullen et al. (2012) and Cheng et al. (2011). Each manifest variable in the SECRISK construct reflects one aspect of the risks associated with the off-balance sheet securitization activities.
Following the result of a preliminary principal component analysis, we develop 6 latent constructs to represent on-balance-sheet financial risks, including C (the capital measure), E&M (the earnings and management performance measure), A (portfolio composition measure I, focusing on loan composition), INTSEC (portfolio composition II, focusing on other assets), TRANS (portfolio composition III, focusing on the liabilities accounts), and S (the interest rate sensitivity measure).4. The original manifest variables on on-balance sheet financial risks are replicated from the adapted Fields et al. model used in Cullen et al. (2012). Size and Big N auditor choice are single item
4
The grouping of on-balance-sheet financial risk measures based on the PCA procedure is not perfect. A better measurement method should consider more financial risk measures with additional data collection from the financial statement. We maintain the original dataset in the aim to keep consistency and comparability with the main test results.
20
constructs with only one manifest variable.5. Relation paths are established between latent constructs in accordance with the predictions and hypotheses. Fixed year effects are controlled by single-item variables for the years.
<Insert Figure 1 Here>
4.1 Sample and Data
Our sample is restricted in the banking industry because, compared with other industries, banks have more resources and are more likely to take off-balance sheet activities. Specifically in this study, we focus on asset securitization, a typical off-balance sheet activity, which has been recently investigated in Cullen et al. (2012). To keep consistency and comparability, our sample is identical to the sample used in Cullen et al. (2012), comprising 2,424 US listed BHCs for the period from 2003 to 2009. Consistent with prior research (e.g., Karaoglu 2005; Chen et al. 2008; Barth et al. 2012, Cullen et al. 2012), Bank financial data and off-balance sheet securitization details are extracted from the FRB Y9-C Regulatory Filing database. Audit fees are extracted from the Audit-Analytics database.
4.2 On-Balance Sheet Financial Risks
We apply a principal component analysis on on-balance sheet financial risk variables to generate six latent constructs including two reflective constructs, two formative constructs and two single-item constructs. The on-balance sheet financial risk variables
5
To keep the PLS path model simple and concise, we exclude STDRET (the stock volatility) and SAVING (the savings institution indicator) which are included in Fields et al. (2004) from the PLS model, as STDRET and SAVING are not significant both in Fields et al. (2004) and Cullen et al. (2012). Our untabulated sensitivity tests also indicate STDRET and SAVING are not important determinants in bank audit fee determination.
21
are restricted to the financial risk measures in the adapted Fields et al. bank audit fee model (Cullen et al. 2012). We interpret the constructs based on CAMELS risk rating system which is a risk management and regulatory framework that has been world-widely used in the banking industry. It is notable that due to the data restriction, we admit our CAMELS financial risk measures and the interpretations are indicative rather than complete.
Capital adequacy (C)
Bank capital serves to absorb losses, promote public confidence, help restrict excessive asset growth, and provide protection to depositors and the FDIC insurance funds. We use the total risk-based capital ratio as the primary measure for capital adequacy, which represents Tier 1 plus Tier 2 capital ratios. FDIC sets minimum capital requirements at 4% for Tier 1 capital and 8% for total risk-based capital. In addition, we also incorporate the intangible asset ratio into the capital adequacy construct based on the PCA analysis result. Due to the high intercorrelations between the two variables, the capital adequacy construct is defined as a reflective construct.
Higher capital ratios do not necessarily indicate better capital adequacy. First, with the general 4% and 8% thresholds, the minimum capital requirement might vary for different banks, subject to additional capital requirements set by the bank’s primary regulators based on the bank’s risk status. In this sense, higher capital ratios might imply worse risk status and higher specifically-set minimum capital requirements. On the other hand, voluntary contributions in capital levels above the required minimums strengthen the banks’ capital adequacy. Second, the evaluation of capital adequacy should also consider other aspects of financial risks, including management capability,
22
asset quality and composition, earnings, growth prospect, contingent liabilities and the access to capital market. For example, problematic asset quality implies potential expected losses and a weakened capital position at a future point of time; a bank’s earnings performance may have an impact on the present and expected capitalization level; and serious contingent liabilities may lead to capital depletion. In this study, earnings, and asset quality are treated as separate latent constructs of financial risks, expected to inter-correlate with capital adequacy, and it should be noted, as in other studies, that most management information is private and unavailable in our dataset.
Performance measure: earnings and management performance (E&M)
The reflective performance measure E&M consists of four manifest variables: the charge-off ratio (CHGOFF), non-performing loan ratio (NONP), the incidence of loss (LOSS) and the inefficiency ratio (INEFFICIENCY). LOSS and INEFFICIENCY represent different facets of earnings and management efficiency performance. LOSS focuses on overall earnings performance and highlights negative earnings; while INEFFICIENCY focuses on the bank’s operational performance. On the other hand, earnings performance is closely related to the loan quality, reflected by charge-off ratio (CHGOFF) and non-performing loan ratio (NONP), in which NONP reflects the level of problematic loan assets and CHGOFF reflects credit losses written off during the current period.
Portfolio composition I (A), portfolio composition II (INTSEC), Portfolio composition III (TRANS) and interest rate sensitivity (S)
Portfolio composition is another important construct to be considered in evaluating asset quality. Commercial loans (COMMLOAN) and mortgage loans (MTGLOAN) are
23
two major components in the loan portfolio. We emphasize mortgage loans as mortgage loans consist of a large proportion of total loans and they are critically important loan composite especially in the recent decades, closely associated with the property market booming in early 2000s and the global financial crisis after 2007. By using principal component analysis another portfolio composition construct INTSEC is generated. This is formed by the ratio of interest rate derivatives to total assets (INTDERIV) and the ratio of securities to total assets (SECURITIES).
We use TRANSACCT and SENSITIVE as single item constructs. TRANS (correspondent to TRANSACCT), the ratio of transaction accounts to total assets, represents the liabilities side of the bank portfolio; S (correspondent to SENSITIVE), represents the interest rate sensitivity. Noting INTDERIV can be viewed as an off-balance-sheet interest rate sensitivity measure, we recognize that there is a level of overlap among the portfolio composition constructs and the interest rate sensitivity construct.
4.3 Off-Balance Sheet Risk: The Composite Asset Securitization Risk
Construct (SECRISK)
Following Cheng et al. (2011), we conduct a principal component analysis on five asset securitization risk variables, the securitized assets to total assets (ABS), the retained interests to total assets (RETINT), the charge-off ratio of securitized assets (CHGOFF_SEC), the non-performance ratio of securitized assets (NPL_SEC), and net securitization income to net income (SECINC). Consistent with Cullen et al. (2012), a composite asset securitization risk construct is generated including ABS, RETINT, CHGOFF_SEC and NPL_SEC. The composite asset securitization risk construct
24
(SECRISK) is a reflective construct due to the high correlations among the four manifest variables. SECINC is not closely correlated with other asset securitization risk variables, and therefore leaves out of the main tests by the principal component analysis.6
4.4 Single Item Latent Constructs
Bank size (SIZE)
Bank size is reflected with the natural logarithm of total assets. Hay et al. (2006) confirm a positive association between client size and audit fees and emphasize that size is an extremely critical explanatory factor for any model of audit fees. From six measures of client size used in prior literature, assets, sales revenue, and city population are identified as significant client size measures, while city population is only useful in municipal audit scenario, and sales revenue is not a typical bank size measure.
Big N auditor choice (BIGN)
Auditor choice is a single item construct measured by a dummy variable, Big N, in which a BHC with a Big N auditor is assigned with value 1 and a BHC with a Non-big N auditor is assigned with value 0.
V. PLS Path Modelling Results
We use partial least squares (PLS) path modelling method, a component-based structural equation modelling technique to simultaneously validate the constructs and test multiple predictions and hypotheses (Chin 1998; Henseler et al. 2009).
6
We include SECINC as a single-item asset securitization risk construct in the sensitivity tests, and generate consistent results.
25
Bootstrapping based on 100 resamples is used to estimate the significance levels of the results. The analysis algorithm used in the tests is Warp PLS regression, which allows for non-linear U-curve, S-curve and J-curve relationships between latent constructs. Many relationships in nature, especially in economics and business areas, are nonlinear and follow a U-curve or S-curve pattern.7. Particularly in audit fee research, Carson et al. (2004) find that audit fees are not linearly related to client size as is typically assumed, and failure to control the non-linearity can potentially result in misspecification of the model and misinterpretation.
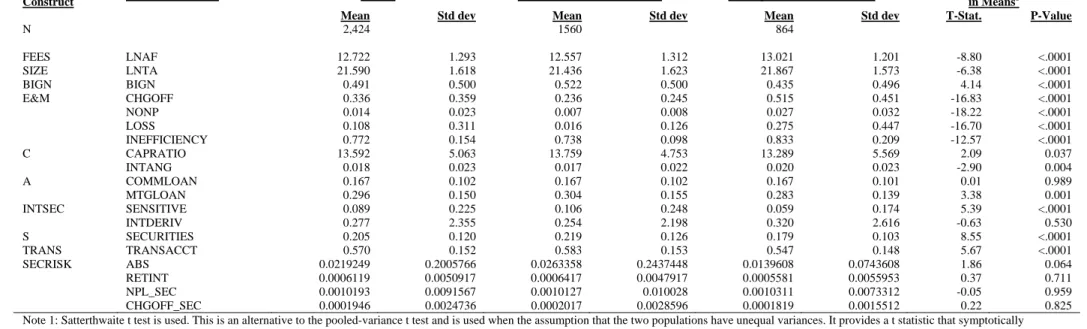
We present the descriptive statistics for the manifest variables used in the PLS model in Table 1. The measurement model (construct) validity is assessed based on the results reported in Table 2 and Table 3. The testing results on H1 are reported in Table 4 in which direct and indirect effects of on-balance sheet and off-balance sheet financial risk, size, and Big N auditor on bank audit fees are analysed in terms of R2, path coefficients, and predictive relevance Q2 are presented. The testing results on H2 are presented in Table 5.
5.1 Descriptive Statistics
Table 1 presents the descriptive statistics for the manifest variables used in this study. Panel B shows the Pearson correlations between the manifest variables in the pooled sample. It is notable that the manifest variables are highly correlated with each other.
7
A standard PLS Regression algorithm is used in the sensitivity tests, whereby indicators’ weights, loadings and factor scores (also known as latent variable scores) are calculated based on an algorithm that maximizes the variance explained in the latent variable scores by the latent variable indicators, with the assumption that all the relationships between the latent constructs are linear relationships. The results based on a Warp PLS estimation and based on a standard PLS estimation are consistent.
26
For example, the size measure, LNTA, is significantly correlated with most of the on-balance sheet financial measures, including CHGOFF, NONP, INEFFICIENCY, COMMLOAN, INTERDIV, SENSITIVE, SECURITIES and TRANSACCT, and with all the off-balance securitization risk measures, saying ABS, RETINT, NPL_SEC and CHGOFF_SEC. The majority of the on-balance sheet financial risks are mutually correlated, consistent with the pattern displayed in Fields et al. (2004). On-balance sheet financial risk manifests are further correlated with the off-balance sheet securitization measures, consistent with our proposition that on-balance sheet financial risks are closely associated with the off-balance sheet exposures. In addition, the off-balance sheet risk manifests, ABS, RETINT, NPL_SEC and CHGOFF_SEC are highly correlated with each other. Overall correlation patterns suggest that high correlations are pervasive among the manifest variables in bank audit fee determination, which may be potentially problematic for an OLS regression model setting and lead to multicollinearity concerns.
<Insert Table 1 Here>
5.2 PLS Measurement model validity
Reflective measurement model
Indicator loadings, average variance extracted (AVE), composite reliability, cross loadings, and Fornell-Larcker criterion capture the reliability and validity of the reflective measurement models (Jarvis et al. 2003; Henseler et al. 2009).
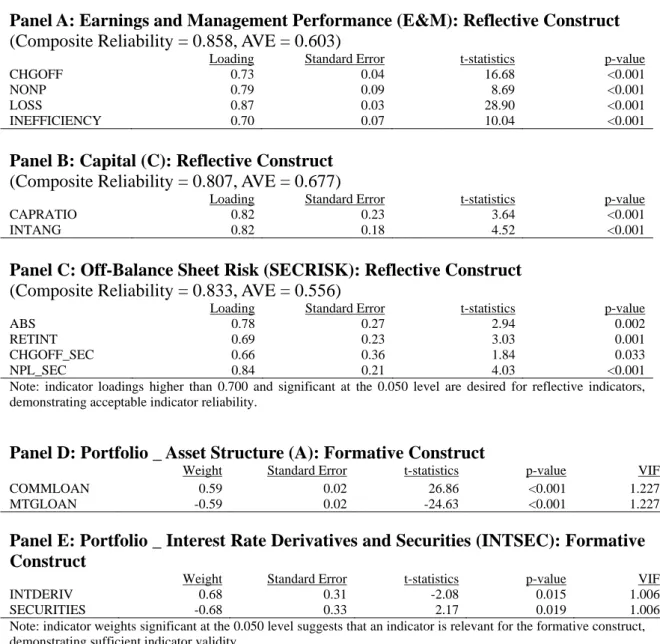
Table 2 Panels A to C report the indicator loadings, composite reliability and AVEs for the reflective constructs. All of the three reflective constructs, Capital (C), Earnings and
27
Management Performance (E&M), and Off-Balance Sheet Risk (SECRISK), have composite reliability scores larger than 0.800. They exhibit good internal consistency and indicate that there is over an 80% possibility that the manifest variables in the constructs could simultaneously load when the latent variables increase. AVE measures the amount of variance that a latent variable component captures from its manifest variables in relation to total variance. All the reflective constructs have AVEs higher than the threshold value 0.500, indicating acceptable convergent validity. Indicator loadings for the reflective constructs are all higher than or close to 0.700 and significant at higher than 0.05 level threshold.
<Insert Table 2 Here>
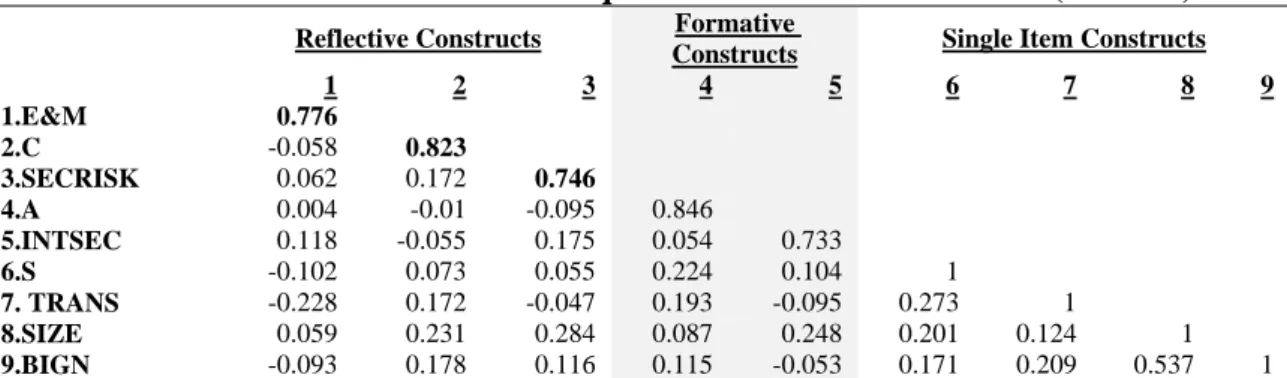
The discriminant validity is evaluated with cross-loadings and Fornell-Larcker criterion. As suggested in Table 3 Panel B, the loading of each reflective indicator is higher for its designated construct than for any of the other constructs; and each of the constructs loads highest with its own manifest items. Untabulated p-values for the cross-loadings indicate that the reflective constructs differ significantly with one another. The Fornell-Larcker criterion test is reported in Table 3 Panel A, which requires the latent constructs share more variance with its assigned manifest indicators than with any other latent variables. Hence, the AVE of each latent construct should be greater than the latent construct’s highest squared correlation with any other latent construct. Table 3 Panel A suggests that Fornell-Larcker criterion is conformed to for all the three reflective constructs.
28 Formative measurement model
The validity of formative constructs is assessed with the magnitudes, significance and VIFs of the indicator weights, as well as the inter-construct correlations between the assessed formative construct and all the other constructs (Diamantopoulos and Winklhofer 2001; Jarvis et al. 2003; Henseler et al. 2009).
Table 2 Panel D and Panel E show that both the formative indicators are significant at 0.050 levels, suggesting the indicator is relevant for the designated formative construct. The formative indicator VIFs are all below 2.5 indicating multicollinearity is not a problem for the formative constructs. Table 3 Panel A shows correlations between the formative and all the other constructs are all less than 0.250, suggesting the formative constructs differ sufficiently from one another.
5.3 Prediction and Hypotheses Testing
On-Balance Sheet Financial Risks, Off-Balance Sheet Risk and Audit Fees
Table 4 presents the effect of each latent variable on FEES for the period 2003-2009. Panel A indicates that the model explains 88.4% total variance of bank audit fees (R2). Average path coefficient (APC) and average R-squared (ARS) are at 0.156 and 0.215 respectively, both below 0.001 significance level8. Together with an average variance inflation factor (AVIF) at 1.360, the PLS path model exhibits a good model fit.
<Insert Table 4 Here>
8
The P values are calculated via resampling estimations coupled with Bonferroni-like correlations, provided by WarpPLS application package.
29
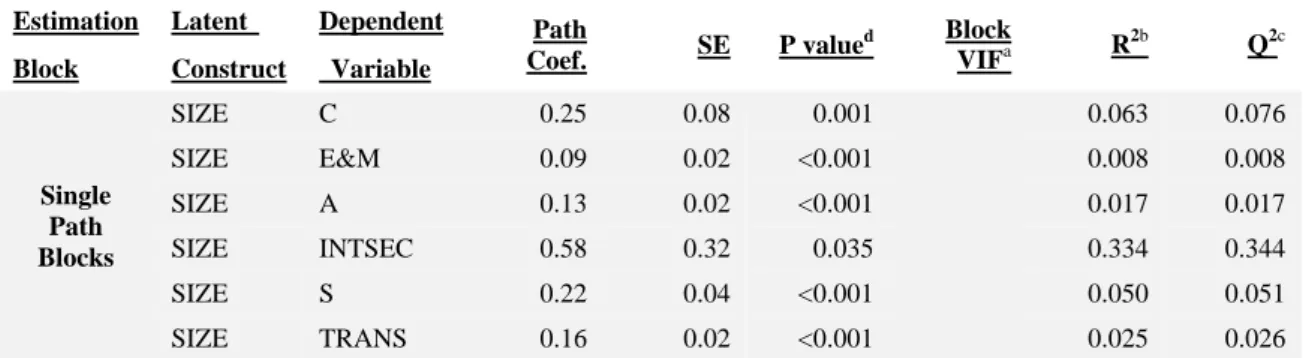
The PLS path results are summarized in groups. The first group lists the results of the single path blocks. The second and third groups report the direct relations of latent constructs with BIGN (auditor choice) and SECRISK (off-balance sheet securitization risks) respectively. The last group lists the direct impact of all the tested independent factors on audit fee (FEES) determination after considering the mutual relationships among those independent factors simultaneously. Table 4 Panel B reports the total effects of latent variables on FEES, which sums up both direct path effects as well as indirect path effects.9. The provision of total effects together with the path coefficients in Table 4 Panel A and Panel B allows us to evaluate both the direct paths in the PLS path model but also the overall (direct and indirect) effects of specific latent constructs.
We predict an association between on-balance sheet financial risks and off-balance sheet asset securitization risks. For the comprehensive securitization risk measure SECRISK, the PLS result indicates that SIZE, C, E&M, A, and INTSEC are significantly associated with SECRISK. Specifically, large BHCs tend to have higher
9
The total effect sums up all the direct and indirect effects for latent variables. For example, in addition to the direct effect on FEES, SIZE also affects other latent variables in the path model and those latent variables then further affect FEES. The statistics of total effect are the statistical sum of all the direct and indirect paths, in terms of the path coefficients and their significance levels. Having access to total effects can be critical in the evaluation of downstream effects of latent variables that are mediated by other latent variables, especially in complex models with multiple mediating effects along concurrent paths (Kock 2012).
Note our complex PLS path model establishes a number of indirect effects9 (also known as mediation effects, e.g., the indirect relation between SIZE and SECRISK via C (capital); the indirect relation between SIZE and FEES via C and then BIGN, etc. (see Hoyle and Kenny 1999), calculated based on bootstrapping estimations (Preacher et al. 2007). Suppose Y has direct relations with X and M, and M has a direct relation with X as presented in Equations (1) and (2):
r M b X c b Y 0 ' 1 (1) M a0 a1X (2)
The indirect effect of X on Y via M is f( |X)b1(a0 a1X), and The total effect of X on Y is f(|X)b0 c'X b1(a0 a1X).
30
level of securitization risks, which is consistent with the fact that large banks are more active in asset securitization activities as shown in the descriptive statistics. Banks at higher capital ratio (C), with worse earnings and management performance (E&M), more involved in mortgage loans (A) and derivative transactions (INTSEC) are likely to have higher off-balance sheet securitization risks. These results are consistent with our prediction, and prior literature that banks use off-balance sheet securitization activities to pursue earning management and liquidity management purposes (Karaoglu 2005; Pavel and Phillis 1987).
The last group in Table 4 Panel A reports the direct path results of latent variables on FEES, which provides consistent results compared to Cullen et al. (2012). The model explains 88.4% FEES variations. In terms of the impact of off-balance sheet risks on audit fees, SECRISK is positively associated with FEES. Noting the PLS path model used in this section has already allowed for the multicollinearity among manifests and inter-relations among latent constructs, the PLS results in Table 4 are consistent with Cullen et al. (2012), providing very strong supportive evidence to the positive association between off-balance sheet securitization risks and audit fees. Consistent with Cullen et al. (2012), FEES are higher for BHCs with worse earnings and management performance (E&M), higher capital ratio and higher intangible asset ratio (C), higher interest rate derivatives and lower level of securities (INTSEC). FEES are higher for banks with more commercial loans and less mortgage loans as formed in asset composition (A). In addition, SIZE is the major driver of FEES and there is a fee premium on BIGN.
31
H1. Panel B reports the total effects of latent variables on FEES, by summing up both direct path effect as well as indirect path effects. In addition to the dominant effect of SIZE on audit fees, there are slightly changes in the magnitudes of the total effects of other latent constructs compared with the direct effects in Panel A, due to the incorporation of indirect effects. However, except for INTSEC that is no longer significant after considering indirect effects of INTSEC on FEES, all the significant associations between other control latent constructs, including the off-balance sheet risk latent construct SECRISK, and FEES still hold after considering all the direct and indirect paths. Together with the results in Panel A, the PLS path modelling tests strongly confirm that auditors can be attentive to the off-balance sheet securitization risks for the period 2003-2009, and this result hold robust after considering mutual correlations among BHC size, auditor choice, on-balance sheet and off-balance sheet financial risks.
The Impact of the GFC on Bank Audit Fee Determination
We present a pre-GFC and during-GFC comparison with the PLS path modelling methodology. Consistent with Cullen et al. (2012), SECRISK are positively significant to FEES before the GFC both on the direct path effect (Panel B, Table 5) and on the total effect (Panel C, Table 5); and for the period after 2007, SECRISK is only marginally significant (p = 0.081). The group difference statistics indicate that there is no significant change on SECRISK with the onset of the GFC. This result is consistent with the results reported in Cullen et al. (2012).
Except for the changes on audit fee determinations with the onset of the GFC, the PLS path model also reports the migration of the inter-correlations among latent constructs
32
and the migration of the impact of other control latent constructs on audit fees (Panel B, Table 5). With regard to the relationships between financial risks and off-balance sheet securitization risks, SIZE, C, E&M, A, INTSEC are significantly associated with SECRISK both before and after the GFC, suggesting a persistent association of financial risks and securitization activities regardless of the GFC. The group comparison indicates that the significance of SIZE on SECRISK has increased after 2007; there is a significant change in the effect of INTSEC on SECRISK, with a positively significant pre-GFC coefficient but a negatively significant during-GFC coefficient.
A possible concern of the H2 test with the PLS model is the changes in the validity of the measurement model for the pre-and-during periods. Table 5 Panel A indicates that none of the reflective and formative constructs has changed significantly after the onset of the GFC, indicating good validation and stability of the measurement models for the pre-GFC and during-GFC subgroups, which ensure the general reliability of the sub-sample tests..
In summary, overall PLS path modelling results provide further confirmation to the OLS results presented in Cullen et al. (2012), after considering the inter-correlations among the latent constructs and allowing for multicollinearity among manifest variables within the constructs.
Size Effect
Table 4 Panel A and Panel B jointly suggest that the effect of SIZE on BHC audit fees is not only a direct effect from SIZE to FEES, but also via indirect paths from SIZE to other audit fee determinants. SIZE is a significant determinant for Big N auditor choice
33
(BIGN), financial risks (C, E&M, A, INTSEC, S and TRANS), and the composite off-balance sheet risk (SECRISK), indicating that SIZE pervasively and significantly influences all the independent latent constructs in the bank audit fee model. SIZE also has a major direct-effect on FEES which is positive and significant. Table 4 Panel B suggests that total effect of SIZE on FEES is extremely high at 0.88 (p < 0.001), indicating SIZE is a dominant determinant in BHC audit fee model, consistent with Hay et al. (2006).
Additionally, the dominating effect of SIZE on FEES persists before and through the GFC period (Panels B and C, in Table 5). The significant impacts of SIZE on auditor choice and on off-balance sheet activities are also persistent, while the group comparison indicates that there is an increasing effect of SIZE on securitization activities (SECRISK) after the onset of the GFC.
Auditor choice
Table 4 confirms a positive effect of Big N auditors on audit fees after allowing for the intercorrelations between BIGN and other control latent constructs in the model (coef. = 0.17, p<0.001). Moreover, the PLS model confirms endogeneity of Big N auditor choice. Specifically, 35.0% variations in BIGN can be explained by SIZE, C, E&M, A, INTSEC, S, and TRANS in this PLS model. Big N auditors are chosen by large BHCs (SIZE), BHCs with higher capital ratio (C), better earnings and management performance (E&M)10, higher level of commercial loans and lower level of mortgage loans (A), more involved in derivative transactions but less involved in security
10
34
investment (INTSEC)11, of lower interest rate sensitivity (S) and BHCs with a higher ratio of transaction accounts. The group comparison in Table 5 Panel B suggests that the effect of SIZE, C, A, S and TRANS on BIGN persist before and during the GFC.
VI. Conclusion and Discussion
This study has contributed to accounting research community as follows. The introduction of PLS path modelling in archival auditing studies provide an additional analytical tool for accounting and auditing researchers. The rich functions provided by PLS technique will facilitate researchers to address multiple interlinked research questions simultaneously. By combining PCA analysis and linear regression technique in one path model framework, PLS path modeling approach allows researchers to not only focus on one layer of the hypotheses but also be able to test interrelated hypothesized relations among multiple latent constructs in one comprehensive PLS path model. The intercorrelations among independent variables, multicollinearity and self-selection of auditors are critical issues in empirical auditing research.
Prior bank audit fee research has predicted audit fee determinations primarily with OLS approach (Fields et al. 2004; Boo and Sharma 2008; Ettredge et al. 2009; Doogar et al. 2012), combined with PCA analyses for certain inter-correlated variables (Cullen et al. 2012). This PLS study converges them into one simultaneous analysis under PLS framework. The results after differentiating latent constructs, establishing multiple paths, and controlling the mediation and moderation effects provide strong supportive
11
35
evidence for Cullen et al. (2012) with regard to H1 and H2. This confirms a positive association between off-balance sheet financial risk and audit fees for the pooled period (2003-2009) and for the pre-GFC period, which accounts for both direct impacts of securitization risks on audit fees and indirect impacts via other latent risk constructs. Furthermore, size and on-balance sheet financial risks drive off-balance sheet risks, which is consistent with prior literature (Karaoglu 2005). Our results support prior literature that firm size is the dominant audit fee determinant (Hay et al. 2006) and uphold the pervasive impact of size on other audit fee determinants. In addition, the results conform to the self-selection argument (Chaney et al. 2004; Knechel and Willekens 2006) and suggest that Big N auditor choice is affected by the entity size and financial risks, and further influence audit fees.
We acknowledge some limitations of PLS technique. First, the association between a manifest variable within a latent construct and the dependent variable cannot be quantified with the PLS technique. Although this can be solved by disaggregating the latent construct into several single item constructs (i.e., each construct has only one manifest variable), however, the disaggregation of latent constructs will make the PLS path model even more complicated. Second, formative latent constructs are hard to interpret especially when positive and negative signs show together in one latent construct. Third, as a so-called second generation technique, there is not a universally recognized goodness of fit criterion on PLS path modelling and many statistical methods are still under development within the PLS context. Therefore, before this technique has been widely accepted in archival accounting community, we recommend it as a tool used a robustness check to the main results.
36
BIBLIOGRAPHY
Ambrose, B. W., M. LaCour-Little and A. B. Sanders. 2005. Does regulatory capital arbitrage, reputation, or asymmetric information drive securitization? Journal of Financial Services Research 28: 113-133.
. Antle, R., E, A. Gordon, G. Narayanamoorthy, and L. Zhou. 2006. the Joint determination of audit fees, non-audit fees, and abnormal accruals, Review of Quantitative Finance and Accounting 27 (3): 235-266.
Baron, R. M., and D. A. Kenny. 1986. The moderator-mediator variable distinction in social psychological research: conceptual, strategic, and statistical considerations.
Journal of Personality and Social Psychology 51 (6): 1173-1182.
Barth, M. E., G. Ormazabal, D. J. Taylor. 2012. Asset securitizations and credit risk. The Accounting Review 87(2): 423-448.
Blanthorne, C., L. A. Jones-Farmer, E. D. Almer. 2006. Why you should consider SEM: a guide to getting started, Advanced Accounting Behavior Research 9: 179–207. Boo, E., and D. Sharma. 2008. The association between corporate governance and audit
fees of bank holding companies. Corporate Governance 8 (1): 28-45.
Carson, E., N. Fargher, D. T. Simon, and M. H. Taylor. 2004. Audit fees and market segmentation – further evidence on how client size matters within the context of audit fee models. International Journal of Auditing 8: 79-91.
Chaney, P, D. C. Jeter, and L. Shivakumar. 2004. Self selection of auditors and audit pricing in private firms. The Accounting Review 79 (1): 51-72.
Chen, W., C. Liu, and S. G. Ryan. 2008. Characteristics of securitizations that determine issuers’ retention of the risks of the securitized assets. The Accounting Review 83(5): 1181-1215.
Cheng, M., D. Dhaliwal, and M. Neamtiu. 2011. Asset securitization, securitization recourse, and information uncertainty. The Accounting Review 86(2): 541-568. Chin W. 1998. The partial least squares approach for structural equation modeling. In:
Marcoulides GA, editor, Modern Methods for Business Research, Mahwah, NJ, Erilbaum. 295-336.
Copley, P. A. , M. S. Doucet, and K. M. Gaver. 1994. A simultaneous equations analysis of quality control review outcomes and engagement fees for audits of recipients of federal financial assistance. The Accounting Review 69 (1): 244-256.
37
supply and demand of differentiated audits: evidence from the municipal audit market. Journal of Accounting Research 33 (1): 137-155.
Cullen, G, D. Gasbarro, G. Monroe, G. Shailer, and Y. Zhang. 2012. Bank audit fees and asset securitization risks. Working paper, University of New South Wales.
Dechow, P. M., and C. Shakespeare. 2009. Do managers time securitization transactions to obtain accounting benefits? The Accounting Review 84(1): 99-132.
Degeorge, F., J. Patel, and R. Zeckhauser. 1999. Earnings management to exceed thresholds. Journal of Business 72(1): 1-33.
Demsetz, R. S., and P. E. Strahan. 1997. Diversification, size, and risk at Bank Holding Companies. Journal of Money, Credit, and Banking 29 (3): 300-313.
Diamantopoulos, A., and H. M. Winklhofer. 2001. Index construction with formative indicators: an alternative to scale development. Journal of Marketing Research 38 (2): 269-277.
Doogar, R., S. Rowe, and P. Sivadasan. 2012. Asleep at the wheel again? Bank audits during the financial crisis, Working Paper, University of Illinois at Urbana-Champaign, University of Illinois.
Eilifsen, A., W. R. Knechel, and P. Wallage.2001. Application of the business risk audit model: a field study. Accounting Horizons 15 (3): 193-208.
Ettredge, M., Y. Xu, and H. Yi. 2011. Fair value measurements and audit fees: Evidence from the banking industry. Working paper, The University of Kansas, Korea University.
Fields, L. P., D. R. Fraser, and M. S. Wilkins. 2004. An investigation of the pricing of audit services for financial institutions. Journal of Accounting and Public Policy 23: 53-77.
Foley, T., R. Cantor, and M. Anderson. 1999. The evolution of Moody’s views on securitization. Moody’s Special Report (May).
Fornell, C., and F. Bookstein. 1982. Two structural equation models: LISREL and PLS applied to consumer exit-voice theory. Journal of Marketing Research 19: 440-452. Francis J. R., C. S. Lennox, and Z. Wang. 2012. Selection models in accounting
research. The Accounting Review 87(2): 589-616.
Giroux, G., and R. Jones. 2007. Investigating the audit fee structure of local authorities in England and Wales. Accounting and Business Research 37 (1): 21-37.
Hall M, Smith D, K. Langfield-Smith. 2005. Accountants' commitment to their profession: multiple dimensions of professional commitment and opportunities for future research. Behavior Research in Accounting 17: 89-109.
38
Hay, D., R. Knechel, and N. Wong. 2006. Audit fees: A meta-analysis of the effect of supply and demand attributes, Contemporary Accounting Research 23: 141-191. Healy, P. M., and J. Wahlen. 1999. A review of the earnings management literature and
its implications for standard setting. Accounting Horizons 13(4): 365-383.
Henseler, J., C. M. Ringle, R. R. Sinkovics. 2009. The use of partial least squares path modelling in international marketing, In: Advances in International Marketing. Bingley: Emerald JAI Press, p. 277-319.
Hoyle, R. H., and D. A. Kenny. 1999. Sample size, reliability and tests of statistical mediation. In: Statistical Strategies for Small Sample Research. Thousand Oaks, CA, Sage Publications, p. 197-223,
Ittner, C, D. Larcker, and M. Rajan. 1997. The choice of performance measures in annual bonus contracts. The Accounting Review 72 (2): 231–255.
Jarvis, C. B., S. B. Mackenzie, and P. M. Podsakoff. 2003. A critical review of construct indicators and measurement model misspecification in marketing and consumer research. Journal of Consumer Research 30: 199-218.
Karaoglu, E. 2005. Regulatory capital and earnings management in banks: The case of loan sales and securitizations. FDIC Center for Financial Research Working Paper No. 2005-05.
Knechel, W. R., and M. Willekens. 2006. The role of risk management and governance in determining audit demand. Journal of Business Finance & Accounting 33 (9-10): 1344-1367.
Kock, N. 2012. WarpPLS 3.0 User Manual. Laredo, Texas: ScriptWarp Systems.
Lee, L., S. Petter, D. Fayard, S. Robinson. 2011. On the use of partial least squares path modeling in accounting research. International Journal of Accounting Information Systems 12: 305-328.
Lyon, J. D., and M. V. Maher. 2005. The importance of business risk in setting audit fees: Evidence from cases of client misconduct. Journal of Accounting Research
43(1): 133-151.
MacKinnon D. 2008. Introduction to statistical mediation analysis. New York: Lawrence Erlbaum Assoicates, ISBN-13: 978-0-8058-6429-8.
Matsumoto, D. A. 2002. Management’s incentives to avoid negative earnings surprises.
The Accounting Review 77(3): 483-514.
Moyer, S. E. 1990. Capital ratio adequacy regulations and accounting choice in commercial banks. Journal of Accounting and Economics 13(2): 123-154.
Newton, J. D., and R. H. Ashton. 1989. The association between audit technology and audit delay. Auditing: A Journal of Practice & Theory 8 (Supplement): 22-49.