Foundations of Multidimensional Network Analysis
Michele Berlingerio
1Michele Coscia
2Fosca Giannotti
1Anna Monreale
2Dino Pedreschi
21
KDDLab ISTI-CNR 2KDDLab University of Pisa
Via G. Moruzzi, 1, 56124 Pisa - Italy Largo B. Pontecorvo, 3, 56127 Pisa - Italy
{michele.berlingerio, fosca.giannotti}@isti.cnr.it {coscia, annam, pedre}@di.unipi.it
Telephone: +39 0503152999 Telephone: +39 0502212752
Fax: +39 0503152040 Fax: +39 0502212726
Abstract—Complex networks have been receiving increasing attention by the scientific community, thanks also to the increas-ing availability of real-world network data. In the last years, the multidimensional nature of many real world networks has been pointed out, i.e. many networks containing multiple connections between any pair of nodes have been analyzed. Despite the importance of analyzing this kind of networks was recognized by previous works, a complete framework for multidimensional network analysis is still missing. Such a framework would enable the analysts to study different phenomena, that can be either the generalization to the multidimensional setting of what happens in monodimensional network, or a new class of phenomena induced by the additional degree of complexity that multidimensionality provides in real networks. The aim of this paper is then to give the basis for multidimensional network analysis: we develop a solid repertoire of basic concepts and analytical measures, which takes into account the general structure of multidimensional networks. We tested our framework on a real world multidimensional network, showing the validity and the meaningfulness of the measures introduced, that are able to extract important, non-random, information about complex phenomena.
I. INTRODUCTION
In recent years, complex networks have been receiving increasing attention by the scientific community, also due to the availability of massive network data from diverse domains, and the outbreak of novel analytical paradigms, which pose relations and links among entities, or people, at the center of investigation. Inspired by real-world scenarios such as social networks, technology networks, the Web, biological networks, and so on, in the last years, wide, multidisciplinary, and extensive research has been devoted to the extraction of non trivial knowledge from such networks. Predicting future links among the actors of a network ([13], [2]), detecting and studying the diffusion of information among them ([5]), mining frequent patterns of users’ behaviors ([4], [8]), are only a few examples of problems studied in Complex Network Analysis, that includes, among all, physicians, mathematicians, computer scientists, sociologists, economists and biologists.
Most of the networks studied so far are monodimensional: there can be only one link between two nodes. In this context, network analytics has focused to the characterization and
friends colleagues same colleagues relatives name same team 2004 2005 2006 2005 2009 2010
Fig. 1. Examples of multidimensional networks
However, in the real world, networks are often multi-dimesional, i.e there might be multiple connections between any pair of nodes. Therefore, multidimensional analysis is needed to distinguish among different kinds of interactions, or equivalently to look at interactions from different perspectives. Dimensions in network data can be either explicit or im-plicit. In the first case the dimensions directly reflect the vari-ous interactions in reality; in the second case, the dimensions are defined by the analyst to reflect different interesting quali-ties of the interactions, that can be inferred from the available data. This is exactly the distinction studied in [12], where the authors deal with the problem of community discovery. In their paper, our conception of multidimensional network is referred as multislice, networks with explicit dimensions are namedmultiplex, and the temporal information is used to derive dimensions for the network.
Examples of networks with explicit dimensions are social networks where interactions represent information diffusion: email exchange, instant messaging services and so on. An example of network with implicit dimensions is an on-line social network with several features: in Flickr, while the social dimension is explicit, two users may be connected implicitly by the sets of their favorite photos.
Moreover, different dimensions may reflect different types of relationship, or different values of the same relationship. This is exactly the distinction reported in Figure 1, where on the left we have different types of links, while on the right we have different values (years) for one relationship (for example, co-authorship).
different dimensions. This is precisely the aim of this paper: we develop a solid repertoire of basic concepts and analytical measures, which take into account the general structure of multidimensional networks, with the aim of answering ques-tions like: what is the degree of a node considering only a given set of dimensions? How are two or more dimensions related to each other? What is the “redundancy” among all the dimensions? To what extent one or more dimensions are more important than others for the connectivity of a node?
Our contribution can be then summarized as follows: after briefly reviewing a few works related to our research (Section II), we present an example of real-world multidimensional network (Section III), we formally define a set of measures aimed at extracting useful knowledge on multidimensional networks (Section IV), and we give the results of an extensive case study on the network presented (Section V). Our analysis shows that the measures we define are both simple and meaningful, and open the way for a new chapter of complex network analysis.
II. RELATED WORK
Network science is today a highly visible field of research, with relevant books also tailored for broad dissemination [6], [3], [17]. A large body of work was dedicated to the analysis of the degree distribution in networks, often with reference to specific networks such as phone calls [1], Internet [9], the Web [10], online social networks [7] and many others. One popular result is the power law distribution of the degree in many real-world networks.
Concerning multidimensional networks, there is little work so far on a general methodology for multidimensional network analysis, and a few works that address specific problems in a multidimensional setting. Some recent works put emphasis on specific multidimensional social networks, such as, as an example, communication networks among people [16]. Given a network and a set of latent social dimensions the authors were able to determine how new entities will behave in these dimensions. Although the underlying setting is similar to the one studied in our paper, the authors only focus on a particular problem, and develop specific analytical means for their objectives. Two more papers deal with the analysis of multidimensional network [15], [11]. In both cases, the authors analyze networks with “positive” and “negative” links among on-line communities. In [15], the authors analyze the degree distributions of the various dimensions, which are scale-free structures, highlighting the need for analytical tools for the multidimensional study of hubs. In [11], the authors focus on link prediction in multidimensional networks.
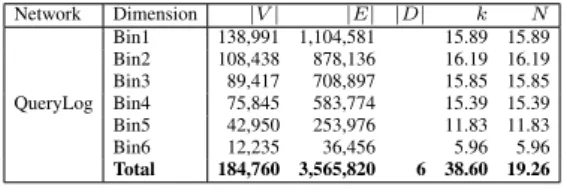
III. MULTIDIMENSIONALNETWORKS INREALITY Most real life networks are intrinsically multidimensional, and some of their properties may be lost if the different dimensions are not taken into account. In other cases, it is natural to derive multiple dimensions connecting a set of nodes from the available data to the end of analyzing some phenomena. Network Dimension |V| |E| |D| k N QueryLog Bin1 138,991 1,104,581 15.89 15.89 Bin2 108,438 878,136 16.19 16.19 Bin3 89,417 708,897 15.85 15.85 Bin4 75,845 583,774 15.39 15.39 Bin5 42,950 253,976 11.83 11.83 Bin6 12,235 36,456 5.96 5.96 Total 184,760 3,565,820 6 38.60 19.26 TABLE I
BASIC STATISTICS OF THE NETWORK USED:NUMBER OF NODES,EDGES, DIMENSIONS,AVERAGE DEGREE,AVERAGE NUMBER OF NEIGHBORS
In this section, we present a real-world multidimensional network.
The network was constructed from a query-log1of approx-imately 20 millions web-search queries submitted by 650,000 users, as described in [14]. Each record of this dataset stores a user ID, the query terms and the rank position of the result clicked by the user for the query. We extracted a word-word network of query terms (nodes), connecting two words if they appeared together in a query. The dimensions are defined as the rank positions of the clicked results, grouped into six almost equi-populated bins: “Bin1” for rank 1, “Bin2” for ranks 2-3, “Bin3” for ranks 4-6, “Bin4” for ranks 7-10, “Bin5” for ranks 11-58, “Bin6” for ranks 59-500. Hence two words appeared together in a query for which the user clicked on a resulting url ranked #4 produce a link in dimension “Bin3” between the two words. We refer to this network asQueryLog. Table I shows the basic properties of the network, for each dimension, and for the total network.
After the following two sections, where we formally model multidimesional networks and formally define our measures, we present experimental results obtained on the above net-work.
IV. MULTIDIMENSIONALNETWORKANALYSIS In literature, many analytical measures, both at the local and at the global levels, have been defined in order to describe and analyze properties of standard, monodimensional networks. Defining meaningful measures provides several advantages in the analysis of complex networks. From the simplest measure, the degree of a node, to more sophisticated ones, like the betweenness centrality, or the eigenvector centrality, several important results have been obtained in analyzing complex networks on real-world case studies. These interesting network analytical measures come under a different light when seen in the multidimensional setting, since the analysis scenario gets even richer, thanks to the availability of different dimensions to take into account. As an example the connectivity of the whole network changes if we see a single dimension as a separate network, with respect to the network formed by all the edges in the entire set of dimensions. Moreover, it could be interesting to analyze the importance of a dimension with respect to another, the importance of a dimension for a specific node, and so on. As a consequence, in this novel setting it becomes indispensable: (a) studying how most of the measures defined for classical monodimensional networks can be generalized in order to be applied to multidimensional networks; and (b)
defining new measures, meaningful only in multidimensional scenario, to capture hidden relationships among different di-mensions. In this section we address these two points, after defining a model for multidimensional networks.
A. A model for multidimensional networks
We use amultigraphto model a multidimensional network and its properties. For the sake of simplicity, in our model we only consider undirected multigraphs and since we do not consider node labels, hereafter we useedge-labeled undirected multigraphs, denoted by a triple G = (V, E, L) where: V is a set of nodes; L is a set of labels; E is a set of labeled edges, i.e. the set of triples(u, v, d)whereu, v∈V are nodes and d ∈ L is a label. Also, we use the term dimension to indicatelabel, and we say that a node belongs toorappears in a given dimension d if there is at least one edge labeled with dadjacent to it. We also say that an edgebelongs toor appears in a dimensiond if its label is d. We assume that given a pair of nodes u, v∈ V and a label d∈L only one edge (u, v, d) may exist. Thus, each pair of nodes inG can be connected by at most|L| possible edges. HereafterP(L) denotes the power set ofL.
B. Extending monodimensional measures
In general, in order to adapt the classical measures to the multidimensional setting we need to extend the domain of each function in order to specify the set of dimensions for which they are calculated. Intuitively, when a measure considers a specific set of dimensions, a filter is applied on the multigraph to produce a view of it considering only that specific set, and then the measure is calculated over this view. In the following, due to space constraints, we show how to redefine only the well-known degreemeasure by applying the above approach. Note that most of the classical measures can be extended in a similar way.
In order to cope with the multidimensional setting, we can define the degree of a node w.r.t a single dimension or a set of them. To this end we have to redefine the domain of the classical degree function by including also the dimensions.
Definition 1 (Degree): Letv∈ V be a node of a network G. The function Degree : V × P(L) → N defined as Degree(v, D) = |{(u, v, d) ∈ E s.t. u ∈ V ∧ d ∈ D}|
computes the number of edges, labeled with one of the dimensions inD, betweenvand any other nodeu. We can consider two particular cases: whenD=Lwe have the degree of the nodevwithin the whole network, while when the set of dimensions D contains only one dimension d we have the degree ofvin the dimensiond, which is the classical degree of a node in a monodimensional network. This kind of consideration also holds for any measure that is possible to extend to the multidimensional case in this way.
In order to illustrate the measures we define in this paper, we use a toy example, depicted in Figure 2, to show the application of the measures on it.
Example 1: Consider the multigraph in Figure 2 that models a multidimensional network with 2 dimensions.
In this multigraph we have Degree(3,{d1}) = 2, Degree(3,{d2}) = 0andDegree(2,{d1, d2}) = 3. C. Multidimensional measures
In this section we define new measures on the multidimen-sional setting and that are meaningful only in this scenario.
1) Neighbors: In classical graph theory the degree of a node refers to the connections of a node in a network: it is defined, in fact, as the number of edges adjacent to a node. In a simple graph, each edge is the sole connection to an adjacent node. In multidimensional networks the degree of a node and the number of nodes adjacent to it are no longer related, since there may be more than one edge between any two nodes. For instance, in Figure 2, the node 4 has five neighbors and degree equal to 7 (taking into account all the dimensions). In order to capture this difference, we define a measure concerning the neighborsof a node.
Definition 2 (Neighbors): Let v ∈ V and D ⊆ L be a node and a set of dimensions of a network G= (V, E, L), respectively. The function N eighbors : V × P(L) → N is defined as N eighbors(v, D) =|N eighborSet(v, D)| where N eighborSet(v, D) ={u∈V | ∃(u, v, d)∈E ∧ d∈D}. This function computes the number of all the nodes directly reachable from node v by edges labeled with dimensions
belonging toD.
Note that, in the monodimensional case, the value of this measure corresponds to the degree. It is easy to see that N eighbors(v, D) ≤Degree(v), but we can also easily say something about the ratio N eighborsDegree((vv,D) ). When the number of neighbors is small, but each one is connected by many edges to v, we have low values of this ratio, which means that the set of dimensions is somehow redundant w.r.t. the connectivity of that node. This is the case of node 5 in the toy example illustrated. On the opposite extreme, the two measures coincide, and this ratio is equal to 1, which means that each dimension is necessary (and not redundant) for the connectivity of that node: removing any dimension would disconnect (directly) that node from some of its neighbors. This is the case of node2in Figure 2.
We also define a variant of the Neighbors function, which takes into account only the adjacent nodes that are connected by edges belonging only to a given set of dimensions.
Definition 3 (NeighborsXOR): Let v ∈ V and D ⊆L be
a node and a set of dimensions of a network G= (V, E, L), respectively. The function N eighborsXOR:V × P(L)→N is defined as
N eighborsXOR(v, D) =
|{u∈V| ∃d∈D: (u, v, d)∈E∧@d0∈/D: (u, v, d0)∈E}| It computes the number of neighboring nodes connected by
edges belonging only to dimensions inD.
2) Dimension Relevance: One key aspect of multidimen-sional network analysis is to understand how important a particular dimension is over the others for the connectivity of a node, i.e. what happens to the connectivity of the node if we remove that dimension. We then define the new concept of Dimension Relevance.
1 2 3 4 5 6 7 8 9
Fig. 2. Toy example. Solid line is dimension 1, the dashed is dimension 2.
Definition 4 (Dimension Relevance): Let v∈V andD ⊆
L be a node and a set of dimensions of a network G = (V, E, L), respectively. The functionDR:V× P(L)→[0,1] is defined as
DR(v, D) =N eighborsN eighbors((v,Dv,L))
and computes the ratio between the neighbors of a node v connected by edges belonging to a specific set of dimensions
inDand the total number of its neighbors.
Clearly, the setDmight also contain only a single dimen-siond, for which the analyst might want to study the specific role within the network.
However, in a multidimensional setting, this measure may still not cover important information about the connectivity of a node. Figure 2 shows two nodes (4 and5) with a high dimension relevance for the dimension represented by a solid line. Specifically in both cases the dimension relevance is equal to one, but the complete set of connections they present is different: if we remove the dimension represented with a solid line, the node4 will be completely disconnected from some its neighbors, for example it cannot reach the nods 2, 3 and 7 anymore; while the node 5 can still reach all its neighbors. To capture these possible different cases we introduce a variant of this measure.
Definition 5 (Dimension Relevance XOR): Let v ∈V and D ⊆ L be a node and a set of dimensions of a network G = (V, E, L), respectively. DRXOR : V × P(L) → [0,1]
is defined as
DRXOR(v, D) =N eighborsN eighborsXOR(v,L(v,D) )
and computes the fraction of neighbors directly reachable from nodevfollowing edges belonging only to dimensionsD. Example 2: We can easily calculate the above measure for the nodes in Figure 2. As an example, for the node 8 there is no difference with theDR(Definition 4): all its neighbors are only reachable by solid edges. While in node5we have the opposite situation: all its neighbors are reachable by solid edges, but we always have an alternative edge. So theDRXOR
of the solid line dimension is equal to zero. 3) Dimension Connectivity: Another interesting quantita-tive property of multidimensional networks to study is the percentage of nodes or edges contained in a specific dimen-sion or that belong onlyto that dimension. To this end we also introduce: theDimension Connectivityand theExclusive Dimension Connectivityon both the sets of nodes and edges. Definition 6 (Edge Dimension Connectivity): Letd∈Lbe a dimension of a networkG= (V, E, L). The functionEDC: L→[0,1]defined as
EDC(d) =|{(u,v,d)∈|EE||u,v∈V}|
computes the ratio of edges of the network labeled with the
dimensiond.
Definition 7 (Edge Exclusive Dimension Connectivity): Let d∈L be a dimension of a networkG= (V, E, L). The
functionEEDC:L→[0,1]defined as
EEDC(d) =|{(u,v,d)∈E||{u,v(u,v,d∈V ∧ ∀)∈Ej|∈u,vL,j∈6=Vd}|: (u,v,j)∈/E}| computes the ratio of edges between any pair of nodesuandv labeled with the dimensiondsuch that there are no other edges between the same two nodes belonging to other dimensions
j6=d.
Example 3: In Figure 2 the EDC of dimension d1 is 0.61 since it has 8 edges out of the 13 total edges of the network. Its EEDC is equal to5/8 = 0.625.
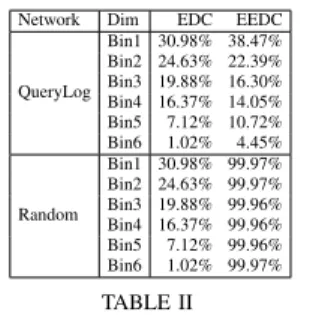
Table II presents the values of these measures computed on our real-world network.
4) D-Correlation: The last aspect of multidimensional net-works that we study in this paper is the interplay among dimensions. In the following we define two measures that, intuitively, give an idea of how redundant are two dimensions for the existence of a node or an edge. These two measures are based on the classical Jaccard correlation coefficient, but they extend it in order to cope with more than two sets.
Definition 8 (Pair D-Correlation): Let D⊆Lbe a set di-mensions of a networkG= (V, E, L). ThePair D-Correlation is the functionρpairs:P(L)→[0,1]defined as
ρpairs(D) =
|T
d∈DPd|
|S
d∈DPd|
wherePddenotes the set of pairs of nodes(u, v)connected in
dimensiond. It computes the ratio of pairs of nodes connected in all the dimensions in D and the total number of pairs of nodes connected in at least one dimension in D. Figure 3 shows the behavior of these measures on our real-life networks.
V. EXPERIMENTS
In this section, we present the results obtained by computing all the defined measures on our real world network presented in Section III. In order to better understand the meaning of our measures, we also created a random network to be used as null models for our experiments. The network was created at random, while preserving the basic characteristics (number of nodes and number of edges) of each single dimension of the QueryLog network. Thus, we call each of its dimensions with the name of the corresponding dimension in QueryLog, while we refer to the network as Random, or “null model”.
Figure 3 reports, using one column per network, the cumu-lative distribution of the two variants of the DR in the first two rows. The last row reports, instead, the matrices of the Pair-D Correlation for every pair of dimensions in the network (higher values mapped to darker color).
The distinction between the QueryLog and the Random network is very clear, despite having used the statistics of QueryLog to build the null model. Different distributions are showing that the knowledge extracted on the real network is much different from the one extracted on a random one, i.e. we are not assessing a random phenomenon.
What can be seen by looking at the DR distributions and the Dimension Connectivity values (especially the EEDC), reported in Table II, is that these two measures seem to be correlated. We note, in fact, that the DRs tend to be higher in conjunction with higher Edge Exclusive Dimension
QueryLog Random 0 0.2 0.4 0.6 0.8 1 0 0.1 0.2 0.3 0.4 0.5 0.6 0.7 0.8 0.9 1 p(DR) DR Bin1 Bin2 Bin3 Bin4 Bin5 Bin6 0 0.2 0.4 0.6 0.8 1 0 0.1 0.2 0.3 0.4 0.5 0.6 0.7 0.8 0.9 1 p(DR) DR Bin1 Bin2 Bin3 Bin4 Bin5 Bin6 0 0.2 0.4 0.6 0.8 1 0 0.1 0.2 0.3 0.4 0.5 0.6 0.7 0.8 0.9 1 p(DR XOR ) DRXOR Bin1 Bin2 Bin3 Bin4 Bin5 Bin6 0 0.2 0.4 0.6 0.8 1 0 0.1 0.2 0.3 0.4 0.5 0.6 0.7 0.8 0.9 1 p(DR XOR ) DRXOR Bin1 Bin2 Bin3 Bin4 Bin5 Bin6 Bin1 Bin2 Bin3 Bin4 Bin5 Bin6
Bin1 Bin2 Bin3 Bin4 Bin5 Bin6 0 0.2 0.4 0.6 0.8 1 Edge Jaccard Bin1 Bin2 Bin3 Bin4 Bin5 Bin6
Bin1 Bin2 Bin3 Bin4 Bin5 Bin6 0 0.2 0.4 0.6 0.8 1 Edge Jaccard
Fig. 3. The cumulative distributions of the two DRs (first two rows) and Pair-D Correlation (last row) in our networks.
Connectivity values. The QueryLog network (first column of Figure 3) presents separated distributions among the di-mensions where the EEDC values present an high variance. Moreover, the descending order (by dimension) of EEDC follows the decreasing trend (by dimension) in the cumulative distribution plots. This is not surprising. By definition, the two measures are two different perspectives, one local (DR), one global (DC), of the same aspect: how much a dimension is important for the connectivity of a network.
In Figure 3 we also report the values of the correlation we defined, computed on each possible pair of dimensions. We see that the presence of a natural ordering among the dimensions lets a clear phenomenon emerge: closer dimensions are more similar than distant ones. The phenomenon is highlighted by the fact that the cells close to the diagonal are darker than those distant from it, in the Querylog network.
Consider now the matrices related to the Random network. Due to the random generation, the natural ordering of the dimensions disappears, while, in this case, the size of the dimensions does the difference, and the trend of the correlation follows the basic statistics of the network.
Again, these considerations support the thesis that our multidimensional measures are capturing real, and not random, phenomena, that constitute meaningful knowledge mined in the multidimensional networks analyzed.
VI. CONCLUSIONS AND FUTURE WORK
In this paper, we have introduce a large, solid, repertoire of meaningful measures, able to capture different interesting structural properties of multidimensional networks, such as
Network Dim EDC EEDC
QueryLog Bin1 30.98% 38.47% Bin2 24.63% 22.39% Bin3 19.88% 16.30% Bin4 16.37% 14.05% Bin5 7.12% 10.72% Bin6 1.02% 4.45% Random Bin1 30.98% 99.97% Bin2 24.63% 99.97% Bin3 19.88% 99.96% Bin4 16.37% 99.96% Bin5 7.12% 99.96% Bin6 1.02% 99.97% TABLE II
DIMENSIONCONNECTIVITY OF OUR NETWORK.
the interplay residing among the dimensions, both at the global and at the local level. We believe that our experiments validated the sense and the analytical power of our repertoire of measures. According to our findings, our measures also appear to be able to capture real, non random, phenomena, and allow for interesting interpretation of the results. On the other hand, we are aware that the research described in this paper leaves many problems open for futher research, both on the theoretical and the application side. In the future, we plan to continue our field of experiments over ever richer, larger and more complex network data.
Acknowledgments. Michele Coscia is a recipient of the Google Europe Fellowship in Social Computing, and this research is supported in part by this Google Fellowship.
REFERENCES
[1] J. Abello, A.L. Buchsbaum, and J.R. Westbrook. A functional approach to external graph algorithms. InAlgorithmica, pages 332–343. Springer-Verlag, 1998.
[2] Bringmann B., Berlingerio M., Bonchi F., and Gionis A. Learning and predicting the evolution of social networks. IEEE Intelligent Systems, 25(4):26–35, 2010.
[3] A.L. Barab´asi. Linked: The New Science of Networks. Perseus Books Group, May 2002.
[4] F. Benevenuto, T. Rodrigues, M. Cha, and V.A.F. Almeida. Character-izing user behavior in online social networks. InInternet Measurement Conference, pages 49–62, 2009.
[5] M. Berlingerio, M. Coscia, and F. Giannotti. Mining the temporal dimension of the information propagation. InIDA, pages 237–248, 2009. [6] M Buchanan. Nexus: Small Worlds and the Groundbreaking Theory of
Networks. W.W. Norton & Co., May 2003.
[7] D. Chakrabarti, Y. Zhan, and C. Faloutsos. R-mat: A recursive model for graph mining. InICDM, 2004.
[8] D.J. Cook, A.S. Crandall, G. Singla, and B. Thomas. Detection of social interaction in smart spaces. Cybernetics and Systems, 41(2):90–104, 2010.
[9] M. Faloutsos, P. Faloutsos, and C. Faloutsos. On power-law relationships of the internet topology. InSIGCOMM, pages 251–262, 1999. [10] J. M. Kleinberg, R. Kumar, P. Raghavan, S. Rajagopalan, and A.S.
Tomkins. The web as a graph: measurements, models, and methods, 1999.
[11] J. Leskovec, D. Huttenlocher, and J. Kleinberg. Predicting positive and negative links in online social networks. InWWW, pages 641–650. ACM, 2010.
[12] P. J. Mucha, T. Richardson, K. Macon, M. A. Porter, and J.-P. Onnela. Community structure in time-dependent, multiscale, and multiplex net-works.Science 328, 876, 2010.
[13] D.L. Nowell and J. Kleinberg. The link prediction problem for social networks. InCIKM ’03, pages 556–559. ACM, 2003.
[14] G. Pass, A. Chowdhury, and C. Torgeson. A picture of search. In InfoScale ’06, page 1. ACM, 2006.
[15] M. Szell, R. Lambiotte, and S. Thurner. Trade, conflict and sentiments: Multi-relational organization of large-scale social networks. arXiv.org, 1003.5137, 2010.
[16] L. Tang and H. Liu. Relational learning via latent social dimensions. In KDD, pages 817–826. ACM, 2009.