04 August 2020
POLITECNICO DI TORINO
Repository ISTITUZIONALE
Physical Layer Aware Optical Networks / Cantono, Mattia. - (2018 Apr 19). Original
Physical Layer Aware Optical Networks
Publisher:
Published
DOI:10.6092/polito/porto/2706595 Terms of use:
Altro tipo di accesso
Publisher copyright
(Article begins on next page)
This article is made available under terms and conditions as specified in the corresponding bibliographic description in the repository
Availability:
This version is available at: 11583/2706595 since: 2018-05-03T11:37:24Z Politecnico di Torino
Physical Layer Aware Optical
Networks
ByMattia Cantono
****** Supervisor(s):Prof. Vittorio Curri, Supervisor Prof. Roberto Gaudino, Co-Supervisor Doctoral Examination Committee:
Prof. Alberto Bononi, Referee, Università degli Studi di Parma
Prof. Ioannis Tomkos, Referee, Athens Information Technology Center Prof. Cristian Antonelli, Università degli Studi dell’Aquila
Dr. Antonio Napoli, Coriant R&D GmbH Dr. Rosanna Pastorelli, SM Optics s.r.l
Politecnico di Torino 2018
Declaration
I hereby declare that, the contents and organization of this dissertation constitute my own original work and does not compromise in any way the rights of third parties, including those relating to the security of personal data.
Mattia Cantono 2018
* This dissertation is presented in partial fulfillment of the requirements for Ph.D. degreein the Graduate School of Politecnico di Torino (ScuDo).
First, I would like to thank my advisors Vittorio Curri and Roberto Gaudino for giving me the chance of starting this PhD. I would like to especially thank Vittorio for his mentorship, and guidance in the world of academia, for his unmatched confidence, enthusiasm and leadership when diving into new and unexplored topics. Nevertheless, I would like to thank all the members of the OptCom group, and ISMB for all the learning experiences we shared. A special thanks to all the people from the industry that helped me in getting a clearer understanding of the bigger picture, and pushed me to develop new solutions, with real-world applicability.
Great thanks to Marco Bertino for his friendship, and for all the coffee we shared. I would like to thank all my fellow colleagues and team mem-bers from DET and from the Acquario for their friendship, and for all the good times we shared together. Special thanks to Andrea Arduino, Dario Pilori, Emanuele Virgillito, Shoaib Khaliq, Alessio Ferrari, and Marianna Hovsepyan.
A heartfelt thank to all my friends: to the GAP VG family and to the EV group for always providing a getaway from stress and headaches; to my padrino Calogero for his constant support and understanding; to Giuseppe for all the laughs and all the thoughts we shared; to Fernando for being an example of commitment to excellence.
Finally and most importantly, I would like to thank my family for their unconditional love, and support to help me reach new heights. Special thanks to my father for being an example of perseverance and dedication, to my mother for her unmatched emotional support, and to my sister for her intelligence, and for always being an inspiration for me.
Abstract
This thesis describes novel contributions in the field of physical layer aware optical networks. IP traffic increase and revenue compression in the Telecom industry is putting a lot of pressure on the optical community to develop novel solutions that must both increase total capacity while being cost effec-tive. This requirement is pushing operators towards network disaggregation, where optical network infrastructure is built by mix and match different physical layer technologies from different vendors. In such a novel context, every equipment and transmission technique at the physical layer impacts the overall network behavior. Hence, methods giving quantitative evalua-tions of individual merit of physical layer equipment at network level are a firm request during network design phases as well as during network life-time. Therefore, physical layer awareness in network design and operation is fundamental to fairly assess the potentialities, and exploit the capabilities of different technologies.
From this perspective, propagation impairments modeling is essential. In this work propagation impairments in transparent optical networks are sum-marized, with a special focus on nonlinear effects. The Gaussian Noise model is reviewed, then extended for wideband scenarios. To do so, the impact of polarization mode dispersion on nonlinear interference (NLI) generation is assessed for the first time through simulation, showing its negligible impact on NLI generation. Thanks to this result, the Gaussian Noise model is gener-alized to assess the impact of space and frequency amplitude variations along the fiber, mainly due to stimulated Raman scattering, on NLI generation. The proposed Generalized GN (GGN) model is experimentally validated on a setup with commercial linecards, compared with other modeling options, and an example of application is shown.
Then, network-level power optimization strategies are discussed, and the Locally Optimization Global Optimization (LOGO) approach reviewed. After that, a novel framework of analysis for optical networks that leverages detailed propagation impairment modeling called the Statistical Network Assessment Process (SNAP) is presented. SNAP is motivated by the need of having a general framework to assess the impact of different physical layer technologies on network performance, without relying on rigid opti-mization approaches, that are not well-suited for technology comparison. Several examples of applications of SNAP are given, including comparisons of transceivers, amplifiers and node technologies. SNAP is also used to highlight topological bottlenecks in progressively loaded network scenarios and to derive possible solutions for them.
The final work presented in this thesis is related to the implementation of a vendor agnostic quality of transmission estimator for multi-vendor optical networks developed in the context of the Physical Simulation Environment group of the Telecom Infra Project. The implementation of a module based on the GN model is briefly described, then results of a multi-vendor experi-mental validation performed in collaboration with Microsoft are shown.
Contents
List of Figures ix
List of Tables xiv
List of Scientific Contributions xv
1 Introduction 1
1.1 Optical Networks: an introduction . . . 1
1.2 Capacity Crunch and Revenue Compression in the Telecom Industry . . . 4
1.3 Flexible, transparent and reconfigurable optical networks . . . 8
1.4 Outline of the remainder of this thesis . . . 11
2 Physical Layer Modeling for Physical Layer Aware Networking 13 2.1 An introduction to optical propagation impairments . . . 13
2.2 The Signal-to-Noise Ratio as a QoT metric . . . 16
2.3 Modeling ASE noise . . . 17
2.4 Modeling filtering penalties and SRS crosstalk . . . 18
2.5 Modeling the nonlinear Kerr effect in coherent optical systems 20 2.6 The generalized SNR and related power optimization strategies 26 2.7 The Generalized GN-model for NLI modeling in wideband systems . . . 29
2.7.1 Assessing the impact of PMD on NLI generation . . . . 30
2.7.2 Introducing the Generalized Gaussian Noise Model . . 36
2.7.3 Experimental Validation of the GGN-model . . . 39
2.7.4 Comparing the GGN-model with the GN-model . . . . 44
2.7.5 An example of application of the GGN-model. . . 46
2.8 Nonlinear models for Physical Layer Aware Networking . . . 50
2.9 The LOGO Strategy for Optimal Power Settings in Network scenarios . . . 51
3 Assessing the Impact of Physical Layer Technologies on Network Performance 56 3.1 A novel perspective on analyses frameworks for optical net-works . . . 56
3.2 Introducing the Statistical Network Assessment Process . . . . 58
3.3 Given Traffic Analyses on Sparkle Pan-European Topology. . . 63
3.3.1 Merit of NLI on network performance and flexible rate transceivers. . . 65
3.3.2 Merit of amplifier noise figure on network performance. 70 3.3.3 Merit of ROADM node insertion loss . . . 71
3.4 Progressive traffic analyses: a topology stress test . . . 71
3.5 SNAP Driven Upgrades . . . 80
3.5.1 Selective HFA Introduction . . . 81
3.5.2 Unlocking Capacity through SDM Upgrades . . . 86
3.6 Flex vs Fixed Grid Upgrade benefits. . . 87
3.7 Merit of 2MxN WSSs on network blocking. . . 95
3.7.1 Working principle of 2MxN WSS family. . . 96
3.7.2 SNAP-based blocking probability analyses . . . 99
Contents viii 4 QoT Estimations for Network Design of Multi-Vendor Networks 106
4.1 QoT Estimation for Vendor-Agnostic Network Design. . . 106 4.2 OLE Validation against Commercial Testbeds. . . 109 4.3 Conclusion . . . 114
5 Conclusions and Future Work 116
5.1 Summary . . . 116 5.2 Next steps . . . 118
References 120
Appendix A Physical Layer Parameters and Topology References 136
A.1 Fiber types . . . 136 A.2 Network Topologies . . . 138 A.3 BER vs SNR for different modulation format . . . 142 Appendix B Analytical derivation of the GGN-model. 143
1.1 Predictions and statistics for IP traffic from different sources. Data elaboration have been performed starting from the data reported by Cisco VNI [15], the Amsterdam Internet Exchange [17], the European Internet Exchange consortium [16], and the Seattle Internet Exchange [19]. . . 5 1.2 Global Fixed Voice and Broadband revenues. Data taken from
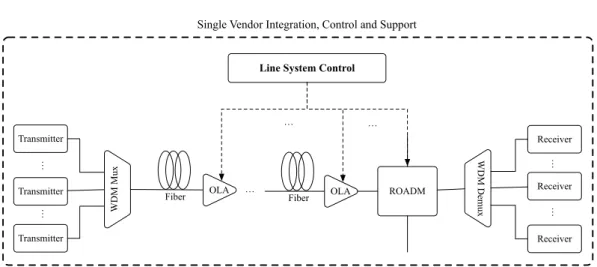
[29]. . . 7 1.3 Legacy line systems in optical networks with single vendor
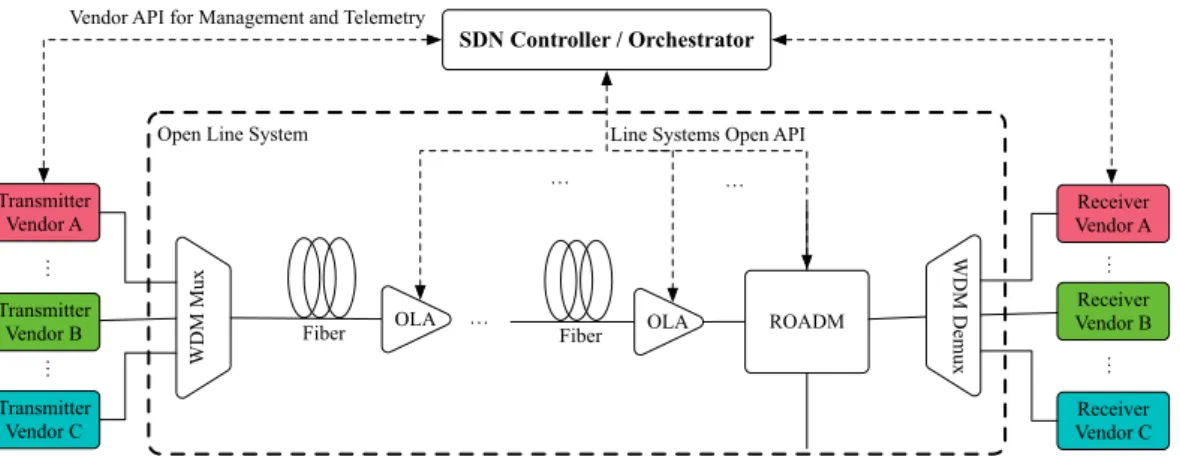
integration. . . 10 1.4 Open line system approach with multi-vendor interoperability
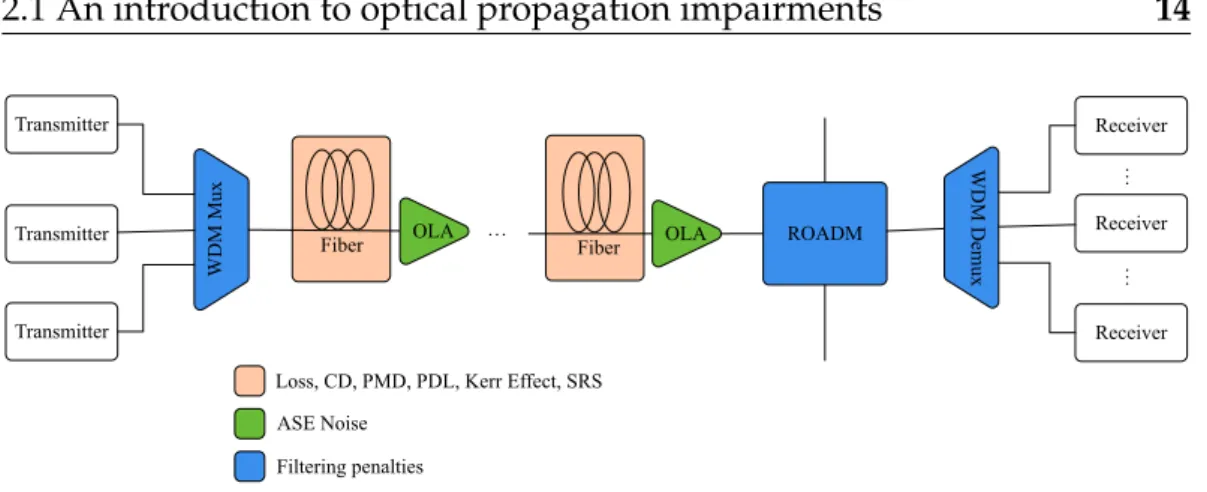
and centralized orchestration. . . 11 2.1 Sources of propagation impairments in an optical
communica-tion system . . . 14 2.2 Coherent vs Incoherent Accumulation of NLI for a 21 channel
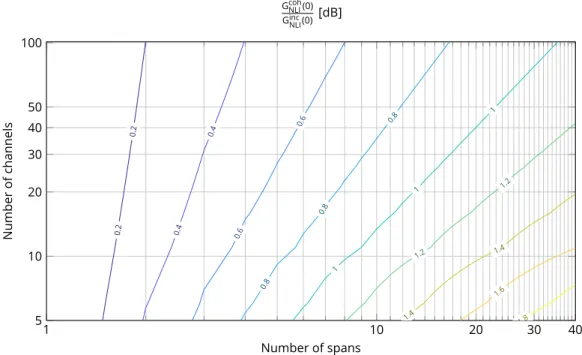
system. . . 24 2.3 Gap between coherent and incoherent GN-model vs number
of spans and number of channels . . . 24 2.4 Generalized SNR vs power per channel for a 41 PM-QPSK
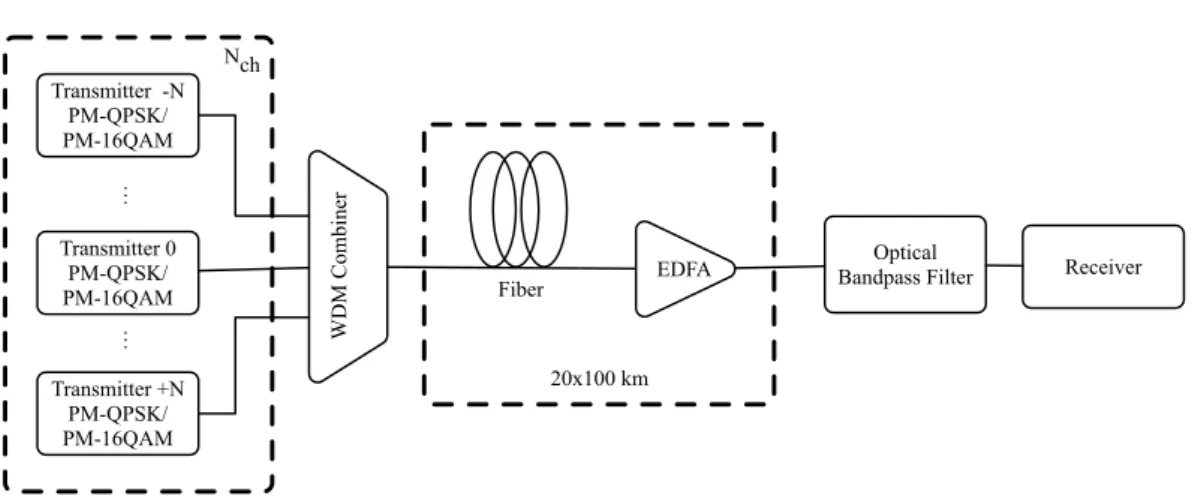
32 GBaud system over a 50 GHz DWDM grid. Results are obtained from full split step simulations. . . 27 2.5 System setup considered for the assessment of PMD impact
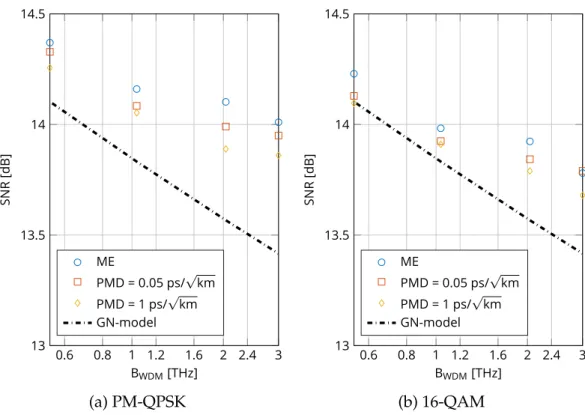
List of Figures x 2.6 Generalized SNR for PM-QPSK and PM-16QAM for different
values of PMD in a system with 41 32-GBaud WDM channels in a 50 GHz grid, and comparison with GN-model predictions 34 2.7 Eye-diagram of a 32-GBaud PM-QPSK signal before (a) and
after 23 km propagation on a PMD-only fiber (b) and a CD-only fiber (c). . . 35 2.8 Generalized SNR for PM-QPSK and PM-16QAM vs. number
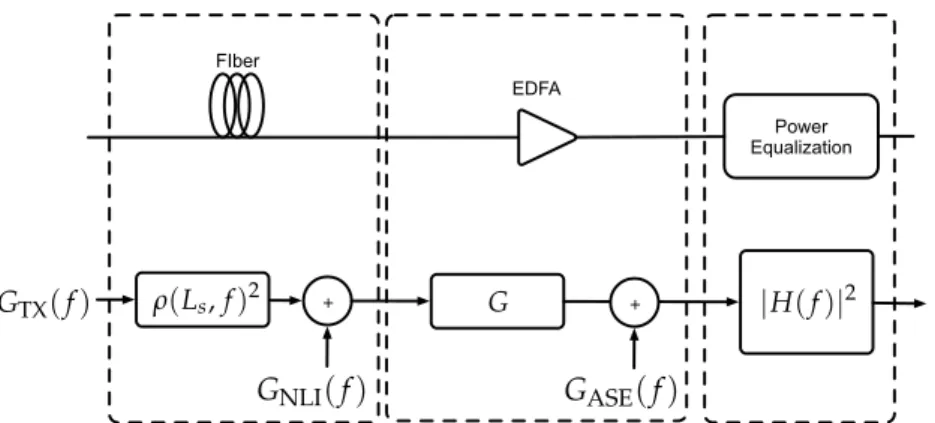
of channels, and comparison with GN-model predictions. . . . 36 2.9 Equivalent block scheme of a fiber span for generalized SNR
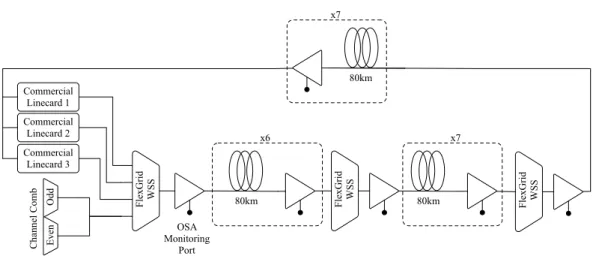
calculations using Gaussian-noise models. . . 38 2.10 Orange Lab testbed and setup used for experimental
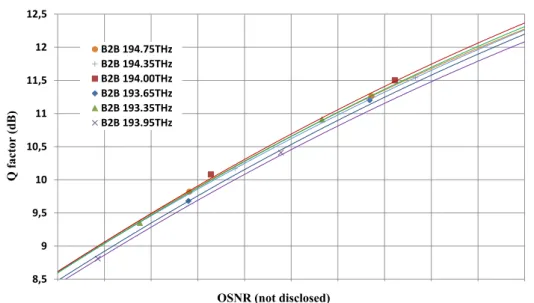
valida-tion of the GGN-model. . . 39 2.11 Back to back (B2B) Q vs OSNR response of the transponder
for all measured frequencies. Actual OSNR values not disclosed. 40 2.12 Power evolution due to SRS and amplifier ripple along the
testbed. . . 41 2.13 Experimental results for the GGN-model validation. Fig.2.13a
shows the linear, nonlinear and generalized SNR values ob-tained from experimental data. Fig.2.13bdepicts the compari-son of the GGN-model with the experimental nonlinear SNR values. . . 43 2.14 Comparison of different approaches to NLI and SRS interplay
modeling. . . 45 2.15 System setup for the GGN-model example of application. . . . 47 2.16 SNR vs pre-compensation percentage. Results obtained with
the GGN-model. . . 48 2.17 Comparison between the GGN-model and a full split-step
simulation for 90% pre-compensation. . . 49 2.18 Network representation for QoT calculations . . . 54 3.1 Flow chart for the Statistical Network Assessment Process. . . 59
3.2 Sensitivity curve for bitrate elastic transceivers. . . 65
3.3 Convergence analyses of the average bitrate per LP vs number of Monte Carlo runs assuming TDHMF andkMAX =1. . . 67
3.4 AverageRb,λ vs∆P for two flexible bitrate transceivers with and without NLI. . . 68
3.5 Average Rb,λ vs kMAX for TDHMF and PM-M-QAM based flexible bitrate transceivers. . . 69
3.6 Impact of amplifier noise figure on network capacity. . . 72
3.7 Impact of ROADM insertion loss on network capacity. . . 73
3.8 Progressive-traffic analyses for a German topology. . . 77
3.9 Progressive-traffic results for a PAN-European topology. . . . 79
3.10 Progressive-traffic results for the German topology post HFA upgrade. . . 82
3.11 Progressive-traffic results for the Pan-Eu topology post-HFA upgrade. . . 83
3.12 Average link spectral saturation at BP=1% pre and post-HFA upgrades for the German topology . . . 84
3.13 Average link spectral saturation at BP=1% pre and post-HFA upgrades for the Pan-European topology . . . 85
3.14 Progressive-traffic results for the German topology after selec-tive SDM upgrade. . . 88
3.15 Progressive-traffic results for the Pan-Eu topology after selec-tive SDM upgrade. . . 89
3.16 Blocking probability against the overall network traffic per available spectral unit for. Blue, red and yellow lines refer to 20, 40 and 100 Gbps of traffic grooming, respectively. Solid, dash-dotted and dashed lines refer to 25% 50% and 75% of residual bandwidth, respectively. Legend is reported only in Fig.3.16afor space constraints. . . 93
List of Figures xii 3.17 Network traffic per residual spectra unit at BP=1% for fixed
and flex grid implementation vs different residual bandwidths and grooming sizes. . . 95 3.18 MCS-based CDC-ROADM for a MxN node. Not all
connec-tions are shown for sake of clarity. . . 97 3.19 WSS-based CDC-ROADM for a MxN node. Not all
connec-tions are shown for sake of clarity. . . 97 3.20 WSS-based CDC-ROADM and pay-as-you-grow
configura-tion for high degree count nodes. . . 98 3.21 2MxN WSS for high degree count nodes. Degrees sharing a
2xN WSS are affected by wavelength contention. . . 99 3.22 Blocking probability vs number of allocated ligthpaths for
different WSS architectures with 100 GHz and 50 GHz grid. . 100 3.23 Average number of required WSS per node per direction for
two different grid spacings and WSSs architectures. . . 102 3.24 Qualitative description of required number of WSSs per
direc-tion in each network node, for two different node configura-tions (2Mx24 and 2Mx48) and two different target blocking probabilities (1% and 40%). All 4 cases refer to the 50-GHz grid scenario. Node sizes varies from 0.75 to 2.5 WSS/direction.103 3.25 Blocking probability vs number of allocated ligthpaths for
of two different WSS architecture with different levels of add/drop capability. . . 104 4.1 The Optical Link Emulator architecture. . . 108 4.2 Microsoft testbed for OLE validation. . . 110 4.3 Normalized power spectral density of the transmitted
4.4 SNR values measured from commercial linecards (red diamond-marked curves) and estimated through the OLE software (blue circle-marked curves) at different distances. A±0.75 dB area around OLE estimation is shown in light blue. The box plots for the absolute value of the SNR estimation error are also reported. . . 113 A.1 German topology. . . 138 A.2 Pan-European topology. . . 139 A.3 Telecom Italia Sparkle Pan-European topology. Labels
repre-sent link lenghts in km. . . 139 A.4 Telecom Italia topology. . . 140 A.5 Metro Network topology. . . 140 A.6 BER vs SNR for different modulation formats on AWGN
List of Tables
3.1 Average Network Throughput at BP=1% for different transceiver families and grooming sizes. . . 80 3.2 Achievable net bitrate with bitrate flexbile transceivers over a
37.5 WDM grid. . . 90 3.3 Achievable net bitrate with bitrate ans symbol rate flexbile
transceivers over a 12.5 WDM grid. . . 91 A.1 Typical Fiber Parameters . . . 137 A.2 Topology Data . . . 141
Acronyms / Abbreviations
ADC Analog-to-Digital Converter
API Application Programming Interface ASE Amplified Spontaneous Emission AWGN Additive White Gaussian Noise CAGR Compound Annual Growth Rate CAPEX Capital Expenditure
CD Chromatic Dispersion
CDC Colorless Directionless and Contentionless CDN Content Delivery Network
CPE Carrier Phase Estimation CSM Coarse Step Method CUT Channel Under Test
DAC Digital-to-Analog Converter
DC Data Center
DCU Dispersion Compensating Unit
Nomenclature xvi DGD Differential Group Delay
DP-NLSE Dual Polarization Nonlinear Schroedinger Equation DSP Digital Signal Processing
DWDM Dense Wavelength Division Multiplexing EDC Electronic Dispersion Compensation
EDFA Erbium Doped Fiber Amplifier EOL End of Life
FEC Forward Error Correction FFSS Fast Fiber Simulator Software FOM Figure of Merit
FWM Four-Wave Mixing
GGN Generalized Gaussian Noise Model
GN Gaussian Noise
GPU Graphic Processing Unit HFA Hybrid Fiber Amplifier
IMDD Intensity Modulation with Direct Detection
IP Internet Protocol
ISI Inter-Symbol Interference ISP Internet Service Provider
IX Internet Exchange
LCOS Liquid Crystal on Silicon
LOGO Locally Optimized Globally Optimized
M2M Machine-to-Machine MCA Monte Carlo Analysis MCS Multicast Switch
ME Manakov Equation
MSA Multi-Source Agreement NLI Nonlinear Interference
NZDSF Non-Zero Dispersion Shifted Fiber OADM Optical Add Drop Multiplexer OEO Optical-Electro-Optical
OFDM Orthogonal Frequency Division Multiplexing OLA Optical Line Amplifier
OOK On-Off Keying OOT Over the Top
OSA Optical Spectrum Analyzer OSNR Optical Signal-to-Noise Ratio PDL Polarization Dependent Loss
PM Polarization Multiplexed
PMD Polarization Mode Dispersion PSCF Pure Silica Core Fiber
PSP Principal States of Polarization QAM Quadrature Amplitude Modulation QoT Quality of Transmission
Nomenclature xviii
RA Raman Amplifier
ROADM Reconfigurable Optical Add Drop Multiplexer ROI Return over the investment
RRC Root Raised Cosine
RSA Routing and Spectrum Assignment RWA Routing and Wavelength Assignment
RWSA Routing and Wavelength or Spectrum Assignment SBS Stimulated Brillouin Scattering
SNAP Statistical Network Assessment Process SNR Signal-to-Noise Ratio
SRS Stimulated Raman Scattering SSFM Split Step Fourier Method SSMF Standard Single Mode Fiber TCO Total Cost of Ownership
TDHMF Time Division Hybrid Modulation Format TIP Telecom Infra Project
VNI Visual Networking Index
WDM Wavelength Division Multiplexing WSS Wavelength Selective Switch
A list of the scientific contributions, with special focus on publications, car-ried out during the PhD are described here.
List of Publications
Peer Reviewed International Journals Publications
[1] M. Filer, M. Cantono, A. Ferrari, G. Grammel, G. Galimberti, and V. Curri, "Multi-vendor Experimental Validation of an Open Source QoT Estimator for Optical Networks". In: Journal of Lightwave TechnologyMar. 2018. DOI: 10.1109/JLT.2018.2818406.
[2] D. Pilori, M. Cantono, A. Ferrari, A. Carena, and V. Curri, "On the Effect of Polarization Mode Dispersion on Nonlinear Interference Genera-tions". In preparation for: Optics Express.
[3] M. Cantono, D. Pilori, A. Ferrari, C. Catanese, J. Thouras, J.L. Auge, and V. Curri, "On the Interplay of Nonlinear Interference Generation with Stimulated Raman Scattering for QoT Estimation". In: Journal of Lightwave TechnologyMar. 2018. DOI: 10.1109/JLT.2018.2814840.
[4] V. Curri, M. Cantono, and R. Gaudino, "Elastic All-Optical Networks: A New Paradigm Enabled by the Physical Layer. How to Optimize Network Performances?". In: Journal of Lightwave Technology, vol. 35, no. 6,pp. 1211–1221, Mar. 15, 2017. DOI: 10.1109/JLT.2017.2657231. [5] M. Cantono, R. Gaudino, and V. Curri, "Potentialities and
xx approach". In: Journal of Optical Communications and Networking, vol. 8, no. 7, pp. A76-A85, 2016. DOI: 10.1364/JOCN.8.000A76.
[6] M. Cantono, V. Curri, A. Mecozzi, and R. Gaudino, "Polarization-Related Statistics of Raman Crosstalk in Single-Mode Optical Fibers". In: Journal of Lightwave Technology, vol. 34, no. 4, pp. 1191-1205, 2016. DOI: 10.1109/JLT.2015.2506481.
[7] M. Cantono, V. Curri, and R. Gaudino, "Raman Crosstalk Suppres-sion in NG-PON2 Using Optimized Spectral Shaping". In: Journal of Lightwave Technology, vol. 33, no. 24, pp. 5284-5292, 2015. DOI: 10.1109/JLT.2015.2501058.
[8] M. Cantono, V. Curri, A. Mecozzi, and R. Gaudino, "Interplay between Raman and polarization effects in next-generation passive optical net-works". In: Optics Express, vol. 23, no. 11, pp. 13924-13936, 2015. DOI: 10.1364/OE.23.013924.
[9] M.S. Khaliq, M. Cantono, S. Straullu, and V. Curri, "Performance assess-ment of short-reach multi-level pulse-amplitude modulation transmis-sion exploiting least-mean-square equalisation", In: IET Optoelectronics, vol. 11, no. 4, pp. 134-140, 2017. DOI: 10.1049/iet-opt.2016.0148.
Contributions to International Conferences
[1] M. Cantono, S. Piciaccia, A. Tanzi, G. Galimberti, B. Smith, M. Bianchi, and V. Curri, "A Statistical Assessment of Networking Merit of 2MxN WSS", in 2018 Optical Fiber Communications Conference and Exhibition, OFC 2018 - Proceedings, OSA, Mar. 2018, Paper M1A.3.
DOI: 10.1364/OFC.2018.M1A.3.
[2] M. Cantono, J.L. Auge, and V. Curri, "Modelling the Impact of SRS on NLI Generation in Commercial Equipment: an Experimental In-vestigation", in2018 Optical Fiber Communications Conference and Exhi-bition, OFC 2018 - Proceedings, OSA, Mar. 2018, Paper M1D.2. DOI: 10.1364/OFC.2018.M1D.2.
[3] M. Cantono, F. Guiomar, A. Carena, and V. Curri, "Networking Benefit of Multi-Subcarrier Transceivers", in2018 Optical Fiber Communications Conference and Exhibition, OFC 2018 - Proceedings, OSA, Mar. 2018, Paper Tu3E.1. DOI: 10.1364/OFC.2018.Tu3E.1.
[4] M. Cantono, D. Pilori, A. Ferrari, A. Carena, and V. Curri, "Observing the Interaction of PMD with Generation of NLI in Uncompensated Am-plified Optical Links", in2018 Optical Fiber Communications Conference and Exhibition, OFC 2018 - Proceedings, OSA, Mar. 2018, Paper W1G.4. DOI: 10.1364/OFC.2018.W1G.4.
[5] D. Pilori, M. Cantono, A. Carena, and V. Curri, “FFSS: The fast fiber simulator software”, in2017 19th International Conference on Transparent Optical Networks (ICTON), IEEE, Jul. 2017, pp. 1–4. DOI: 10.1109/IC-TON.2017.8025002.
[6] M. Cantono, and V. Curri, “Flex- vs. fix-grid merit in progressive loading of networks already carrying legacy traffic”, in2017 19th International Conference on Transparent Optical Networks (ICTON), IEEE, Jul. 2017, pp. 1–4. DOI: 10.1109/ICTON.2017.8025171.
[7] M. Cantono, and V. Curri, “Identifying and unlocking topological bot-tlenecks using SNAP and SDM solutions”, in 2017 19th International Conference on Transparent Optical Networks (ICTON), IEEE, Jul. 2017, pp. 1–4. DOI: 10.1109/ICTON.2017.8025043.
[8] A. Ferrari, M. Cantono, U. Waheed, A. Ahmad, and V. Curri, “Network-ing benefits of advanced DSP techniques and hybrid fiber amplifica-tion”, in2017 19th International Conference on Transparent Optical Networks (ICTON), IEEE, Jul. 2017, pp. 1–4. DOI: 10.1109/ICTON.2017.8025170. [9] A. Ferrari, M. Cantono, and V. Curri, "Routing Space Size Estimation
for Reconfigurable Optical Networks". in19th Italian National Conference on Photonic Technologies, Fotonica 2017, IET, May 2017.
[10] M. Cantono, A. Ferrari, and V. Curri, "SNAP-Driven Updates of Physical Layer to Improve Performances of Photonic Networks". in19th Italian National Conference on Photonic Technologies, Fotonica 2017, IET, May 2017.
xxii [11] M.Quagliotti, D. Cifuentes Arango, M. Schiano, A. Carena, M. Cantono, and V. Curri, "Spectrum Fragmentation Metrics and their Use in Optical Channel Allocation Algorithms". in19th Italian National Conference on Photonic Technologies, Fotonica 2017, IET, May 2017.
[12] A. Ferrari, M. Cantono, and V. Curri, "Networking Benefits of Advanced DSP Techniques". in19th Italian National Conference on Photonic Technolo-gies, Fotonica 2017, IET, May 2017.
[13] M. Cantono, A. Ferrari, U. Waheed, A. Ahmad, H. Zaidi, A. Bianco and V. Curri, Networking benefit of hybrid fiber amplification for lightpath regenerators saving”, in 2017 Optical Fiber Communications Conference and Exhibition, OFC 2017 - Proceedings, OSA, Mar. 2017, Paper W4F.7. DOI: 10.1364/OFC.2017.W4F.7.
[14] M. Cantono, R. Gaudino, and V. Curri, "A statistical analysis of trans-parent optical networks comparing merit of fiber types and elastic transceivers". in 2016 18th International Conference on Transparent Op-tical Networks (ICTON), IEEE, Jul. 2016, pp. 1–4. DOI: 10.1109/IC-TON.2016.7550511. Exhibition, OFC 2017 - Proceedings, OSA, Mar. 2017, Paper W4F.7. DOI: 10.1364/OFC.2017.W4F.7.
[15] M. Cantono, R. Gaudino, and V. Curri, "Data-rate figure of merit for physical layer in fixed-grid reconfigurable optical networks". in2016 Optical Fiber Communications Conference and Exhibition, OFC 2016 - Pro-ceedings, OSA, Mar. 2016, Paper Tu3F.3. DOI: 10.1364/OFC.2016.Tu3F.3. [16] V. Curri, M. Cantono, and R. Gaudino, "Elastic All-Optical Networks: A New Paradigm Enabled by the Physical Layer. How to Optimize Network Performances?". in2016 European Conference on Optical Com-munication, ECOC 2016 - Proceedings, VDE, Sep. 2016, pp. 274-276. [17] M. Cantono, R. Gaudino and V. Curri, "Comparing networking benefits
of Digital Back-Propagation vs. Lightpath Regeneration". in2016 Eu-ropean Conference on Optical Communication, ECOC 2016 - Proceedings, VDE, Sep. 2016, pp. 403-405.
[18] M. Cantono, R. Gaudino, and V. Curri, "The statistical network assess-ment process (SNAP) to evaluate benefits of amplifiers and
transpon-ders’ upgrades". in18th Italian National Conference on Photonic Technolo-gies, Fotonica 2016, IET, May 2016, DOI: 10.1049/cp.2016.0869.
[19] M. Cantono, A. Mecozzi, V. Curri, and R. Gaudino, "Optimal polariza-tion launch for Raman deplepolariza-tion minimizapolariza-tion in GPON and TWDM-PON coexistence". in2015 Optical Fiber Communications Conference and Exhibition, OFC 2015 - Proceedings, OSA, Mar. 2015, Paper Th2A.60. DOI: 10.1364/OFC.2015.Th2A.60.
List of activities and collaborations
• Collaboration with Cisco Photonics on innovative design strategies for transparent optical networks -2015 - ongoing
• Collaboration with SM Optics on impairment modeling in legacy 10G networks -2016 - ongoing
• Collaboration with Synopsys on simulation of optical communication systems -2015 - ongoing
• Summer Internship within the Optical Network Architecture and Op-erations Group - Google Inc. -Summer 2017
• Collaboration with the Physical Simulation Environment group of the Telecom Infra Project on the development of a vendor-agnostic QoT estimator -2017 - ongoing
• Collaboration with OpNear Lab at the University of Texas at Dallas on the development of a Quality of transmission estimation module to be integrated into the ProNet multilayer orchestrator -2017 - ongoing
Chapter 1
Introduction
In the last 50 years, the improvements made in terms of capacity, reliability, and flexibility of optical communication systems and networks have been extraordinary. Performances of optical communications systems have always been tightly related to the evolution of optical fiber cables and photonic tech-nologies used to manipulate light. Based on this, in this thesis we consider how the awareness about photonic technologies capabilities and their impact on signal quality can be exploited in the process of designing, update and intelligently manage optical networks. In Chapter1, an introduction about optical communication technologies and trends in communication networks will be given. Then in Chapter 2, different physical layer models will be presented and their effectiveness in network performance prediction will be discussed. Later in Chapter3, a framework on physical layer aware network design will be presented, and several examples of application will be shown. Then, in Chapter4, studies on physical layer aware management of networks will be presented. Finally, in Chapter5conclusions will be given and next steps will be discussed.
1.1
Optical Networks: an introduction
Optical networks are communication networks made of interconnected op-tical fiber cables and constitute the enabling backbone technology of the Internet as we know it today. In optical networks, information is transmitted
through light channels sent over optical fiber cables. Thanks to their unique properties such as low loss and ultra-wide bandwidth, optical fibers enable reliable, high capacity and long-distance communication.
One of the greatest leaps in optical communications has been represented by the evolution from point-to-point communication, where data are trans-mitted between only two nodes, to fully meshed networking, where optical channels1can be added, dropped, and routed at any node. Nowadays,
mod-ern optical network architectures provide both high-capacity backhauling to upper network layers, such as the Internet Protocol (IP) layer and the intelligence required for more complex network operations such as efficient routing, protection, and fast circuit restoration. All these capabilities have been enabled by the development of optical network elements and photonic technologies with the potentialities to handle such challenges in an efficient manner. In general, performances of optical networks are tightly related to the evolution of optical fiber cables and photonic technologies used to manipulate the light channels. In the last 50 years, the improvements made in terms of capacity, reliability, and flexibility are extraordinary.
The first deployments of optical communication technologies date back to 1977 when the first point-to-point optical links were installed in Turin (Italy) and Long Beach (US, California) to carry live telephone traffic [1]–[3]. In the 1980s, the steady reduction of fiber losses, and the development of Erbium Doped Fiber Amplifiers (EDFAs) [4] enabled an unprecedented increase in optical reach of point-to-point systems. As far as transceivers are concerned, data rates per channel have consistently grown with a Compound Annual Growth Rate (CAGR) of 20%[5], moving from few Mbps of Intensity Modula-tion with Direct DetecModula-tion (IMDD) based transceivers, to 400 Gbps channels based on polarization multiplexed (PM) high order quadrature amplitude modulation (QAM) formats received using a polarization diversity coher-ent receiver. Thanks to digital signal processing (DSP) capabilities, modern transceivers allowed a relevant simplification of optical line systems thanks to the removal of in-line dispersion compensating units (DCUs) , allowing
1In this thesis, we will refer to optical channels, or wavelenghts, or lightpaths. In general,
a channel is a portion of the optical spectrum carrying data between a transmitter and a receiver.
1.1 Optical Networks: an introduction 3 a relevant complexity reduction in link design and optical infrastructure management.
A further increase in capacity of optical systems has been enabled by the introduction of Wavelength Division Multiplexing (WDM) techniques. By centering optical channels around different optical frequencies, the fiber bandwidth is efficiently used by carrying multiple optical channels, thus increasing the total amount of carried data. In the 1990s, commercial WDM systems experienced an aggregate per-fiber capacity growth at a 100% CAGR, i.e. doubling capacity year by year. After the year 2000 and the infamous Telecom or Dot-Com bubble[6], [7], such growth has rapidly decreased to a 20% CAGR[5], following the same trend of single channel data rates. This means that practically, the number of WDM channels in commercial systems has been constant for almost two decades, being close to 100 channels. How-ever, today such trend is changing, as C+L band systems that exploit close to 200 WDM channels are gaining traction [8], and commercial systems with these characteristics are nowadays available [9].
One of the most relevant advance in optical networking architectures has been represented by the introduction of add, drop and routing capabilities of optical channels at individual network nodes. This allowed to greatly simplify channels deployment, automating the time consuming and error prone practice of manually rearranging optical channels through optical demultiplexers and patch panels [10]–[13]. Furthermore, this empowered an unprecedented network agility that has been exploited to enable reliable and intelligent networks [14]. The network elements that enabled such progress, are optical add drop multiplexers (OADMs) . OADMs were first constructed from optical filters, allowing for independent wavelengths to be terminated at network nodes, or to bypass them. OADMs are based on prearranged and fixed optical configurations, thus one of their main disadvantages is their limited adaptability with respect to traffic and channels configuration variations. To solve this issue, reconfigurable optical add drop multiplexers (ROADM) have been proposed, and nowadays ROADMs are heavily deployed in the majority of existing optical networks, enabling fully agile, highly connected and dynamically reconfigurable photonic mesh.
1.2
Capacity Crunch and Revenue Compression
in the Telecom Industry
Although the capability of photonic technology to carry more and more data has consistently grown in the last decades, the growth of global IP traffic has been even more impressive. Depending on sources, traffic and geographical taxonomies, network traffic growth is envisioned to grow at a CAGR that varies from 25% to 80% [5], [15]–[17]. High definition video applications and Machine-to-Machine (M2M) communications will represent the main drivers of such impressive growth [15], [18]. The Cisco Visual Networking Index (VNI)[15] is one of the most reputable sources for IP traffic volume forecasting. In its latest VNI report, Cisco states that the worldwide IP traffic will grow with a CAGR of 24% up to 2021, reaching a total of 232.7 Exabytes (EB)2per month in 2021. Breaking down the total traffic prediction by type,
forecasts show that mobile traffic will increase by a 43% CAGR, whereas fixed Internet and managed IP services will grow by a 23% and 13% CAGR respectively [15]. As shown in Fig.1.1a, fixed Internet traffic will represent the majority (68%) of the overall IP traffic across the considered 5 years. Managed IP services will instead decrease from 24% to 15% of the overall traffic. Mobile traffic will progressively increase from 7% to 17% of the overall traffic, overcoming managed IP services during 2020.
As forecasting results heavily depend on the underlying assumptions used to extrapolate data, it is interesting to analyze historical traffic data from Internet Service Providers (ISPs) and Internet Exchange (IX) consortia. Fig.1.1bdepicts the total (ingress+egress) average monthly traffic passing through the Amsterdam Internet Exchange (AMS-IX) over a 16 years time span, from July 2001 up to September 2017. Data depicted in Fig. 1.1b have been elaborated from the one publicly available in [17]. In 2001, the average monthly traffic flow was around 6 Gbps, corresponding to a total of 1950 Terabyte (TB) exchanged on average each month. In 2017, the average monthly traffic flow went up to 6.839 Tbps, corresponding to an average of 2216 Petabyte (PB) exchanged each month. This growth corresponds to a CAGR of 55%, that can be further split in a 120% growth from 2001
1.2 Capacity Crunch and Revenue Compression in the Telecom Industry 5 1 10 100 2016 2017 2018 2019 2020 2021 To ta l I P Tr af fic [E B/ m on th ] Year
Cisco VNI - IP Traffic Breakdown
Fixed Internet Managed IP Mobile Data
(a) Cisco Visual Networking Index global IP traffic predictions. 1 10 100 1,000 10,000 2001 2004 2008 2011 2014 Mo nt hl y Tr af fic [G bp s] Year AMS-IX
(b) Total monthly traffic of the Amster-dam Internet Exchange.
100 1,000 10,000 100,000 2007 2009 2011 2013 2015 Av er ag e Ag gr eg at ed P ea k T ra ffi c [ G bp s] Year EURO-IX
(c) Average aggregated peak traffic in the IXs of the Euro-IX consortium.
1 10 100 1,000 2007 2008 2011 2013 2015 2017 Av er ag e Ag gr eg at ed Tr af fic [G bp s] Year
Seattle Internet Exchange
(d) Seattle Internet Exchange total aggre-gated IP traffic.
Fig. 1.1 Predictions and statistics for IP traffic from different sources. Data elabora-tion have been performed starting from the data reported by Cisco VNI [15], the Amsterdam Internet Exchange [17], the European Internet Exchange consortium [16], and the Seattle Internet Exchange [19].
to 2007 and a 30% growth in the next 10 years. A similar trend can be observed in the monthly averaged peak traffic aggregated over all IXs of the European Internet Exchange (EURO-IX) consortium depicted in Fig. 1.1c, with a 46% CAGR from 2007 to 2016, moving from 955 Gbps in 2007 to 23.2 Tbps in 2016. This trend can be further divided into a 60% growth from 2007 to 2011 and a 30% growth from 2011 to 2016. These double regimes in traffic growth can be attributed to the fact that several over-the-top (OOT) content providers such as Google, Netflix, Facebook started to perform private peering, thus not relying on public IX providers [20], [21] and use private content delivery networks (CDNs) and caches to serve their users directly from their private networks [22]–[25]. This entails that certain traffic types such as video streaming applications are bypassing public IXs, thus they are not taken into account into data volume statistics. This behavior is not present in the data of the Seattle Internet exchange (SIX) that are depicted in Fig.1.1d, where the average aggregate traffic has been steadily growing in the last 10 years from 7 Gbps in 2007 to the current 707 Gbps with a 58% CAGR [19].
Optical communication technologies have been the key enablers of this impressive growth rate, but as of today, they are getting closer to approach-ing fundamental limits of optical system information capacity. Specifically, performances of optical systems are close to the nonlinear Shannon limit [26], that represents the ultimate limit for a point-to-point fiber optics commu-nication system. Therefore maximum data rates of optical commucommu-nication systems are starting not to keep up with the pace of growth of IP traffic [5]. This is putting a lot of pressure on the telecom industry to find economically sustainable solutions to accommodate such a high bandwidth demand. This requirement is even more stringent if one considers that revenues for telecom operators have been steadily decreasing in the last decade, and it has been predicted that cost per bit will exceed operator revenues [27] even though the cost per bit is decreased by 26% in the period between 2006 and 2013 [28]. As an example, Fig.1.2depicts the global operator revenues that are obtained from fixed voice and broadband services reported in [29]: a -2% CAGR is predicted up to 2019. Although operators are recovering from this losses by providing new services such as cloud computing and CDN services [28], they need to optimize their returns over investment (ROI) for optical
net-1.2 Capacity Crunch and Revenue Compression in the Telecom Industry 7 500 520 540 560 580 2012 2013 2014 2015 2016 2017 2018 2019 Re ve nu es [B ill io n U SD ] Year
Fixed Voice and Broadband Revenues
Fig. 1.2 Global Fixed Voice and Broadband revenues. Data taken from [29]. working equipment and installed fibers [30]. In particular, operators want to exploit as much as possible the existing fiber infrastructure that was mainly installed before the dotcom bubble in the 2000s, as replacing deployed fiber is extremely expensive [30].
Operators are therefore acting under two opposite forces: they need to be able to provide the infrastructure to sustain the growth in traffic while balancing costs and revenues. In this context, a clear assessment of the im-pact of photonic communication technologies in terms of network capacity improvement, improved network management opportunities and the re-lated costs/benefits trade-offs is a firm requirement for both operators and vendors. The formers need to understand which technologies should be used in designing and upgrading new and existing topologies, the others need to understand which technology should they focus on for their future developments. Traditionally, the impact of transmission layer technologies is analyzed in the context of fully-loaded point-to-point links, but this consti-tutes an upper limit for network performances as wavelength and spectrum contention prevents a full usage of the spectrum in fiber links. One of the aims of this thesis is to provide a framework of analysis to fairly assess photonic layer technologies in the context of transparent, reconfigurable and flexible optical networks, starting from a detailed modeling of the physical layer impairments. Before digging into the main topics of this thesis, an overview of state of the art optical networking infrastructure will be given.
1.3
Flexible, transparent and reconfigurable
opti-cal networks
One of the main leaps in optical communications technologies has been represented by the introduction of DSP-based transceivers operating with multilevel modulation formats with coherent receivers and channel equaliza-tion [31], [32]. Thanks to them, backbone optical networks have changed in nature over the last decade. Due to the deployed transmission techniques based on direct-detection (DD) transceivers, optical links in legacy networks behaved like sealed data pipelines, not allowing much flexibility in reach or bitrate adaptation. This was due to the fact that DD transceivers required optimized dispersion compensation along optical links to achieve sufficient reach performances [33], [34]. However, such optimization was only effec-tive for a given modulation format, bit rate, and WDM channel spacing. In this scenario, transparent wavelength routing was limited and forced to be established in the network design phase, and optical-electro-optical (OEO) traffic regeneration in nodes was heavily adopted due these inherent tech-nological limitations. Thus, in general, transparency and flexibility at the logical network level were not met at the optical transmission level. Capacity and connectivity matrices in legacy networks were sparse and static [35], as optical capacity was immutably established during the network design phase due to the tight operative constraints imposed by dispersion management schemes.
During the last decade, the development of fast digital-to-analog (DAC) and analog-to-digital (ADC) converters , together with fast DSP units, has enabled an unprecedented flexibility in optical transmission [36]. The in-troduction of electronic dispersion compensation (EDC) [37], [38] and DSP-enabled equalization [39] allowed to easily compensate all linear propagation effects such as chromatic dispersion (CD) , and polarization mode dispersion (PMD) at the receiver stage. The introduction of DSP based transceivers enabled the development of adaptable optical transmitter and receivers that operate using different signal constellations that dynamically trade-off rate and sensitivity at a given spectral occupancy [40], [41]. More importantly, DSP-enabled transceivers allowed to remove DCUs from optical links
with-1.3 Flexible, transparent and reconfigurable optical networks 9 out performance penalties [42], making possible a decoupling of optical line systems and line terminals. A first direct consequence of this has been represented by an improved flexibility in transparent wavelength routing, as optical channels can be routed over different optical links as precisely tuned dispersion management is not necessary anymore, provided that their quality-of-transmission (QoT) is maintained above an in-service threshold that depends on the transceiver implementation. This capability drove the development of improved ROADM architectures that enabled reconfigurable and transparent optical networking [11].
Furthermore, DSP-enabled transceivers opened new disaggregation op-portunities in the optical communications industry enabling the optimization of infrastructure’s total cost of ownership (TCO) : open-line systems [43] and optical white boxes [44] have been introduced to resolve vendor lock-in decoupling of common optical line pieces of equipment such as fiber, ampli-fiers, optical switches, gain equalizers, etc., from line terminals, i.e. optical transceivers. Such practice has been taken from data center deployments. Data centers are built upon interchangeable, highly standardized node and network architectures rather than a sum of isolated solutions. This leads to a better utilization of line systems and faster innovation due to the decoupling of deployment cycles for line systems and transceivers, thus, in general, lower TCOs.
Fig.1.3and Fig.1.4represent the evolution of optical line systems enabled by disaggregation and decoupling of line terminals and line optics. Fig.1.3 depicts a single-vendor legacy line system in which a vendor-provided con-troller was responsible for the management of both line and terminal equip-ment. In such scenario with vendor lock-in, operators had not much room for the development of custom controllers, as they had to rely completely on the vendor provided control software yielding an overall rigidity in the design and management of optical networks. This approach to line design was strictly related to the limitations imposed by legacy transceivers, but also the first generations of coherent transceivers have been marketed with the same approach with respect to line system integration. The following generation of coherent transponders and line systems have been proposed to leverage line disaggregation and multi-vendor interoperability. Fig.1.4 represents one of such novel systems, where both line (such as Optical line
Transmitter Transmitter Transmitter … … OLA ROADM W D M M ux
Fiber Fiber OLA
Receiver Receiver Receiver … … W D M D em ux …
Line System Control
… …
Single Vendor Integration, Control and Support
Fig. 1.3 Legacy line systems in optical networks with single vendor integration. amplifiers (OLAs) and ROADMs) and terminal components can be managed and monitored through open Application Programming Interfaces (APIs) . Thanks to these software interfaces, optical equipment can be controlled and orchestrated by a centralized software intelligence that each operator and network manager can program based on its own personal use cases. If inter-faces are kept equal among different vendors, multi-vendor interoperability is made possible. This is one of the motivations behind the different public initiatives and multi-source agreements (MSAs) that several operators have launched in the last 3 years to promote the development of common APIs and data models. Among these initiatives it is worth to mention OpenConfig (lead by Google) [45], the Telecom Infra Project (TIP) (lead by Facebook) [46], and OpenROADM (led by AT&T) [47]. Besides network disaggregation and software defined operations, network architectures evolved towards elasticity and flexibility especially in the spectral dimension. As early as 2008 [48], spectrally elastic optical network (EON) technology was advocated as a possible solution to Internet traffic growth, enabling a superior flexibility and scalability in spectrum allocation [49].
In this modern network scenario, capacity and connectivity matrices of optical networks are now full and elastic, i.e. modifiable over a short time scale [35]. Hence, state-of-the-art optical networks are indeed transparent at every level, and the orchestration [50] of logical and physical layer permits to adapt traffic allocation in order to properly respond to variations in traffic requests over a short time-scale enabling fast service provisioning.
State-of-1.4 Outline of the remainder of this thesis 11 Transmitter Vendor A Transmitter Vendor C Transmitter Vendor B … … OLA ROADM W D M M ux
Fiber Fiber OLA
Receiver Vendor C Receiver Vendor A Receiver Vendor B … … W D M D em ux … SDN Controller / Orchestrator … …
Open Line System Line Systems Open API
Vendor API for Management and Telemetry
Fig. 1.4 Open line system approach with multi-vendor interoperability and central-ized orchestration.
the-art modern optical networks are therefore truly flexible, reconfigurable and transparent as it is possible to: assign capacity dynamically, react to un-expected traffic variations or failures while routing transparently channels in the optical domain without relying on upper electrical layers. In such a novel context, every equipment and transmission technique at the physical layer impacts the overall network behavior. Hence, methods givingquantitative evaluations of individual merit of physical layer equipment at network level are a firm request duringnetwork designphases as well as during network lifetime, when it is essential for theorchestrationof logical and transmission layers and for addressing selected upgrades to properly react to growth and modifications of traffic requests. Thereforephysical layer awarenessin network design and operation is fundamental to fairly assess the potentialities, and exploit the capabilities of different physical layer technologies in modern flexible, transparent and reconfigurable optical networks. Furthermore, such physical layer awareness has to be vendor agnostic, to be fully adaptable to disaggregated multi-vendor scenarios such as the ones of modern optical telecommunications infrastructure.
1.4
Outline of the remainder of this thesis
In this thesis, a design framework and example of applications of physical layer awareness in optical orchestration are proposed and discussed. All
of them are built upon detailed modeling of propagation impairments af-fecting optical signals transmitted over the previously described network architecture, as it represents a fundamental requirement to estimate capacity, and assess routing feasibility both at the design and operational phase of the network. Thus as a first step, in the chapter2the dominant propagation impairments in optical fibers are discussed. Then, several nonlinear mod-eling options to estimate nonlinear propagation impairments are reviewed and extended. Based on them, a simple power optimization approach is presented.
In chapter3a design framework called the Statistical Network Assess-ment Process (SNAP) will be presented and several examples of applications will be given.
Finally in chapter 4, an example of applications of the physical layer models discussed in chapter2for the implementation of a vendor-agnostic quality of transmission estimator will be given.
The main novelties reported in this thesis include:
• An assessment of the impact of Polarization Mode Dispersion on non-linear interference generation
• A generalization of the Gaussian Noise (GN) for wideband scenario including spatial and frequency loss/gain profile variations, and its experimental validation
• The integration of the SNAP framework and examples of its application • The integration of the GN model in orchestration platforms and for the unified design of multivendor network solutions within the TIP organization
Chapter 2
Physical Layer Modeling for
Physical Layer Aware Networking
In this chapter, the linear and nonlinear impairments of fiber propagation are briefly discussed. Then different nonlinear modeling options for physical layer aware optical networking are presented. A review of the most common nonlinear models of fiber propagation is presented, and their pros and cons in terms of applicability to a networking scenario are discussed. Finally, a wideband extension of the Gaussian Noise (GN) model, the so-called Gener-alized Gaussian Noise (GGN) model , and its simulative and experimental validation are presented.
2.1
An introduction to optical propagation
impair-ments
Light signals that propagate along multi-span amplified optical fiber links undergo several physical modifications that impair their capability of car-rying information. Putting aside stochastic noise generated by transceivers such as - to mention a few - electrical, thermal, quantization, shot and laser phase noise, the root causes of signal degradation are Amplified Spontaneous Emission (ASE) noise generated by optical amplifiers, linear and nonlinear effects causing signal distortion [51]. Fig.2.1 qualitatively highlights the
Transmitter
Transmitter
Transmitter OLA ROADM
W
D
M
M
ux
Fiber Fiber OLA
Receiver Receiver Receiver … … W D M D em ux …
Loss, CD, PMD, PDL, Kerr Effect, SRS ASE Noise
Filtering penalties
Fig. 2.1 Sources of propagation impairments in an optical communication system .
sources of these different propagation impairments, i.e. fibers, amplifiers and ROADMs.
All propagation effects that depends linearly with the electric field are classified as linear ones. Linear effects include for example: chromatic dis-persion (CD) i.e. a dependence of the group velocity of the signal and its optical frequency [51], polarization mode dispersion (PMD), i.e. a depen-dence of the group velocity of the signal and its polarization state [52]–[54], polarization dependent loss (PDL), i.e. a random dependence between signal attenuation and polarization [55], signal attenuation due to fiber attenuation, filtering and crosstalk effects at ROADM nodes [56]–[58]. All dispersion and filtering effects cause signal pulses to spread in time, yielding inter-symbol interference (ISI) that impairs the signal. However, the majority of them can be compensated using digital equalization through DSP at the receiver [31], [32], [37], [39], whereas fiber losses are easily recovered through optical amplification.
On the other hand, nonlinear effects are not in linear proportion to the electric field of the signal [51]. Among nonlinear effects is worth citing the Kerr effect, Stimulated Raman Scattering (SRS), and the Stimulated Brillouin Scattering (SBS). The Kerr effect, that causes signal phase distortion due to the dependence of the refractive index of the glass with the power of the optical signal traveling through it [51]. Due to fiber dispersion, such phase distortion is converted into amplitude distortion causing severe penalties. Furthermore, the Kerr effect imposes a limitation on the signal power that needs to be transmitted into an optical fiber link. To this purpose, optical
2.1 An introduction to optical propagation impairments 15 power optimization strategies are required to maximize the signal Quality-of-Transmission (QoT). As the Kerr effect is one of the most limiting propagation impairments in optical fiber communications, the prediction of its impact on signal quality and the derivation of optimal launch power strategies have been active fields of research over the last couple of decades. During this timespan, several nonlinear models have been developed to achieve this goal so as to facilitate planning, design, and management of coherent optical communication systems and networks. In section2.5 we will review the broad family of the so-called Gaussian noise models, and highlight the most relevant ones to be used in the context of physical layer aware networking.
SRS [51], [59], [60] and SBS [51], [61] are related to a transfer of energy from the optical field to vibrational modes of silica. In case of SRS, optical phonons are excited, whereas for SBS acoustic ones. SBS is a narrow-band effect (few MHz) affecting, in general, a single channel [51] causing power depletion through the generation of a counter-propagating wave inside the fiber. Nevertheless, SBS is a weak effect for modern communications optical systems where optical signals have in general a spectral occupation much larger than the one for which SBS has peak efficiency. Furthermore, modern multilevel modulation formats have no carrier tones, which helps in further suppressing SBS. On the other hand, SRS is a wideband effect, as the scattering process is significant over spectral occupations of the order of few THz. In modern optical communication systems, SRS causes a power transfer between higher frequency channels to lower frequency one, thus producing a tilt in the power spectrum of the WDM channel comb [62]. As SRS efficiency in silica core fiber is maximum for signals with a frequency separation of approximately 13 THz [51], [60], it is a relevant effect for WDM systems operating over the full C-band and for future C+L band WDM systems [62], [63]. In such future wideband scenario, the interplay between different nonlinear effects like the Kerr effect and SRS needs to be understood. To this purpose, in this thesis, a novel nonlinear model to take this into account is proposed and validated via experiments and simulations.
In the next sections, first different metrics for QoT will be discussed, then a detailed description of different propagation impairments and how to model them will be given.
2.2
The Signal-to-Noise Ratio as a QoT metric
In optical communications, the QoT of a signal has been measured using several different metrics. In legacy scenarios with IMDD transceivers with dispersion compensation, the most widely used metric was the so-called Q-factor [64]–[66]. The Q-factor is directly linked to the BER of the channel under test by the following:
BER= 1 2erfc Q √ 2 (2.1) For IMDD, on-off keyed (OOK) signals, the Q-factor can be directly related to the mean levels of the 0 and 1 bit symbols and their standard deviation that can be directly measured from an eye diagram [65], [66]. BER and the Q-factor have been used in physical layer aware networking studies and been object of optimization in the last decade [67]–[69].
With the advent of transceivers with coherent detection, the reference metric for assessing the QoT of a signal has changed to the signal-to-noise ratio (SNR) . It should be noted that for QPSK and PM-QPSK signals, the SNR corresponds to the squared Q-factor. For higher order modulation format such relationship does not hold anymore. In digital transmission, for channels impaired by additive white Gaussian noise (AWGN) , SNR is defined as the ratio between the average power of the useful signalPch, and
the average noise powerPnoise impairing it [70], i.e.
SNR= Pch
Pnoise (2.2)
We usually consider both Pch and Pnoise as the signal and noise powers
evaluated in the digital domain at the receiver, i.e. in a discrete time domain, after demodulation, equalization, match filtering and sampling. However, assuming ideal coherent transceivers, the transformation from analog to digital domain can be mapped as a linear transformation, therefore a one-to-one mapping between the power computation over these two domains exist. More specifically, with a coherent receiver, there is a one-to-one mapping between the analog optical domain and the electrical digital domain. For this reason, SNR is often related to the so-called Optical SNR (OSNR) , that is the
2.3 Modeling ASE noise 17 ratio between the power of the optical signal and the power of the optical noise. The main difference between the two, is due to the fact that in general OSNR is expressed with respect to a specific noise bandwidthBnoise, whereas
the SNR always refers to the bandwidth of the matched filter used for the detection, i.e. the symbol rate of the signalRs. The relationship between SNR
and OSNR is the following:
SNR=OSNRBnoise
Rs (2.3)
From Eq. 2.3, it is obvious that the SNR and the OSNR are equal when
Bnoise =Rs. Such difference between SNR and OSNR has historical reasons,
as OSNR has been defined as a metric to express the ratio between signal power and ASE noise, i.e. AWGN. In this context, OSNR measurements are performed by means of an Optical Spectrum Analyzer (OSA) by evaluating the difference between the integral of signal level and the integral of the noise floor over a certain bandwidth, i.e. the noise bandwidth over which the OSNR is defined. A typical reference noise bandwidth is the 0.1 nm bandwidth, that in the C-band roughly correspond to 12.5 GHz.
Throughout this thesis, SNR will be assumed as the reference QoT metric, as it assumed that all noise-related propagation impairments can be mod-eled as AWGN. As detailed described in the next section such hypothesis holds well for both ASE noise and nonlinear disturbances generated by the Kerr effect, therefore SNR is a safe metric to use. Specifically, the so-called generalizedoreffectiveSNR [71] will be proposed.
Furthermore, SNR is also directly related to BER, and, more generally, to the quantity of information that can be transmitted over a link, i.e. its capacity. In the following section, we will describe how to model different propagation impairments in order to derive the SNR as QoT metric.
2.3
Modeling ASE noise
ASE noise is one of the main source of impairments in optical communication systems. As its name suggests, ASE noise arises from spontaneous emission of the gain medium in an optical amplifier. Considering Erbium Doped Fiber
Amplifiers, it is possible to model the ASE noise as additive White Gaussian Noise with bilateral PSD including both polarization [65], [72] given by
GASE=2hf0nsp(G−1) (2.4)
whereh=6.626×10⁻³⁴J·s is the Planck’s constant,f0is the carrier frequency
of the signal being amplified, G is the amplifier gain in linear units and nsp>1 is the spontaneous emission factor or inversion factor.nspis directed related to the atomic populations in the ground and excited states of the Erbium atoms [65] and specifies the noise performance of an amplifier. From a system perspective, such quantity is often expressed using the noise figure parameterF, that is given by
F=2nsp (2.5)
therefore Eq.2.4can be expressed as
GASE =hf0F(G−1) (2.6)
Besides EDFAs, in long-haul optical communications, Raman amplifiers (RAs) , and Hybrid Erbium-Doped and Raman Amplifiers (HFAs) are widely used, as they enable improved noise performance with respect to standard EDFAs. For both of them, it is possible to derive equivalent noise figures to describe the accumulation of ASE noise [51], [65], [73], [74], using Eq.2.6to assess noise PSD.
2.4
Modeling filtering penalties and SRS crosstalk
Filtering penalties and SRS-induced crosstalk represents two additional limiting factors to the capacity of transparent and reconfigurable optical networks such as the ones considered in this thesis. Filtering penalties can be relevant as optical channels may traverse multiple ROADMs along their path and thus undergoing bandwidth narrowing causing ISI at the receiver. Modeling such ISI-induced penalty is nontrivial as it depends on many parameters including channel spectral shape, modulation format, DSP receiver structure. For these reasons, in literature, filtering penalties and related compensation strategies are often measured experimentally [56],
2.4 Modeling filtering penalties and SRS crosstalk 19 [58], [75] on a fixed setup. Among possible compensation strategies for avoid penalties it is worth to mention channel spectral shaping [58], [75], and improved receiver DSP structures [76]. As a general model for filtering penalties is nontrivial to get, in optical networking studies filtering penalties have often been neglected or taken into account in a simplified way, such as imposing a maximum tolerable number of cascaded ROADMs that a signal can traverse [77], or by considering a fixed SNR penalty term for each traversed ROADM. In the networking analysis described in this thesis, filtering penalties will be neglected, unless otherwise explicitly stated.
On the other hand, SRS-induced crosstalk in coherent optical communi-cation systems simply causes an inter-channel power transfer from higher frequency WDM channels to lower ones during propagation along the fiber, leading to a tilt of the overall WDM comb. For standard single mode fibers (SMF), the efficiency of this phenomenon is maximized for optical signals that are placed approximately 13 THz apart [51], but it is already visible for total spectral occupations of the order of few THz, corresponding to WDM comb made of at least 40 channels within the standard 50-GHz DWDM grid. Such power distortion effect can be easily modeled by considering an optical fiber as a filtering block, whose transfer function takes into account both losses and distributed gain/losses due to SRS. This means that given an input WDM comb with a PSDGTX(f), the PSD of the signal at the end of the
fiber is given by
G(f,z) =GTX(f)|ρ(z,f)|2 =GTX(f)ρ(z,f)2 (2.7)
where ρ(z,f) represents the field gain/loss profile of the fiber taking into
account losses and SRS-induced tilt. The termρ(z,f)can be estimated
exper-imentally or numerically by solving a set of coupled differential equations in
z. Notice that Eq.2.7can be used also for systems using Raman amplification
[51], [65], [73], [74], in which a distributed gain amplifies the optical channels as they travel through the fiber due the power transfer induced by one or more high frequency and high power pumps approximately 13 THz away from the WDM channel comb. However, in general Raman amplifiers have optimized pump profiles to deliver flat gain [73], such thatρ(z,f) =ρ(z). It
SNR variations by tilting the signal PSD. For Raman amplifiers, noise addi-tion should also be considered as described in Sec.2.3. However, since SRS is a distributed effect along the fiber longitudinal coordinatez, it must be
understood how it affects other distributed effects, such as the nonlinear Kerr effect. Such novel analysis will be described in Sec.2.7. Before doing so, an overview of the nonlinear Kerr effect will be given.
2.5
Modeling the nonlinear Kerr effect in
coher-ent optical systems
In this thesis we consider wavelength routed optical networks operated with DSP-enabled transceivers and dispersion uncompensated amplified optical links. In this transmission scenario, it has been extensively shown that impairments of fiber propagation due to loss, chromatic dispersion, and Kerr nonlinearity can beapproximatedas a small perturbative additive Gaussian disturbance on any single frequency [71], [78]–[91]. This effect has been called non-linear interference (NLI) . While NLI has, in general, a phase-noise component [87], it was found that, under normal operating conditions, such phase noise has a long correlation [92] so that it can be almost completely compensated by standard receiver phase recovery circuits. This justifies the assumption of modeling NLI as an AWGN. This fundamental results enabled the development of the so-called Gaussian noise models, that are analytical perturbation models for NLI estimation. These models obtain approximate solutions of the nonlinear Manakov Schroedinger equation [51], [52] leveraging on the key simplifying assumption that each WDM channel can be treated as a Gaussian noise spectrally shaped as the signal [71], [86]. This approach to nonlinear modeling was firstly proposed back in 1993 [93] and adapted up to early 2000s [94], [95] to model nonlinear Kerr effect in IMDD systems. Then it was used to achieve the same goal in optical orthogonal frequency division multiplexing (OFDM) systems [96]. At the beginning of 2010s, the same idea was used for coherent optical systems [71], [79], [82], [84], [88]–[91], and the name GN-model was first used in [71].
2.5 Modeling the nonlinear Kerr effect in coherent optical systems 21 The GN-model gives a formula to compute the power spectral density of the NLI – the so-called GN-Reference formula [71], [86] – that is a double integral derived from the Manakov Schroedinger equation [97]. Specifically the GN-reference formula is given by
GNLI(f) =16 27γ2 Z+∞ −∞ Z+∞ −∞ GTX(f1)GTX(f2)GTX(f1+f2−f)· ρFWM(f1,f2,f)df1df2 (2.8)
whereGNLI(f)is the nonlinear interference noise PSD in W/Hz at frequency
f, evaluated at the end of a transparent1fiber span.GTX(f)represents the PSD
of the transmitted WDM signal in W/Hz,γthe nonlinear fiber coefficient
measured in 1/W/km. ρFWM(f1,f2,f)represents the so-called Four-Wave
Mixing (FWM) efficiency [98], i.e.
ρFWM(f1,f2,f) = 1−e−2αLs+j4π2β2Ls(f1−f)(f2−f) 2α−j4π2β2Ls(f1−f)(f2−f) 2 (2.9) where α is the fiber field attenuation coefficient in 1/km, Ls is the span
length in km,β2is the fiber dispersion coefficient in ps/THz/km. Eq.2.9is
obtained assuming constant fiber loss coefficient vs. frequency, and lumped amplification at the end of the fiber. Later in Sec.2.7 a generalization of Eq.2.8will be proposed, specifically varying the FWM efficiency given by Eq.2.9in order to include space and frequency variations of the gain/loss profile of the optical fiber.
Eq.2.8, for uniform WDM combs – i.e. equal channels shaping and power levels – can be further simplified by normalizingGTX(f)with a power per
channel termPch, yielding a NLI power on the channel at frequencyfthat
can be written as
PNLI(f) =ηNLI(f)P3ch (2.10)
whereηNLIis the so-called NLI efficiency.
1We calltransparenta span in which all fiber and lumped losses (e.g. connector insertion
It should be noted that Eq.2.8does not make any assumption relatively to the channel modulation format but states that the NLI noise at any given frequency depends only on the spectral shape of the channels themselves and power levels, i.e. their PSD. Even though it has been highlighted that modulation format slightly affects the generation of NLI [99], [100], this characteristic of Eq.2.8allows to decouple QoT estimation and modulation format assignment. Furthermore, it has been widely demonstrated that Eq.2.8constitutes an upper boundfor the PSD of NLI noise [71], [86], [99], therefore it yields moderatelyconservativeQoT estimations. The root cause for NLI overestimation is due to the fact that the Gaussian signal assumption is validafterfew kilometers of propagation. The fact that such assumption is not verified at the beginning of the fiber leads to an overestimation error of
GNLI, i.e. in a slight underestimation in QoT.
Eq.2.8does not describe how the nonlinear noise accumulates along a set of concatenated fiber spans. To this regard, the GN-model has been proposed into two different forms, i.e. a coherent and an incoherent form respectively. In the coherent GN-model, the GN-reference formula is extended to periodic multi-span link as follows:
GcohNLI(f) =16 27γ2 Z+∞ −∞ Z+∞ −∞ GTX(f1)GTX(f2)GTX(f1+f2−f)· ρFWM(f1,f2,f)χ(f1,f2,f)df1df2 (2.11)
whereχ(f1,f2,f)is the so-called phased array factor as it formally looks like
a phased-array antenna radiation diagram [101], specifically
χ(f1,f2,f) = sin
2(2N
sπ2(f1−f)(f2−f)β2Ls)
sin2(2π2(f1−f)(f2−f)β2Ls)
(2.12) whereNsis the number of spans of the multi-span link, assuming all spans to
be equal. Eq.2.12takes into account the coherent interference occurring at the receivers among the NLI generated in each single span. On the other hand, in the incoherent GN-model the coherent accumulation of NLI is completely neglected, and the NLI generated in each span isindependentfrom the NLI generated in the previous ones. With such simplifying assumption, the PSD of the NLI generated at the end of a multi-span link made of Ns span
![Fig. 1.2 Global Fixed Voice and Broadband revenues. Data taken from [29].](https://thumb-us.123doks.com/thumbv2/123dok_us/520219.2561295/31.892.159.739.184.411/fig-global-fixed-voice-broadband-revenues-data-taken.webp)