MODELING ON TWITTER POSTS
Bruno Nascimento Rubio
Tampere University
Faculty of Natural Sciences
Computational Big Data Analytics M.Sc. thesis
Supervisor: Jaakko Peltonen May 2019
Tampere University
Faculty of Natural Sciences Computational Big Data Analytics
Bruno Nascimento Rubio: Analyzing Cryptocurrency Groups Using Topic Modeling on Twitter Posts
M.Sc. thesis, 67 pages, 5 index and 22 appendix pages May 2019
Cryptocurrencies are decentralized digital coins that use cryptographic protocols to provide more secure financial transactions. The world witnessed an impressive rise in the prices of these assets in the last few years, which stimulated a great interest regarding them. This thesis shifts the focus from the most notorious one, bitcoin, and from price aspects to concentrate on other cryptocoins and their technical features. A total of 25 cryptocoins were selected and then divided into 3 groups representing fundamental characteristics: Faster transactions, Smart Contracts and Privacy. Then, daily comments about these cryptocoins on Twitter were collected for 4 months. The main objective was to check whether the categorization fits well for each group, detect the prominent themes under discussion and perform a prediction task to see which ones may be discussed again in the future. Topic modeling, specifically Latent Dirichlet Allocation (LDA), was utilized to process the text data in order to find the topics that best represented each one of the groups. Coherence measures were applied to discover the optimal number of topics, which were later grouped into themes. Daily average probability distributions for topics, or topic weights, were treated as a time series data along with their theme representations. With that, it was possible to forecast theme weights using ARIMA and check the predictive ability of each theme by comparing mean squared error (MSE) of ARIMA and Naive methods. Overall, the cryptocoins seemed to be well represented since in every group there is at least one topic that directly refers to the meaning of the group. However, none of the previously mentioned topics was the most important in any of the groups. Faster transactions and Smart Contracts ended up being similar groups, having a Financial topic-group as the most notable theme, a similar organization of their remaining ones and low predictive ability, while the Privacy currency-group had different results, with a Mixed topic-group as the best-positioned theme and slightly better forecasting results.
Keywords: cryptocurrency, altcoins, twitter, topic modeling, latent Dirichlet allocation, coherence measures, time series data, faster transactions, smart contracts, privacy
ACKNOWLEDGMENT
I would like to express my gratitude to the teachers of Tampere University for the lectures that allowed me to greatly improve my knowledge of not only statistics and computer science but also of Finnish culture and society. I extend my thanks to my fellow colleagues, remembering how our group studies were essential to overcome the difficulties.
I also would like to thank my thesis supervisor Prof. Jaakko Peltonen, whose insightful remarks were a valuable contribution since the earliest stages of the research.
My sincere thanks to Fernando Pradella, who first introduced me to this fascinating world of cryptocurrencies. Last but not least, a special thanks to my beloved friends and family for being always present and supportive.
CONTENTS
1. INTRODUCTION ... 1
2. BACKGROUND ... 3
2.1 General view on Bitcoin ... 3
2.2 Altcoins ... 4
Smart Contracts ... 4
High privacy level / Anonymity ... 6
Faster transactions ... 7
2.3 Twitter ... 8
2.4 Topic Modeling ... 10
Latent Dirichlet Allocation (LDA) ... 11
Coherence Measures ... 15
2.5 Time Series Data ... 18
3. LITERATURE REVIEW ... 23 4. RESEARCH METHODS ... 27 4.1 Data collection... 27 4.2 Cleaning steps ... 28 Retweets ... 28 Bot accounts ... 29 Relevant accounts ... 30 Unrelated tweets ... 30 4.3 Preprocessing ... 31 4.4 Data modeling ... 32
4.5 Analysis of the time series ... 33
4.6 Additional tests ... 35
5. FINDINGS AND DISCUSSION ... 36
Coherence Measures ... 36
Topics ... 37
Themes ... 39
Daily topic weights... 42
Average of daily topic weights... 44
Average of daily theme weights ... 48
Average theme weight forecasting ... 51
6. CONCLUSION AND FUTURE WORK ... 62 REFERENCES ... 64 APPENDIX ... 67
LIST OF FIGURES
Figure 1: Example of bag-of-words model application in documents D ... 11
Figure 2: Distributions of the words w across topics t in document D ... 12
Figure 3: Distributions of the topics t across different documents ... 13
Figure 4: Plate notation of LDA model ... 13
Figure 5: Time series data for bitcoin price (USD) for 2017 and 2018 ... 19
Figure 6: Charts exhibiting examples of time series data features: (1) trend, (2) seasonality, (3) cycle and (4) outlier... 20
Figure 7: Example of a single post retweeted multiple times ... 28
Figure 8: Same comment posted by different accounts, illustrating actions of bots on Twitter ... 29
Figure 9: Monthly totals of retrieved tweets ... 31
Figure 10: Optimal number of topics according to CV results ... 36
Figure 11: Optimal number of topics according to UMass results ... 36
Figure 12: Topics for Faster transactions... 37
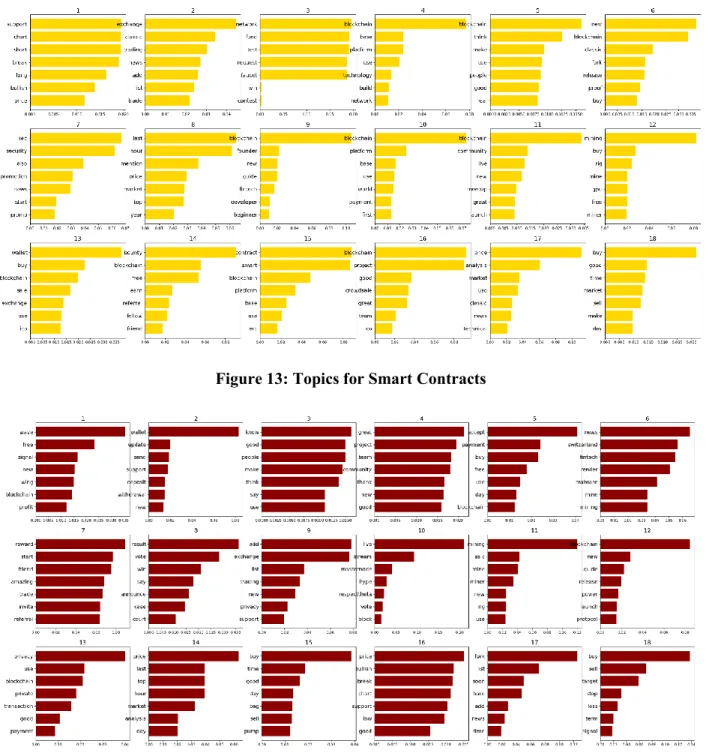
Figure 13: Topics for Smart Contracts... 38
Figure 14: Topics for Privacy ... 38
Figure 15: Scatterplot of daily topic weights by topic from May 2018 to August 2018 for Faster transactions ... 42
Figure 16: Scatterplot of daily topic weights by topic from May 2018 to August 2018 for Smart Contracts ... 43
Figure 17: Scatterplot of daily topic weights by topic from May 2018 to August 2018 for Privacy ... 43
Figure 18: Daily average of weights per topic from May 2018 to August 2018 for Faster transactions ... 45
Figure 19: Daily average of weights per topic from May 2018 to August 2018 for Smart Contracts ... 46
Figure 20: Daily average of weights per topic from May 2018 to August 2018 for Privacy ... 47
Figure 21: Daily average of weights per theme from May 2018 to August 2018 for Faster transactions ... 49
Figure 22: Daily average of weights per theme from May 2018 to August 2018 for Smart Contracts ... 50
Figure 23: Daily average of weights per theme from May 2018 to August 2018 for Privacy ... 51
Figure 24: Predicted theme weight values using ARIMA for Faster transactions ... 52
Figure 26: Predicted theme weight values using ARIMA for Privacy ... 56 Figure 27: Average of theme weights per theme with forecast (ARIMA) shown in the green-colored area for Faster transactions ... 58 Figure 28: Average of theme weights per theme with forecast (ARIMA) shown in the green-colored area for Smart Contracts ... 58 Figure 29: Average of theme weights per theme with forecast (ARIMA) shown in the green-colored area for Privacy ... 59
LIST OF TABLES
Table 1: Groups of cryptocoins separated according to three main features ... 27
Table 2: Breakdown of word quantities for each group ... 32
Table 3: Themes for Faster transactions ... 41
Table 4: Themes for Smart Contracts ... 41
Table 5: Themes for Privacy ... 41
Table 6: MSE comparison between Naive and ARIMA predictions for Faster transactions ... 53
Table 7: MSE comparison between Naive and ARIMA predictions for Smart Contracts ... 55
Table 8: MSE comparison between Naive and ARIMA predictions for Privacy ... 57
Table 9: 8-topic representation of Faster transactions ... 60
Table 10: 8-topic representation of Smart Contracts ... 60
1. INTRODUCTION
The creation and diffusion of virtual currencies, also known as cryptocurrencies or cryptocoins, is currently one of the most discussed subjects in the media. The main one, bitcoin (symbolized by ₿), drew the attention of the whole world due to the exponential rise of its price: in mid-2009 1 unit of bitcoin was valued US$ 0.003, but at the end of 2017 it reached more than US$ 17,000 [1].
Aside from news coverage about the fluctuation of bitcoin price, articles about the misuse of cryptocoins are fairly common. While illicit practices do occur, emphasizing those generates a wrong perception that cryptocoins were created just to fulfill the needs of criminal activities, such as money laundering or tax evasion. General awareness of cryptocurrencies is then divided between those who perceive it as a speculative asset to achieve wealth and those who do not consider having it at all, given the association with unlawful schemes. Both standpoints fail to understand the reasons why virtual currencies were developed.
While price volatility and illegal occurrences are undeniably the main driving force that puts bitcoin and other cryptocoins in the spotlight, it is also necessary to explore other aspects that surround them. For example, the mechanism behind nearly all cryptocurrencies, the blockchain, represents a groundbreaking technology that is changing how financial systems work. It eliminates the need for a middleman on transactions and largely facilitates the lengthy process of fund transfers across the globe, among other innovations.
Following the focus of the media coverage, academic research on cryptocurrencies also has heavy emphasis on price. Most of the studies with a statistical approach are focused on price prediction, especially of bitcoin. However, this thesis takes an unconventional approach to the subject: it does not utilize price as a basis for statistical analysis, nor focuses on bitcoin. Instead, the research is designed based on the characteristics that drove the creation of other cryptocoins and studies them through text analysis on social media.
In this thesis, selected cryptocoins were divided into groups that represent features shared among all of them. These features are improvements in areas in which bitcoin underperforms. From that, related comments made on social media were collected during a certain period of time. Twitter was the chosen platform for this work, not only because of the accessibility of its data but
also due to its larger user base, allowing collection of opinions from a broader audience and not exclusively from enthusiasts of cryptocurrency.
This large quantity of text data was broken down into small collections of words that represents specific topics. This task was performed by the usage of a topic modeling technique called Latent Dirichlet Allocation (LDA). Thus, the main objectives of this study are: (1) understanding if the defined groups are either well fitted according to the topics or if there are characteristics that may suggest a new group category, (2) observing which are the underlying themes discussed in each one of the groups and how they interact themselves and (3) performing a prediction task of which are the themes most likely to appear in the future.
This thesis is organized in the following way. Chapter 2 offers a general view on bitcoin, briefly describes the “altcoins” concept and each one of the selected cryptocurrency groups, presents Twitter social media and explains topic modeling, LDA, coherence measures and time series data. Chapter 3 reviews important academic literature pertinent to this work. Chapter 4 concerns the research methods. Data collection and preprocessing steps are detailed, along with data modeling and handling of time series data. Chapter 5 discusses and analyzes the findings. Finally, Chapter 6 provides a conclusion of this thesis and suggests potential future work.
2. BACKGROUND
2.1 General view on bitcoin
Bitcoin is an open-source peer-to-peer (P2P) virtual currency and the first decentralized payment system, at the same time [2]. Until the invention of bitcoin, in 2008, online transactions had always required a third trusted intermediary. For example, if the individual A wanted to send 500 monetary units (m.u.) to individual B, it would depend on third services such as PayPal, Visa and MasterCard. Intermediaries like PayPal keep a record of the customers account balances. When individual A sends 500 m.u. to B, PayPal debits the amount from A’s account and credits the same quantity to B’s account. These intermediaries were necessary since, without them, a digital currency could be spent twice.
It becomes clearer if one imagines a hypothetical situation in which there is no balance registries, no intermediaries and the digital currency is nothing more than a digital file, which can be sent freely from a computer to another one, just like a PDF file: individual A could send 500 m.u. simply attaching the money file in a message. However, just like it occurs in an e-mail, attaching a file does not remove this file from the original computer. Therefore, individual A would keep a copy of the file and could easily send it again to individuals C, D, E and so on. This problem is known as “double-spending” and, until the advent of bitcoin, having a third trusted intermediary recording the transactions was the unique way to prevent a digital currency to be spent twice [3].
With bitcoin, for the first time ever, the double-spending problem was solved with no need of a third; the bitcoin system solved this problem by distributing the transaction historical registry to every single system users through a P2P web. All transactions that are made in bitcoin are registered in a sort of public ledger named blockchain, which is a large public database and contains the history of all transactions carried out. New transactions are always verified in the blockchain to ensure that the same bitcoins have not been previously expended, preventing the double-spending. The verification process are conducted by the miners, which are the individuals who ensures the authenticity of information by providing computational power, often treated as hash power, in order to solve mathematical problems required to update the blockchain. The miners receive back a reward: a little amount of bitcoin. Therefore, this process has been called mining because of the comparison with the mining process of precious metals.
With the blockchain technology, the global P2P web, consisting of millions of users, becomes itself the intermediary. Of note, it is important to emphasize that transactions in the bitcoin web are not denominated in dollar or euro. Instead, they are denominated in bitcoins. Therefore, the bitcoin system is, in addition to a decentralized payment system, a virtual currency. Its price does not derive from the gold or from some governmental decree. It derives from the value that people who buy and sell bitcoin attribute to it.
2.2 Altcoins
The name “altcoin” is an abbreviation of the extended name “alternative coin”, and the term altcoin may refer to any cryptocurrency other than bitcoin. All altcoins were modeled on bitcoin and, thus, they are technologically quite similar: most of them are generated through "mining", have a limited and known amount of supply, and a blockchain to record transactions.
The first one, Namecoin, came out in 2011, 2 years after the creation of the first block on the bitcoin blockchain. Until 2013, there were only 7 altcoins in the market. Nevertheless, the rise of bitcoin price, in that year, made the creation of other cryptocurrencies spread throughout the world. In March 2018, there were around 1,700 active cryptocurrencies [4]. While some of them were created just in an attempt to reproduce the success of bitcoin, others actually seek to improve some of the bitcoin deficiencies.
It is possible to state that many altcoins have a strong resemblance with bitcoin, meaning that they have almost the same encryption protocol that bitcoin uses, just with small differences. On the other hand, lots of altcoins bring along a variety of new interesting features in their protocol, of which, for purposes of this thesis, are considered three: 1) Smart Contracts; 2) high privacy level and/or anonymity; 3) faster transactions.
Smart Contracts
Smart Contracts, just like the traditional ones, are used to form an agreement between two or more parties, containing all rights, obligations and specifications. However, whereas a typical contract describes the conditions of an accord, an intelligent contract is conceived through cryptographic code. This means that issues inherent in a contract, in the broad sense of the term, in the case of smart contracts are defined and validated partially or entirely automatically.
This technology was conceived initially in 1997, by the computer scientist and cryptographer Nick Szabo [5], but it became possible only with the creation of the blockchain. He realized that ledgers could be used for Smart Contracts.
In this arrangement, contracts can be transferred into computing language, stored and reproduced in the framework and supervised by the computational system that runs the blockchain. Cryptocurrencies which prioritize the smart contract feature attempt to replace restrictive language of bitcoin by a language that enables developers to compose their own projects. In other words, these cryptocurrencies allow developers to design their own intelligent contracts. The language is 'Turing-complete' [6], implying it is able to riddle complex mathematical questions using computational tools.
A contract of a simple financial nature, for example, could define that a given total value of 10 thousand dollars must be reserved and paid to someone in 5 monthly installments of 2 thousand dollars each. In the traditional system, one could think of a paper containing the signature of the two or more parties involved, in order to signal that they are all in accordance with what was written above. Notably, the text should contain the rules and conditions that guide how, when, by whom and to whom the money should be periodically sent.
In a Smart Contract, everything would be done entirely digitally instead, from the stages of sending and receiving the initial amount until the signature of the parties deciding that the payments were made under the terms defined. With a pair of cryptographic keys, it is possible not only to sign digital money transactions that are addressed to the target portfolio in one of the next blocks generated by the network but also to define less obvious and more complex rules for the movement of certain funds. Similarly to what any crypto-wallet application does, with the use of a private key, it becomes possible to interact with snippets of code stored in a blockchain. Blockchain allows the establishment of consensus not only in decentralized financial protocols, such as bitcoin, but its use in a number of other non-financial use cases also becomes feasible. Therefore, just like bitcoin is a kind of "money without banks”, Smart Contracts can be described as agreements without the need for a judge, arbitration chamber or any other intermediary since the rules can be preprogrammed to self-execute [7].
High privacy level / Anonymity
Bitcoin is commonly perceived as a digital asset with high level of anonymity. However, this is inaccurate considering it is one of the most traceable coins since all transactions are registered in the blockchain and the historical record is public. Thus, for example, if individual A transfers a number of bitcoins to B, this transaction is for sure going to leave traces. It is true the blockchain registers neither the name of who made the transaction nor the name of whom it was sent for. Instead, the numbers of the public keys of the sender and the addressee are registered along with a variety of information of the parties, like IP and etc. Therefore, full anonymity is not guaranteed in any bitcoin transaction.
Trying to fill this gap that the bitcoin protocol leaves, many altcoins were designed to promote more privacy or even complete anonymity to users. These currencies are also suitable as value reserves since they are safe and hold values that can be traded without major commitments. The strategies for providing privacy vary from coin to coin, and, here, just some of them will be briefly described.
Monero, the major cryptocoin which emphasizes privacy, attempts to ensure confidentiality to the transactions by using ring signatures: pieces of signature of different people
are collected1 and a new signature is created so that it becomes impossible to know who is the
sender because any of the people whose signatures were collected would be a possible candidate. To hide the receiver, Monero uses a stealth address, which creates a new send address not publicly associated with the actual address of the receiver [8].
Zcash, another cryptocurrency which promotes privacy, uses the technology of zero-knowledge proof: a verifier can prove that a statement is valid without knowing the information. When a user transmits his transaction to the miners, they are able to verify whether the transaction is valid or not based on a string of information that could only be generated if that user had the corresponding private key. This way, the Zcash system hides who sends, who receives and the amount sent [9].
1 If the ring size value is 5, there are 5 people - the larger this number, the more anonymous, but the more expensive the transaction rate.
Verge Currency is another cryptocoin and allows users to choose between public or private transactions. For that, it uses the technologies Wraith protocol and TOR: the former allows to transact anonymously, with the help of some “invisible addresses” that do not let the transactions be associated with the real public addresses. The latter hides the IP of the sender, so it is not stamped on Verge blockchain. Nonetheless, public transactions are still available if the user shuts down the Wraith protocol [10].
Faster transactions
The speed of transaction of a cryptocurrency depends on the balance between the demand for transactions and computational power (known as “hash power”) available for resolving the mathematical problems, the size of the block and the limit of transactions per second that the specific blockchain allows.
In the bitcoin case, when there is sufficient offer of hash power, the transactions linger about 10 minutes. It means that a new bitcoin block is created every 10 minutes. As the bitcoin
protocol requires 6 confirmations of a transaction2 to be considered an irreversible transaction, 1
hour is necessary to make a transaction for good within the bitcoin blockchain. However, more than once, the enthusiasm with this cryptocurrency has led many people to suddenly buy it, which enormously increased the demand for transactions with no correspondent increase of the hash power. As a result, the transactions were delayed more than 1 hour and the transaction fees were rising constantly. Bitcoin developers doubled the block size from 1MB to 2MB by implementing new rules to the protocol (Segregated Witness or just SegWit) in an attempt to solve this problem [11].
Even so, one-hour transactions are still a breakthrough in the international transaction area, since the current bank system works only in commercial hours and, sometimes, delays a week to confirm the transaction.
However, some cryptocurrency developers saw in this bitcoin weakness a window of opportunity to make money and, therefore, developed blockchains with faster transactions and
lower fees. Among many cryptocurrencies, this study is going to cite three examples: 1) Ripple, 2) Stellar, and 3) Litecoin.
Ripple was thought to work with banks and not to compete with them. Its goal is to modernize the current bank system with fast (a few seconds to confirm a transaction), cheap and secure transactions. Many banks have already adopted Ripple to transact, which made the value of this cryptocurrency rise significantly [12].
Stellar is intended to work as an intermediary exchange between two different coins, and not necessarily cryptocoins. In other words, within the Stellar system, one can deposit bitcoin and another can receive in US dollar, or euro, British pounds, etc., or vice versa [13]. The developers bet that the fast transactions (which are confirmed in a few seconds) and the low-cost transaction fee (0.00001 Stellar, equivalent to 0.0000019 USD in March 2018 [4]) will lead people to prefer to use this system rather than the current bank system.
Litecoin is developed by the same group of developers of bitcoin. It has a bitcoin-based blockchain, with some changes. It takes only two and a half minutes to make a new block [14]. This means that the transactions in the Litecoin system are confirmed way faster than in the bitcoin system, which is considered to be a great advantage of this cryptocoin over bitcoin.
2.3 Twitter
Twitter is a social network that enables users to interact among themselves by posting messages (known as “tweets”) with 280 characters maximum, also allowing uploads of photos and videos. According to the latest data (first quarter of 2018), it has reached an average of 335 million monthly active users [15], making it one of the most important platforms of human interaction of the 21st century so far.
The spectrum of Twitter users can be considered very democratic: it goes from regular people to popular celebrities and even heads of state. The platform became a powerful channel for companies to communicate with their clients, for media outlets to publish news headlines in the form of text or video and even for government agencies to make announcements.
This social network does not offer a tool to build groups or communities of any kind. Instead, its dynamics are based on the following: each user can follow any other account and can
be followed by other users as well. All the tweets posted by a user are shown at the feed of their followers. That way, each person can be considered the curator of the content seen on their feed, by following everything that suits their interests.
The most important feature of Twitter is “retweeting”, which is the literal replication of a tweet referencing the user who wrote it. A tweet from a user can be retweeted by its own or any other account. It is an efficient method of spreading a message outside of the range of followers. Tweets that are retweeted a large number of times are either from well-known people (i.e. celebrities or world leaders) or from common users who were able to create messages that “went viral”3.
Twitter is responsible for popularizing the hashtag mechanism within the social networks.
A hashtag is created when the symbol # is associated with a word or a phrase. It is then used as
keywords that create hyperlinks that direct the user to a new page, where all the posts that mentioned that hashtag are listed. Some names of the selected cryptocoins for this work are also common words, such as Verge, Stellar or Ark. In that sense, using the hashtags to look for comments about them on Twitter minimizes the risk of getting text data that are just using that word in a context not related to cryptocurrency.
The platform also does a ranking of all hashtags and meaningful expressions. This rank is called Trending Topics (TT) and shows up to 20 most popular terms that have been posted in a certain period. Any user can see the current TT, tailored by country or worldwide. Of note, there is no point in tweeting the same term many times with the sole intention of entering it on the TT, as this depends on the spread between different users and other variables calculated by Twitter algorithms. Twitter recently allowed advertisements on TT, in which a company, organization or government can promote a term to appear on top of it. For those cases, the promoted term is explicitly displayed as advertising, to avoid being confused with the high ranked terms.
Together hashtags and retweets play an important role in the dissemination of content and ideas across the network. The more relevant the theme is for the community that makes use of social networks, the more posts and sharing will occur, leading to greater visibility. With the
3 Expression defining any content that is quickly spread on social networks due to being shared a large number of times by its users.
democratization of information, communication and immersion of knowledge, social networks became a space for interactivity, coexistence and debate. Nonetheless, if in one hand the online environment might become a representation of collective intelligence, on the other hand, it is easily manipulated by fake accounts and bots, which may lead a spread of false information that has the potential of influencing the population to believe in something without any basis in reality. In the context of this thesis, it is crucial to make a thorough screening of the collected data in order to identify whether the author is a real person or not.
2.4 Topic Modeling
Managing an extensive amount of text data in order to extract meaning from it is a challenging task. When the collection of documents reaches thousands (if not millions) of entries, it is not possible to manually try to highlight important information and an automated procedure is required to do the work. One motivating example is corruption investigation: it generally involves a large number of items to be examined, going from e-mails from politicians to executives of large companies, to bills and contracts from a multitude of enterprises. Another example could be a journalist exploring all the New York Times articles published during the 1990s to discover what was most discussed in that time. For both cases, the underlying information in all documents can be figured out with the implementation of natural language processing (NLP) and machine learning (ML) techniques.
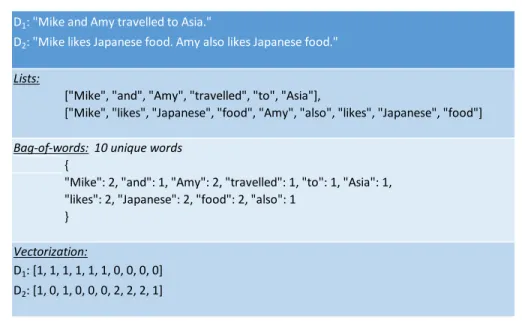
One of the resources in NLP and ML is the bag-of-words model. It has a simple concept, understandable from its own name: every word in a document is put in a list but the order of the words is ignored, so that the collection of these lists is treated as an abstract “bag” containing all the words with its respective frequency considering all documents. Then, each document is transformed into an array of numbers that represent the overall frequencies, in a process called vectorization [16]. Figure 1 below illustrates the entire procedure with a small example.
Figure 1: Example of bag-of-words model application in documents D
Another resource in NLP and ML is topic modeling, which was the one chosen for this thesis. A topic model is a kind of statistical model for the discovery and clustering of the abstract topics in a document collection and thus offering a way to get a corpus-level view of major themes without having to be supervised. In topic models, the input data is an assortment of documents
where each one is a collection of words alongside with an input integer k that represents the number
of topics to be found. The model outputs:
on a topic-level: all the words associated with each topic, and their proportions in the
topic;
on a document-level: every topic that is expressed by that document, and their
proportions.
There are several different topic models, such as Explicit Semantic Analysis, Hierarchical Dirichlet Process or Non-negative Matrix Factorization. This thesis focuses on just one: Latent Dirichlet Allocation (LDA).
Latent Dirichlet Allocation (LDA)
Blei et al [17] define LDA as a generative probabilistic model for text data, in which a document represents random mixtures over a set of topics, each one corresponding to a multinomial distribution over words. The obtained posterior distribution should answer the questions: (1) how likely each word is to appear in each topic; (2) with which probability each
D1: "Mike and Amy travelled to Asia."
D2: "Mike likes Japanese food. Amy also likes Japanese food." Lists:
["Mike", "and", "Amy", "travelled", "to", "Asia"],
["Mike", "likes", "Japanese", "food", "Amy", "also", "likes", "Japanese", "food"]
Bag-of-words: 10 unique words
{
"Mike": 2, "and": 1, "Amy": 2, "travelled": 1, "to": 1, "Asia": 1, "likes": 2, "Japanese": 2, "food": 2, "also": 1
}
Vectorization:
D1: [1, 1, 1, 1, 1, 1, 0, 0, 0, 0]
topic appears in each of the texts of the dataset. The result of fitting an LDA model into a text set is an estimate of the values of these parameters.
For a better understanding, the generative process for LDA will be described in a reverse way, starting with documents and working towards finding the topics in it. The model assumes
that new documents are created in phases: i)deciding the amount of words in the document; ii)
picking a topic blend for the document over an arrangement of topics. For instance, 30% topic t1,
20% topic t2 and 50% topic t3; iii) creating the words in the document. For each word, firstly
choosing a topic based on the aforementioned multinomial distribution of the document (namely, 30%, 20% and 50%). Then, by picking a word according to the topics multinomial distribution of words. Finally, this process must be repeated until reaching the number of words determined in the first phase.
In conclusion, LDA works with probability distributions instead of word frequencies strictly. Unlike the bag-of-words model that focuses on the most frequent words in a document, LDA offers a more global approach by concentrating on the word distribution throughout the topics.
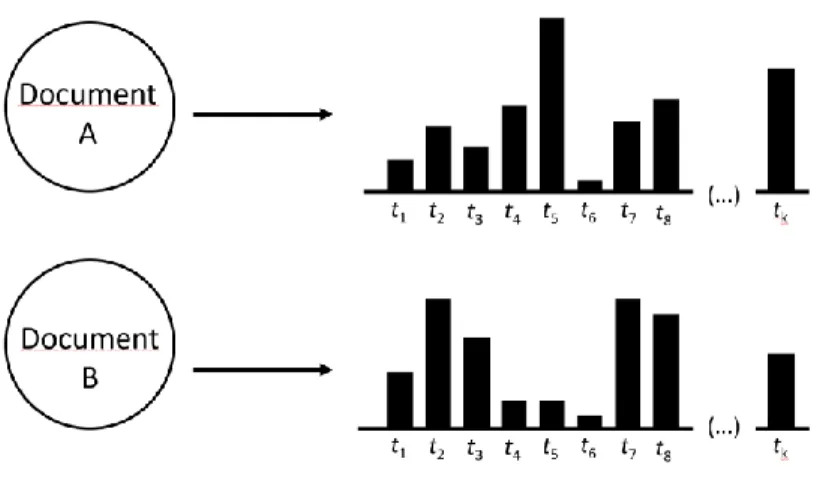
Figure 3: Distributions of the topics t across different documents
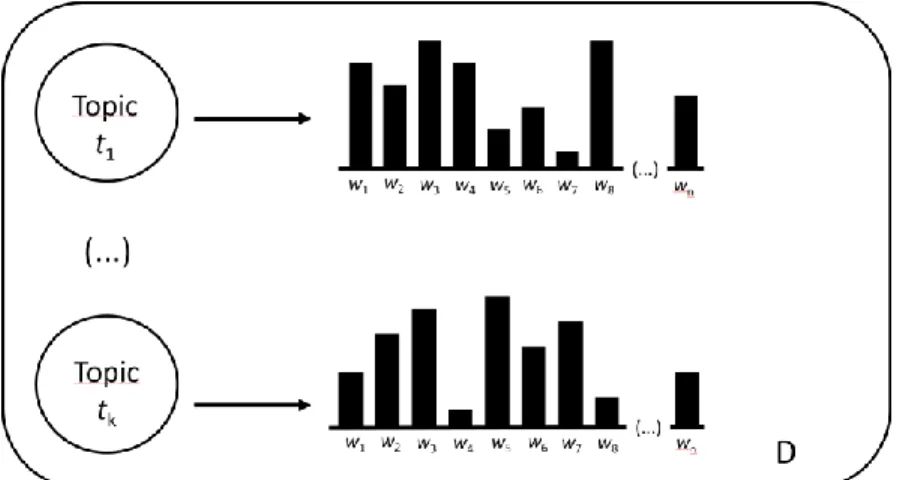
The figures above give an overview of LDA outputs. In Figure 2, every topic t in document
D contains a number n of possible words w, each topic showing different distributions over the
words, represented by the vertical bars. Words with higher probabilities are most representative
for the topic and vice-versa. Similarly, Figure 3 shows that both documents have a number k of
topics, each document with different distributions over the topics (vertical bars). Topics with higher probabilities are most representative for the document and vice-versa.
The framework for an LDA model is represented in the following figure:
Figure 4: Plate notation of LDA model
The plate notation illustrated in Figure 4 is a compact form to represent in a visual manner
the affiliation and the subjection among the model parameters. The outer rectangle M represents
the aggregate number of documents inside the corpus while the inner rectangle N denotes the
α is the parameter of the uniform Dirichlet prior on the document topic distributions: on one hand, a high α suggests that each document is probably going to contain a blend of the greater part of the topics and not only a couple specifically. On the other hand, a low α is indicative that each document will probably contain only a couple of topics;
β is the parameter of the uniform Dirichlet prior on the topic word distribution: high β
shows that every topic is going to hold a blend of most words, whereas low β indicates that every topic may comprise a blend of only a couple of words.
θ is the topic distribution for each document;
t the topic that is used to generate each word w, and, hence, every single document is a
blend of these topics.
A study from Darling [18] addressed the problem of learning the posterior distribution of the variables in the equation:
𝑝(𝜃, 𝒕|𝒘, 𝛼, 𝛽) =𝑝(𝜃, 𝒕, 𝒘|𝛼, 𝛽)
𝑝(𝒘|𝛼, 𝛽) (1)
Given that this equation is incredibly hard to work with (Darling states that 𝑝(𝒘|𝛼, 𝛽)
cannot even be computed), an alternative method can be applied such as the Gibbs Sampling
algorithm4. Similarly with the aforementioned description for the generative process, it runs LDA
backward from the document level to recognize the topics that created the corpus, in order to find the probability of the latter. The process is explained as follows:
1. Randomly assign a word, one by one, in every document to one of the k topics;
2. For every single document D:
o Consider that all topic assignments aside from the present one are right.
o Calculate 2 probabilities:
i. Based on words in the document (topic distribution θ) that are currently
assigned to topic t:𝑝(𝑡|𝜃), for each topic t.
4 Gibbs Sampling is an algorithm part of the Markov Chain Monte Carlo (MCMC) method that generates a sample from the distribution and stimulates it to converge to the posterior distribution of interest. It is commonly applied when the direct approach to the distribution is not feasible [19].
ii. Based on all assignments of words to topics over all documents, compute the
probability that a particular word w will be chosen from topic t: 𝑝(𝑤|𝑡), for
each possible word w and for each topic t.
o Multiply those 2 probabilities and assign w a new topic based on the result:
𝑝(𝑡|𝜃)𝑝(𝑤|𝑡)
3. Repeat step 2 a considerable amount of times. In the end, it will possibly achieve a stage
in which the assignments are satisfactory.
Therefore, considering the parameters α and β, as well as the meanings of rectangles M
and N in plate notation, the joint distribution of θ, t and w is given by:
𝑝(𝜃, 𝒕, 𝒘|𝛼, 𝛽) = 𝑝(𝜃|𝛼) ∏ 𝑝(𝑡𝑛|𝜃)𝑝(𝑤𝑛|𝑡𝑛, 𝛽) 𝑁
𝑛=1
(2)
where 𝑝(𝜃|𝛼) occurs because LDA considers that the document is issued by incorporating the
distribution of topics. The following steps recall the work of Blei et al, in which the marginal
distribution of a document is obtained by integrating over θ and summing over t:
𝑝(𝒘|𝛼, 𝛽) = ∫ 𝑝(𝜃|𝛼) (∏ ∑ 𝑝(𝑡𝑛|𝜃)𝑝(𝑤𝑛|𝑡𝑛, 𝛽)
𝑡𝑛 𝑁
𝑛=1
) 𝑑𝜃 (3)
Finally, the probability of a corpus D is achieved by applying the product of the marginal probabilities of the documents:
𝑝(𝐷|𝛼, 𝛽) = ∏ ∫ 𝑝(𝜃𝑑|𝛼) (∏ ∑ 𝑝(𝑡𝑑𝑛|𝜃𝑑)𝑝(𝑤𝑑𝑛|𝑡𝑑𝑛, 𝛽) 𝑡𝑑𝑛 𝑁𝑑 𝑛=1 ) 𝑑𝜃𝑑 𝑀 𝑑=1 (4) Coherence Measures
Choosing the ideal number of topics k is essential to produce good results, as a low k
generates few and quite general topics, in the same way a high k may result in repetitive topics that
should have been combined. One way to perform this task is simply testing the results given by
the model over multiple choices of k and choosing the one that is best suited for the purposes of
the chosen model would not be chosen based on non-subjective arguments. The alternative is a more scientific method, which allows evaluation of the topics, both qualitatively and quantitatively: through coherence measures.
Coherence measures have been designed in order to qualitatively gauge the coherence of a topic, which is essentially based on the distributional hypothesis of linguistics. Fundamentally, it is presumed that words with similar meaning usually appear in similar circumstances. Thus, coherent topics are the ones in which the majority of words - or even all of them - are somehow associated. In this context, the goal is to design attain measures that have a high correlation with human topic ranking data [20].
There are multiple topic coherence metrics, each one with different approaches, such as
Perplexity, UMass or UCI. This thesis will implement two of them, UMass and CV, which will be
detailed as follows.
UMass was first introduced by Mimno et al [21] as an intrinsic method for measuring coherence, meaning that it does not utilize any external source other than the original corpus to
evaluate the topic models. It is based on the similarity scores of words 𝑤1, … , 𝑤𝑛 grouped in pairs,
expressed by
𝑐𝑜ℎ𝑒𝑟𝑒𝑛𝑐𝑒(𝑊) = ∑ 𝑠𝑐𝑜𝑟𝑒(𝑤𝑖, 𝑤𝑗)
(𝑤𝑖,𝑤𝑗)∈𝑊
(5)
where 𝑊 is a list of top-k words for some k in a topic. This generalization also applies to UCI,
which is, opposed to UMass, an extrinsic method [20].
Letting 𝐷(𝑤𝑖) denote the number of documents 𝐷 containing the word 𝑤𝑖 and letting
𝐷(𝑤𝑖, 𝑤𝑗) denote the count of documents 𝐷 having the pairwise 𝑤𝑖, 𝑤𝑗, the score function for UMass is defined as:
𝑠𝑐𝑜𝑟𝑒(𝑤𝑖, 𝑤𝑗) = log𝐷(𝑤𝑖, 𝑤𝑗) + 1
𝐷(𝑤𝑖) (6)
In contrast, the study of Röder et al [22] employs a systematic approach that explores existing methods utilized by other coherence measures and summarizes them in just one metric,
called CV. Its framework, summarized in the study from Syed and Spruit [23], is based on four
steps:
i. Segmentation: pairs of subsets S are created from the top n words 𝑤 in a topic, represented
by 𝑊, having every single word paired with another one. Thus, for 𝑊 = {𝑊1, … , 𝑊𝑛}
and Si as a subset of word 𝑊′∈ 𝑊 paired with word 𝑊∗∈ 𝑊, all subsets S can be defined
as 𝑆 = {(𝑊′, 𝑊∗)|𝑊′= {𝑤
𝑖}; 𝑤𝑖 ∈ 𝑊; 𝑊∗ = 𝑊}.
ii. Probability Estimation: both single words probabilities and joint probabilities of word
pairs are estimated using Boolean document calculation, namely the number of single words or word pairs over the total number of documents. Since it does not consider the distances between words in the documents, a sliding window is integrated into the process and moves over the documents one word token per step. The new virtual documents that are created at every movement of the sliding window are used to calculate the word probabilities.
iii. Confirmation Measure (𝜙): it is calculated for all single pairs 𝑆𝑖 = (𝑊′, 𝑊∗) to determine
how 𝑊∗supports 𝑊′ based on how similar 𝑊∗ and 𝑊′ are to all words in 𝑊. A way to
illustrate the semantic support of the words in 𝑊 is to represent 𝑊′and 𝑊∗ as vectors
𝑢⃗ = 𝑣 (𝑊′) and 𝑤⃗⃗ = 𝑣 (𝑊∗). But first it is necessary to calculate the association between
single words 𝑤𝑖 and 𝑤𝑗 using normalized pointwise mutual information (NPMI), given
by 𝑁𝑃𝑀𝐼(𝑤𝑖, 𝑤𝑗)𝛾= ( log 𝑃(𝑤𝑖, 𝑤𝑗) + 𝜖 𝑃(𝑤𝑖) . 𝑃(𝑤𝑗) − log(𝑃(𝑤𝑖, 𝑤𝑗) + 𝜖) ) 𝛾 (7)
where 𝛾 is used to add more weight to high NPMI scores and 𝜖 is added to inhibit
logarithm of zero. Then, the context vectors can be created by joining them to every word
in 𝑊 using the sum of NPMI values as follows:
𝑣 (𝑊′) = { ∑ 𝑁𝑃𝑀𝐼(𝑤𝑖, 𝑤𝑗) 𝛾 𝑤𝑖∈𝑊′ } 𝑗=1,…,|𝑊| (8)
Next, the last step to get the confirmation measure 𝜙 of a pair 𝑆𝑖 is by calculating the cosine vector similarity 𝜙𝑆𝑖(𝑢⃗ , 𝑤⃗⃗ ) of the vectors inside 𝑆𝑖:
𝜙𝑆𝑖(𝑢⃗ , 𝑤⃗⃗ ) = ∑ 𝑢𝑖 . 𝑤𝑖
|𝑊| 𝑖=1
‖𝑢⃗ ‖2 . ‖𝑤⃗⃗ ‖2 (9)
iv. Aggregation: all individual confirmation measures 𝜙 are aggregated by the arithmetic
mean into one final coherence score.
While for UMass an indicator of a good k number of topics is a low coherence score value,
the opposite holds for Cv. Nevertheless, the optimal k is not necessarily pointed by the lowest or
highest score but instead, it is usually the one marked after a steep growth of topic coherence before it reaches a plateau. Choosing the coefficient after that may result in the aforementioned
problem of picking a high k.
2.5 Time Series Data
A time series data is an ordered sequence of observations 𝑋𝑡, usually with equal intervals
of time 𝑡 but that is not strictly necessary. Such data can be seen in a vast range of areas, practically
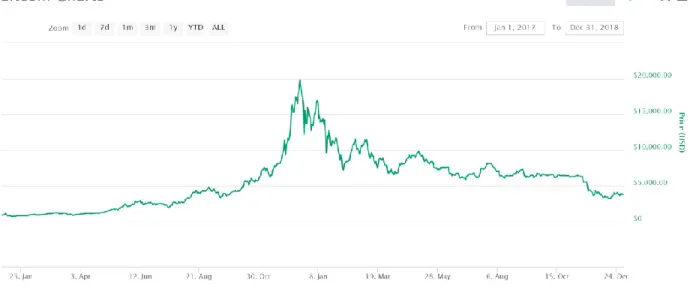
everything that can be covered with statistical knowledge, such as business, medicine, social and natural sciences, among many others. Figure 5 depicts an example, exhibiting bitcoin price variation (in USD) from Jan/2017 to Dec/2018 [1].
Figure 5: Time series data for bitcoin price (USD) for 2017 and 2018
Basic objectives of analyzing a time series include: describing features and patterns present in the data, understanding how past behaviors may affect next observations, establishing control standards for future values by the adjustment of certain parameters and forecasting future data [24], which is the focus of this thesis. A time series can be either univariate or multivariate, depending on the number of variables it contains. In the context of the research, the output from the LDA model first generates a multivariate time series that is later transformed to univariate. Forecasting will advance using the latter.
Below are listed a few important features that can be present in time series data:
Trend: an overall or continuous increase or decrease of variable values across time;
Seasonality: a pattern that is systematically repeated along regular intervals, denoting a
specific behavior at specific times;
Cycle: any periodic variation, not necessarily tied with a specific season;
Figure 6: Charts exhibiting examples of time series data features: (1) trend, (2) seasonality, (3) cycle and (4) outlier
One fundamental concept of time series phenomena is stationarity, which denotes any time series that has neither trends nor seasonality or periodicity. In mathematical terms, means that the
properties of the time series {𝑋𝑡, 𝑡 = 0, ±1, … } are similar to other {𝑋𝑡+ℎ, 𝑡 = 0, ±1, … } for any
input lag ℎ. The exploratory analysis of a time series data involves testing stationarity of the underlying phenomenon and, in the absence of it, apply techniques to remove trends and seasonal components to make it stationary, so it can be used in the forecasting models.
There are plenty of different prediction models for a time series, such as Vector Autoregression or Simple Exponential Smoothing. The simplest one is the Naive method, which basically consists in assuming that the predicted value is the same as the last observation.
Considering ℎ = 1, commonly known as 1-step-ahead, it is denoted by:
𝑌̂𝑡+1 = 𝑌𝑡 (10)
A more robust method, the one chosen for this thesis, is the Autoregressive Integrated Moving Average (ARIMA), which is a generalization of the Autoregressive Moving Average (ARMA) method that incorporates non-stationary series [24]. ARMA(p,q) models consist of two parts, an autoregressive part (AR) and a moving average part (MA). The AR(p) part corresponds to modeling future observations from the prior time steps, satisfying the equation
𝑋𝑡= ∑ 𝜙𝑖𝑋𝑡−𝑖+ 𝑝
𝑖=1
𝑍𝑡 (11)
where 𝑋𝑡 is a stationary time series, 𝜙1, … , 𝜙𝑝 are fixed coefficients, 𝑍𝑡 is independent of 𝑋𝑡 and is also a White Noise sequence, meaning that it has normal distribution with zero mean and
constant variance 𝜎2. It can be simply denoted as 𝑋
𝑡 ~ 𝑁(0, 𝜎2).
The MA(q) part treats the error term as a linear combination of error terms happening at the same time and at several past times [25], satisfying the equation for a stationary series
𝑋𝑡= ∑ 𝜃𝑘𝑍𝑡−𝑘
𝑞
𝑘=0
𝑍𝑡 ~ 𝑁(0, 𝜎2) (12)
where 𝜃0 = 1 is usually assumed.
Therefore, an ARMA(p,q) model can be written as
𝑋𝑡 = (∑ 𝜙𝑖𝑋𝑡−𝑖+ 𝑝 𝑖=1 𝑍𝑡) + (∑ 𝜃𝑘𝑍𝑡−𝑘 𝑞 𝑘=0 ) 𝑍𝑡 ~ 𝑁(0, 𝜎2) (13) or more concisely as 𝜙(𝐵)𝑋𝑡 = 𝜃(𝐵)𝑍𝑡 (14) where 𝜙(𝓏) = 1 − 𝜙1𝓏− . . . − 𝜙𝑝𝓏𝑝, 𝜃(𝓏) = 1 + 𝜃
1𝓏 + . . . + 𝜃𝑞𝓏𝑞 and 𝐵 is the backshift operator (𝐵𝑗𝑋𝑡 = 𝑋𝑡−𝑗, 𝐵𝑗𝑍𝑡 = 𝑍𝑡−𝑗, 𝑗 = 0, ±1, …).
ARIMA models, in turn, are utilized in situations in which there is evidence that the data are nonstationary. The AR component of the ARIMA model designates that the evolutionary variable of interest is returned in its proper lagged values, just as in the ARMA model. The MA component also follows the description used for ARMA. The integrated part (I), employed to remove nonstationarity, designates that the data values have been supplanted by the variation among their previous and actual values, a procedure that might have been rendered multiple times [26]. An ARIMA(p,d,q) model satisfies the equation
𝜙(𝐵)(1 − 𝐵)𝑑𝑋
𝑡 = 𝜃(𝐵)𝑍𝑡 𝑍𝑡 ~ 𝑁(0, 𝜎2) (15)
where, if the difference iteration part 𝑑 equals zero, the process becomes ARMA(p,q) again.
Evaluation of forecast results can be done through mean squared error (MSE), regardless of the method applied. MSE is calculated through the average of squared forecast errors, each of which is simply the squared difference between the actual value, extracted from the test data, and the predicted value obtained from the training data.
3. LITERATURE REVIEW
This chapter presents related studies that make use of topic modeling or other NLP and ML techniques to develop research on cryptocurrencies. Papers about this subject have been published in an increasing amount as the monetary value of these crypto assets increases and draws more attention of the public. Many statistical works focus on bitcoin price prediction as it was the first to be launched, the one which has the most active web community and the greatest market capitalization. For instance, the research from Blau [27] tried to establish a connection between bitcoin’s price volatility and speculative trading. Meanwhile, Jang et al [28] utilized information on bitcoin’s blockchain to create a statistical model for price prediction utilizing Bayesian neural networks. Other similar examples of bitcoin studies are abundant.
Narrowing the scope to research that used text data, one common NLP application is Sentiment Analysis, which aims to identify the feeling that users have about some entity of interest (a specific product, company, place, targeted group of people etc.) based on the content available on the Web or digitalized from a physical source. The approach is capable of recognizing subjectivity and the underlying opinion in texts. The outcome does not show what the content expresses, but rather the predominant emotion in it: positive, negative or neutral [29]. The work developed by Matta et al [30] made use of sentiment analysis to model a correlation among Twitter, Google Trends and the fluctuations in the bitcoin market. Even though data was gathered for just one coin and only spanning 60 days, the total amount of retrieved tweets was roughly 50% of the total collected for this thesis. There is no mention about the handling of retweets and bot posting if there was any at all. It was then observed that peaks expressing positive sentiment towards bitcoin, both in Twitter and Google Trends, have a strong correlation with posterior peaks in the bitcoin price for a few days. Consequently, the platforms may be used as predictors of bitcoin price fluctuations.
Twitter and Sentiment Analysis were also used by Stenqvist and Lönnö [31] for predicting bitcoin price. Similarly to the paper of Matta et al, the work from Stenqvist and Lönnö tries to find a correlation between volatility and social media sentiment but in a different fashion: disregarding macro trends and only analyzing feelings on a short term basis, that is, within intervals ranging from 5 minutes to 4 hours. A simple prediction of price increase or decrease according to sentiment indicated in those frequencies is then shifted forward in 4 different timestamps to indicate how the
coin behaved. A total of 2.27 million tweets were collected just in one month, showing how much bitcoin dominates the cryptocurrency discussions. After a cleaning process to mitigate the effect of bots, around 55% of this total was removed. The authors concluded that, for some sentiment frequency/shift counts, the prediction accuracy is around 50%, indicating that there is neither positive nor negative correlation between sentiments and bitcoin price fluctuations. On the other hand, for other sentiment frequency/shift counts, the accuracy increases, suggesting a positive correlation. Also, the accuracy is higher 1 hour after posting the sentiment and the effect on the price is seen around 4 hours later.
A multidisciplinary approach based on social network data was taken by Laskowski and Kim [32], utilizing NLP techniques in order to better understand variations in price and in other trends regarding the cryptocurrency market. Text data were gathered from Twitter and from Internet Relay Chat (IRC) for a six months period, regarding discussions about bitcoin. IRC organizes the discussions into topics in which the subjects are followed by a hash symbol, similarly to Twitter hashtags. Although the total amount of entries were not disclosed, it was stated that the number of messages retrieved from Twitter surpassed the total collected from IRC by a large margin. Daily bitcoin USD price and volume of transactions were collected for the same period. The processing pipeline was conducted using an open source for NLP called GATE (General Architecture for Text Engineering) along with a pre-packaged application for Twitter analysis. It was found that Twitter post volume is positively correlated with the bitcoin volume transactions, whereas the total IRC post volume in the channel “#bitcoin-pricetalk” is also positively correlated with bitcoin price and transaction volume. Conversely, some negative correlation was found between the daily amount of discussions in the channel “#Bitcoin-assets” and the bitcoin price. The conclusion points that, even with a lower volume of messages, IRC data may be very much valuable for this kind of analysis, as they complement Twitter data. A limitation was noted that also became clear prior to the start of data collection for this thesis: real-time analysis of data coming from different sources is limited by computational power.
Related work that expands the cryptocurrency spectrum outside bitcoin is more limited. One example is the article published by Kim et al [33] that proposes a method to predict fluctuations in the prices and amount of transactions of not only bitcoin but also of Ethereum and Ripple. Litecoin was considered but ultimately discarded because its online community was not considered active enough, despite its great market cap. Data was collected from dedicated message
boards for the three cryptocoins under analysis, corresponding to post texts, the time stamps and the number of replies and views of each post but excluding all repeated sentences in replies referring to the previous post. Techniques to filter spam data were applied, for instance, removing any post of more than two sentences that appeared more than five times a day. Time frames for the data collection were different for every coin, justified by particularities of each one, and retrieval of price data and number of transactions corresponded to each period. Once the entire data had been crawled, a Sentiment Analysis algorithm was used to classify every single comment into a range that varies from very negative to negative and positive until very positive. This classification was further compared to the price and to the number of transaction fluctuations of each crypto for formulating the predictive model. Very positive/positive posts, positive replies and the number of topics proved to be significantly correlated with bitcoin price fluctuations, in such a way that the maximum accuracy (79.57%) was obtained with a 6-day lag. Alternatively, very negative/negative and positive posts showed a significant association with Ethereum price variation, and the accuracy was the highest (71.823%) with a 6-day lag. Ripple price fluctuations, in turn, ended up being significantly associated with very negative posts and negative replies, being the maximum accuracy (71.76%) with a 7-day lag. In conclusion, the prediction accuracy varied around 8% among different cryptocurrencies, so that the predictions regarding bitcoin were the most precise and the ones regarding Ripple were the least precise. This is attributable to the difference in the market capitalizations and number of daily comments and replies. In addition, comments proved to be useful to predict the number of transactions of all coins and they estimated that user opinions might be used to predict fluctuation in six or seven days.
Even scarcer are statistical researches that focus neither on bitcoin nor on price. In the research by Linton et al [34], data regarding bitcoin and altcoins were extracted from popular online message boards, such as bitcointalk.org, and analyzed through topic modeling and text mining in an attempt to identify new trends, economic matters and legal or illegal schemes regarding cryptocurrencies across the time. To do so, they collected thread ids, post ids, usernames, time stamps, post titles, post texts, quotes of other posts and links of each post and stored them in the database. Thread and post ids were used to who is posting and which thread they belong; usernames were necessary to make an association between a post and an agent; time stamps were collected to make time slices; post titles and texts were used as source for LDA; links and quotes
posts, 5x10⁵ threads and 200 subforums were collected from November 22nd, 2009 to August 6th,
2016. The results were compared to what actually occurred to test the power of the analysis. The article identifies interesting words that are associated with the historical events that happened in the year in which the data collection was made. For example, the results highlighted the relevance of words like CPU, difficult and mining in 2009, when the bitcoin mining difficulty augmented rapidly. The authors also identify that words related to fraud, pyramids schemes and other semantically related words appeared in a high volume. They speculate that the reason for the high occurrence frequency of these words may be the lack of governmental regulation concerning bitcoin and other cryptocurrencies. Additionally, they affirm that the biggest event in bitcoin history to that year (2016) is the insolvency of the MtGox bitcoin exchange that happened in 2014. They found that the word probabilities are usually flat probabilities along the time and have peaks during events.
4. RESEARCH METHODS 4.1 Data collection
The cryptocoins analyzed in this thesis were selected to fit into one of the groups (explained in Chapter 2) that focus on deficiencies of bitcoin: faster transactions, smart contracts and privacy levels. Upon investigation on websites specialized on cryptocurrency news and analysis, 57 cryptocoins were first selected.
Even though market cap is not a feature to be explored in this thesis, it was taken into consideration to narrow down the list of the first selected cryptocoins. A very low value of daily volume and global market cap is a strong indication that the coin has low awareness. Therefore, there may not be a reasonable amount of people commenting about it on Twitter.
After considering the eligibility of only those cryptocoins that performed in the top 100 position of global market cap on the website https://coinmarketcap.com/ [4] in March 2018, the final list was narrowed down to 25 coins, as follows:
FASTER TRANSACTIONS SMART CONTRACTS PRIVACY Ripple (XRP) NEM (XEM) Steem (STEEM) Bitcoin Cash (BCH) Litecoin (LTC) Dash (DASH) Bitshares (BTS) IOTA (MIOTA) Stellar (XLM) Ark (ARK) Cardano (ADA) ChainLink (LINK)` EOS (EOS) Ethereum (ETH) Ethereum Classic (ETC) NEO (NEO) Qtum (QTUM) Bytecoin (BCN) Komodo (KMD) MaidSafeCoin (MAID) Monero (XMR) PIVX (PIVX) Verge (XVG) Zcash (ZEC) ZCoin (XZC)
Table 1: Groups of cryptocoins separated according to three main features
By using Twitter API access, a Python script was written to extract tweets that made any mention to the selected cryptocoins. Due to the restrictions that prevent retrieval of messages older than two weeks, the script was executed to get all the tweets within a period of a day. The process was repeated from May 2018 to August 2018 resulting in 4 months of daily data.
4.2 Cleaning steps
Text data retrieved from Twitter cannot be used in their original form. There are multiple repetitions of the same information and a lot of action from automated accounts (called “bots”). The former does not add any significance to this work and the latter is not on the scope of the research since it is seeking comments only from real people on social media. The cleaning steps required during the preprocessing stage consist of:
1) Removal of repeated messages;
2) Mitigation of the effects caused by bot accounts that generate a large amount of
meaningless data;
3) Protection of any relevant information that could be wrongly removed during step (2);
4) Elimination of tweets unrelated to cryptocurrency.
Retweets
One noticeable characteristic of each file with daily data was the high number of retweets, which forms roughly half of the total number of tweets. It is pointless to analyze if it has been published by bots or real people because either way it consists of unnecessary repetition of the same information. Consequently, it should be removed.
Figure 7: Example of a single post retweeted multiple times
It is important to point out that the elimination of all retweets does not mean the removal of the message entirely. Given the nature of the retweeting feature, the original tweet is likely to be retrieved on the same day or on the day before. In addition, since all retweets are marked with “RT”, the process for eliminating them is fairly easy.
Bot accounts
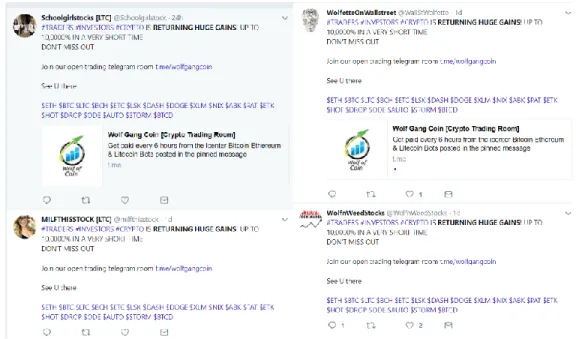
Tweets generated by bot accounts are abundant in every file and appear in a wide variety of forms. A common type are bots that keep track of a particular coin and post variations on its price within a certain period of time. However, the most predominant ones are those which post advertisement-type of messages. Usually the same text is posted multiple times across many different accounts on the platform. Figure 8 below illustrates one occurrence:
Figure 8: Same comment posted by different accounts, illustrating actions of bots on Twitter
Bot identification is a challenging task because it is not always clear if an account is in fact automated or belongs to a real person. There are some common characteristics among bots, such as a high number of posts per day (hundreds or even thousands) or weird usernames that seem randomly generated. However, these are mere indications to of an account being a bot, not concrete proof. Since developing advanced techniques to identify bot accounts would take a long time and, was not the purpose of this work, an alternative method was implemented to solve the issue.
After the dismissal of all retweets, the remaining ones were alphabetically ordered and each one was compared to the following one. In case both of them were 75% similar (threshold arbitrarily defined), the two users that posted it were flagged. At the end of this process, all tweets from the flagged accounts were discarded. Approximately 2,500 accounts were ignored per daily file, representing 41% of total users retrieved for this research.
Relevant accounts
Upon inspection of the list of flagged users, it was noticed that some accounts from real people were being flagged in the process. They were easily distinguishable because these users are prominent members of the cryptocurrency community. It was then discovered that another type of bot action is simply replicating (not by retweeting it) the message of one of these important users as one of its own. With that, some real persons’ accounts ended up being flagged by the procedure previously described.
To prevent the removal of relevant data, a bypass list of all well-known usernames were created, meaning that all tweets from these accounts were preserved. The list contained around 100 different users, built according multiple sources on the media, such as the article “19 Bitcoin Accounts You Should Follow on Twitter” published by Fortune Magazine [35], the article “The 100 Most Influential People in Crypto - 2018 Edition - ” by Crypto Weekly newsletter [36], among others [37][38]. All official accounts of each one of the selected cryptocoins were also included, if they existed.
Unrelated tweets
The last part of the cleaning was implemented just after the first results. Some of the created topics for the cryptocurrency groups presented words that hardly have any connection to the subject, such as “ice cream”, “chef”, among others that apparently were from an African language (“chigumba”, “mnangagwa”, “chamisa” etc). After investigation of the tweets, it was discovered that some of the coins names and acronyms were shared with terms used in situations unrelated to cryptocurrency, as following:
ZEC (Zcash) was a hashtag used prior to the Zimbabwe elections;
BCN (Bytecoin) is an acronym for an online community called “The Best Chef
Network”;
Ripple is also part of an ice cream flavor called “Raspberry Ripple”.
There was no way to prevent the retrieval of this unwanted data given that the situations mentioned above were unknown before the start of this thesis. All tweets related to those were removed.
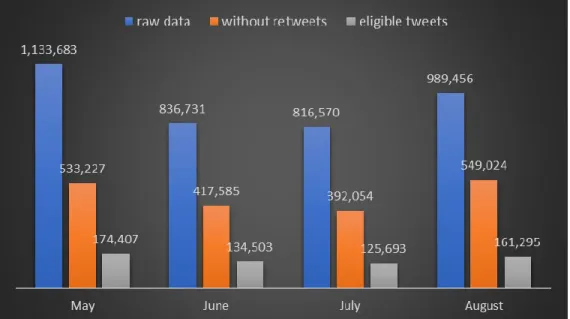
After the last step of the cleaning phase, all remaining tweets were eligible to be used. Figure 9 shows the breakdown of the total number of retrieved tweets and highlights the great amount of useless data generated in the social media. It is possible to reaffirm that retweets make up for around 50% of all collected tweets, while the sum of valid tweets to be used on this work was less than 20% of the total.
Figure 9: Monthly totals of retrieved tweets
4.3 Preprocessing
All eligible tweets were stored in a single file. Along with the message text, each tweet contained information about the date and time of the posting and which cryptocurrency group it belongs to. The text data required further transformation to be appropriately used in the models. The first one was the tokenization process: punctuation was removed and each tweet was transformed into a list of words. Next, the lemmatization process was performed: all words were converted to their root form (for example: “studies”, “studying” and any other variation were stored as “study”), avoiding unnecessary repetition of the inflectional forms of a term.
The last part was the removal of stop words, which usually consists of function words that allow to maintain a cohesive phrase structure and do not have meaning by themselves (i.e. “the”, “at”, “as”). The Natural Language Toolkit (NLTK) used to process the data has a library with a preset list of stop words. However, it needed to be expanded to include more terms that should not
end up appearing in the topics: any references to cryptocurrency names and acronyms (including those not in the scope of the research), people usually referenced in the discussions and popular
cryptocurrency exchanges5. These words do not add any significance to the research:
cryptocurrency names are redundant information and it is not of interest to explore names of individuals discussing them or the exchanges where they are traded. Such terms may appear very frequently within the messages, affecting the model and possibly resulting in low-quality topics if not removed.
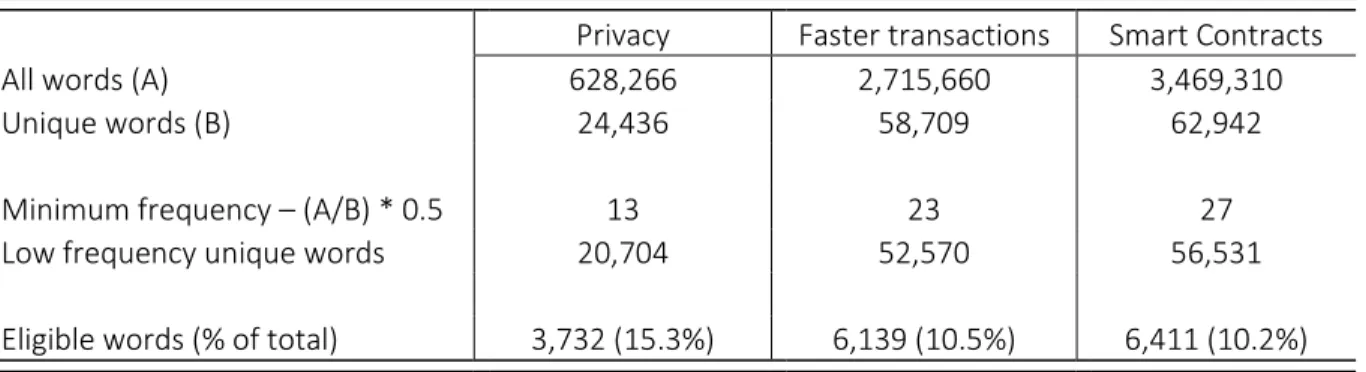
Another addition to the stop word list are words with low frequency considering the entirety of the data. Infrequent words are not evenly distributed among the topics. As a result, some topics show more relevant words than others, affecting the quality of the model. The threshold for infrequency was defined as a word frequency lower than the 50% of the mean of the total amount of words per total unique words, calculated separately for each cryptocurrency group. As seen in Table 2, only 10% to 15% of total unique words were eligible to be used in the model.
Privacy Faster transactions Smart Contracts All words (A) 628,266 2,715,660 3,469,310
Unique words (B) 24,436 58,709 62,942
Minimum frequency – (A/B) * 0.5 13 23 27 Low frequency unique words 20,704 52,570 56,531 Eligible words (% of total) 3,732 (15.3%) 6,139 (10.5%) 6,411 (10.2%)
Table 2: Breakdown of word quantities for each group
4.4 Data modeling
After the preprocessing steps, the text data was ready to be fed into the LDA models. As explained in Chapter 2, text data is one of the two required inputs, the other one being the integer
k defining the number of topics. To find the best k value for an optimal model, coherence measures
CV and UMass were calculated for all LDA models for each cryptocurrency group using k values
from 2 to 40, with step size 4. As pointed out in section 2.4, an optimal k is usually the last value
before topic coherence reaches a plateau. In the case of both CV and UMass indicating approximate