SELECTED ASPECTS OF STATISTICAL ANALYSES IN SPORT
WITH THE USE OF STATISTICA SOFTWARE
Nijole Jascaniene,
1, A, B, DRobert Nowak,
2, B, DDorota Kostrzewa-Nowak,
2, C, DMarek Kolbowicz
3, A, D1 Vilnius Pedagogical University, Vilnius, Lithuania
2 Jędrzej Śniadecki Academy of Physical Education and Sport in Gdańsk, Poland 3 Faculty of Physical Culture and Health Promotion, Szczecin University, Poland A Study Design; B Data Collection; C Statistical Analysis; D Manuscript Preparation
Address for correspondence:
Dorota Kostrzewa-Nowak
Jędrzej Śniadecki Academy of Physical Education and Sport in Gdańsk, Poland
Phone: +48 501 072 680 E-mail: [email protected]
Abstract.
Statistical analysis is a crucial step in all experimental studies, including sport sciences, because inappropriate analysis can lead to erroneous assumptions of performed experiments. Statistical analyses of the training-related data are required to make the training process more efficient. The analyses of various parameters are performed in repeated cycles, requiring appropriate statistical tests. STATISTICA software (version 10) offers a Friedman test for non-parametric analyses of more than 2 groups of repeated measures (which often takes place). Unfortunately, there is no post hoc test to verify which groups decide of the statistical significance of the results. The solution to this problem may lie in the normalization of the data with one of the most popular logarithmic transformations. It allows performing multiple comparisons for the 1-way ANOVA with repeated measures, as well as appropriate post hoc test to precisely determine which group of data is responsible for the statistical significance of the differences.Key words:
data distribution, physical effort, repeated measures, statistical analysis, statistical significanceIntroduction
Statistical analysis plays a vital role in experimental sciences. Inappropriate analysis is considered more dangerous than the lack of it, since it can lead to erroneous assumptions of experiments performed. Sport sciences make no exception. Professional training process requires a number of analyses of sportsmen’s parameters (e.g. biochemical, immunological, physiological) performed in the course of the whole training. Statistical analyses of data are helpful in adjusting the training regime to each individual sportsman to make the training process more efficient.
There is a number of statistical software used in sport sciences, including SSPSS (Manna et al. 2010), GraphPad Prism (Colombini et al. 2012), SAS (Pérusse et al. 1997) or JMP (Bajpeyi et al. 2012). Another example of statistical software that can be used is STATISTICA (StatSoft, Inc., www.statsoft.com).
Regardless of the software used, the procedure of statistical analysis should be standardised. The analyses of various parameters (e.g. blood lactate concentration, blood/plasma creatine kinase activity) are conducted pre-, during- and post-training. As they are made on the same individuals, the statistical tests for repeated measures are to be performed (Stanisz 2000b). In general, it is easy to analyse paired data (two time-points for the same parameter measurement), regardless the data distribution (normal or non-normal). The problem begins when there is more than two time-points to analyse and the data are distributed in a non-Gaussian fashion.
For paired data (Mena et al. 1996), literature describes the use of analysis of variance, followed by the Newman-Keuls post hoc test (Colombini et al. 2012; Ferrauti et al. 1997) or Wilcoxon test.
STATISTICA software (version 10) offers a wide array of tests for the data characterized by Gaussian distribution. Non-parametric analyses of more than 2 groups of repeated measures are represented by Friedman test, being non-parametric equivalent of parametric 1-way analysis of variance for repeated measures (Stanisz 2000c). However, there is no post hoc test offered by STATISTICA to verify which groups decide on the statistical significance of the results. It can only be displayed on the “box and whisker” graph for quantitative assessment. This is why the researcher using STATISTICA software has to use other methods to statistically evaluate non-Gaussian results.
Methods
The simulations of the statistical analysis of hypothetical parameter’s changes were performed. The analysed hypothetical group consisted of 10 sportsmen performing typical daily training. The parameter was measured in three time-points: just before the physical effort (“pre”), just after the effort (“post”) and during the restitution (“restitution”).
The simulated data were processed using STATISTICA software (StatSoft, Inc. (2011), STATISTICA (data analysis software system), version 10, www.statsoft.com). The W Shapiro-Wilk test was applied to assess normal data distribution. Non-parametric Friedman as well as Wilcoxon tests were performed to compare data from each time-point.
Logarithmic normalization of the data performed was applied. The new sets of data were described as “log (pre)”, “log (post)” and “log (restitution)”, respectively. After that, multiple comparison for the 1-way ANOVA with repeated measures, followed by Tukey’s HSD as well as Newman-Keuls post hoc tests were performed.
The significance level was set at 0.05.
Results
Data distribution
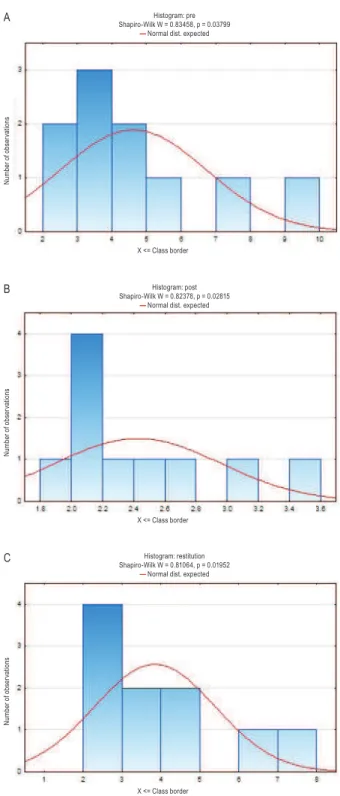
First step in statistical analysis is the assessment of data distribution. The W Shapiro-Wilk test was applied to assess normal data distribution. Figure 1 shows histograms of data distribution as well as values of W Shapiro-Wilk statistics for the parameter measured in each time-point. The data in each time-point possess non-Gaussian distribution (p = 0.03799, p = 0.02815, p = 0.01952 for measurement just before the physical effort, just after the
Histogram: pre Shapiro-Wilk W = 0.83458, p = 0.03799
— Normal dist. expected
N u m b e r o f o b se rv at io n s X <= Class border A Histogram: post Shapiro-Wilk W = 0.82378, p = 0.02815
— Normal dist. expected
N u m b e r o f o b se rv at io n s X <= Class border B Histogram: restitution Shapiro-Wilk W = 0.81064, p = 0.01952
— Normal dist. expected
N u m b e r o f o b se rv at io n s X <= Class border C
Figure 1.
Histograms of data distribution as well as values of W Shapiro-Wilk statistics for the parameter measured in tree time-points: A – just before the physical effort (“pre”); B – just after the effort (“post”); C – during the restitution (“restitution”); N = 10effort and during the restitution, respectively). Non-normal data distribution determines non-parametric statistical analyses.
Determination of the significance of differences between the results in each time-point
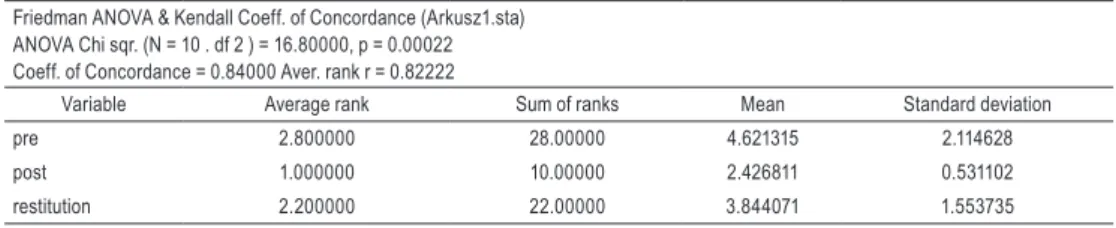
To compare data from each time-point, non-parametric Friedman test was performed. Numerical results of the analysis are shown in Table 1. They show a significant difference between the data collected from each time-points (p = 0.00022). Graphical representation of the results is shown in Figure 2. Unfortunately, it is hard to determine between which time-points the difference becomes significant. There is no post hoc test in STATISTICA to verify this situation.
Table 1.
ANOVA Friedman test results indicating significant difference between data obtained in analysed time-points, N = 10Friedman ANOVA & Kendall Coeff. of Concordance (Arkusz1.sta) ANOVA Chi sqr. (N = 10 . df 2 ) = 16.80000, p = 0.00022 Coeff. of Concordance = 0.84000 Aver. rank r = 0.82222
Variable Average rank Sum of ranks Mean Standard deviation
pre 2.800000 28.00000 4.621315 2.114628
post 1.000000 10.00000 2.426811 0.531102
restitution 2.200000 22.00000 3.844071 1.553735
Figure 2.
“Box and whisker” graph of median, interquartile range as well as min and max values obtained in each time-point, N = 10Determination of the significance of differences between pairs of the results from different time-points
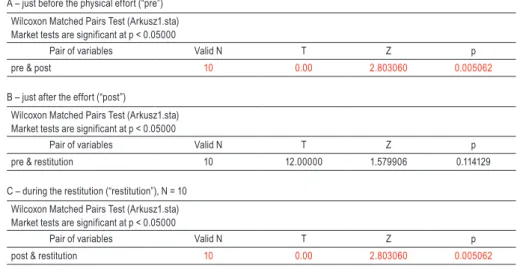
One can decide to compare the results in pairs in the following simulation: “pre” & “post”, “pre” & “restitution” and “post” & “restitution” respectively. It is a useful method in obtaining numerical data of difference analyses (Table 2),
ANOVA Friedman test
especially that they are in line with the data shown in Figure 2. The data indicate that significant differences exist in both “pre” & “post” (p = 0.005062, Table 2A) as well as “post” & “restitution” pairs (p = 0.005062, Table 2C). However, it may lead to incorrect assumptions since this test compares pairs of the data instead of whole data units.
Table 2.
Wilcoxon test results for analysed data measured in tree time-pointsA – just before the physical effort (“pre”) Wilcoxon Matched Pairs Test (Arkusz1.sta) Market tests are significant at p < 0.05000
Pair of variables Valid N T Z p
pre & post 10 0.00 2.803060 0.005062
B – just after the effort (“post”)
Wilcoxon Matched Pairs Test (Arkusz1.sta) Market tests are significant at p < 0.05000
Pair of variables Valid N T Z p
pre & restitution 10 12.00000 1.579906 0.114129
C – during the restitution (“restitution”), N = 10 Wilcoxon Matched Pairs Test (Arkusz1.sta) Market tests are significant at p < 0.05000
Pair of variables Valid N T Z p
post & restitution 10 0.00 2.803060 0.005062
Data normalization
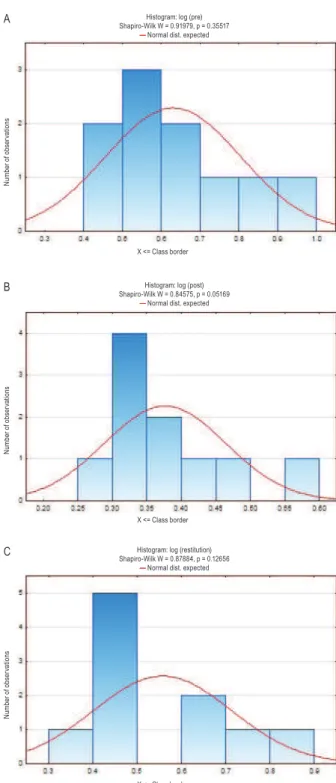
The distribution of the results was normalized using logarithmic normalization. The new sets of data were described as “log (pre)”, “log (post)” and “log (restitution)”. The values of W Shapiro-Wilk statistics for the normalized parameter values measured at each time-point showed Gaussian distribution (Figure 3).
Analysis of variance (ANOVA) with repeated measures and post hoc tests
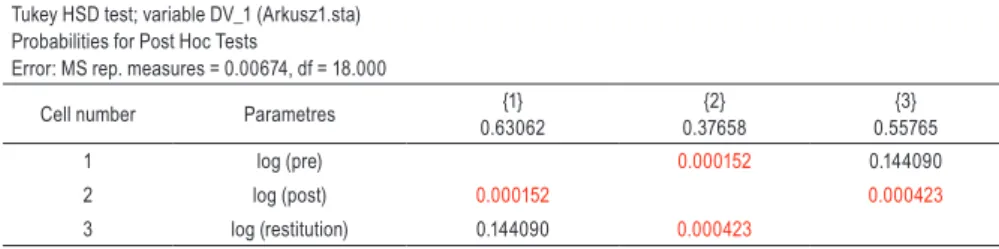
Having normal data distribution, multiple comparisons for the 1-way ANOVA with repeated measures can be performed. As it can be seen in Table 3, there is a significant difference between the three groups of data (“log (pre)”, “log (post)” and “log (restitution)”). Tukey’s HSD post hoc test indicated that the difference is visible between the pairs: “log (pre)” & “log (post)” (p = 0.000152) and “log (post)” & “log (restitution)” (p = 0.000423) (Table 4). The Newman-Keuls post hoc test gave different p value for the comparison of “log (post)” & “log (restitution)” – p = 0.000257 (Table 5).
Table 3.
Multiple comparison for the 1-way ANOVA with repeated measures test results for analysed data measured in tree time-points: just before the physical effort (“log (pre)”), just after the effort (“log (post)”) and during the restitution (“log (restitution)”), N = 10Multivariate tests for repeated measure: DV_1 (Arkusz1.sta) Sigma-restricted parameterization
Effective hypothesis decomposition
Efect Test Value F Efect – df Error – df p
Figure 3.
Histograms of data distribution as well as values of W Shapiro-Wilk statistics for the logarithmic normalization of parameter measured in tree time-points: A – just before the physical effort (“log (pre)”); B – just after the effort (“log (post)”); C – during the restitu-tion (“log (restiturestitu-tion)”); N = 10Histogram: log (pre) Shapiro-Wilk W = 0.91979, p = 0.35517
— Normal dist. expected
N u m b e r o f o b se rv at io n s X <= Class border A
Histogram: log (post) Shapiro-Wilk W = 0.84575, p = 0.05169
— Normal dist. expected
N u m b e r o f o b se rv at io n s X <= Class border B
Histogram: log (restitution) Shapiro-Wilk W = 0.87884, p = 0.12656
— Normal dist. expected
N u m b e r o f o b se rv at io n s X <= Class border C
Table 4.
Tukey’s HSD post hoc test results for 1-way ANOVA with repeated measures analysis, N = 10Tukey HSD test; variable DV_1 (Arkusz1.sta) Probabilities for Post Hoc Tests
Error: MS rep. measures = 0.00674, df = 18.000
Cell number Parametres {1}
0.63062 {2} 0.37658 {3} 0.55765 1 log (pre) 0.000152 0.144090 2 log (post) 0.000152 0.000423 3 log (restitution) 0.144090 0.000423
Table 5.
Newman-Keuls post hoc test results for 1-way ANOVA with repeated measures analysis, N = 10Newman-Keuls test; variable DV_1 (Arkusz1.sta) Probabilities for Post Hoc Tests
Error: MS rep. measures = 0.00674, df = 18.000
Cell number Parametres {1}
0.63062 {2} 0.37658 {3} 0.55765 1 log (pre) 0.000152 0.062435 2 log (post) 0.000152 0.000257 3 log (restitution) 0.062435 0.000257
Discussion and conclusions
Statistical analysis is a crucial step in all experimental studies, including sport sciences, because inappropriate analysis can lead to some erroneous assumptions of experiments performed. Statistical analyses of the training-related data are required to make the training process more efficient.
Although there is a number of statistical software used in sport sciences, the procedure of statistical analysis should be standardised. The analyses of various parameters (e.g. blood lactate concentration, blood/plasma creatine kinase activity) are often made pre-, during- and post-training, requiring statistical tests for repeated measures (Stanisz 2000b). It is quite easy to analyse paired data (two time-points for the same parameter measurement), regardless of the data distribution. The problem begins when there are more than two time-points to analyse. It is even more complicated in the case of non-normal data distribution. For the purpose of statistical analysis, literature data describe the use of analysis of variance followed by the Newman-Keuls post hoc test (Colombini et al. 2012; Ferrauti et al. 1997) or Wilcoxon test for paired data (Mena et al. 1996). However, all of these tests have their own drawbacks.
Wilcoxon test can only compare a pair of data (Stanisz 1999a; 1999b), which makes \comparing more than 2 sets of data useless. It may be tempting to use Wilcoxon to compare pairs of data even if there are more than 2 groups compared, but it may lead to incorrect assumptions since this test compares pairs of data instead of the whole data groups.
The Newman-Keuls test is a post hoc test used in ANOVA analysis, which requires Gaussian data distribution (Stanisz 2000a). Many experts, however, do not recommend this particular test because it does not keep the chance of a Type I error in any comparison to be 5% (Levin et al. 1994; Graph Pad software FAQ # 1093).
In STATISTICA software (version 10) non-parametric analyses of more than 2 groups of repeated measures are represented by Friedman test, being non-parametric equivalent of parametric 1-way analysis of variance for repeated measures (Stanisz 2000c). However, in this software there is no post hoc test to verify which groups decided of the statistical significance of the results. “Box and whisker” graphs offer only a quantitative assessment of the differences, which is often insufficient.
An alternative method for non-normal distributed data analysis is its normalization, followed by the use of parametric statistics. One of the most popular methods of data normalization is the logarithmic transformation.
It is useful especially in the case of right-skewed data distribution (Watała 2002). In the simulated data, this kind
of transformation leads to a normal distribution, as it was confirmed using W Shapiro-Wilk test. The normalization of the results allows performing multiple comparisons for the 1-way ANOVA with repeated measures. Both Tukey’s HSD and Newman-Keuls post hoc tests provided similar results of simulated time-points comparisons but Tukey’s test is considered to be safer, taking into account different authors’ opinions (Levin et al., 1994; Graph Pad software FAQ # 1093).
In conclusion, STATISTICA software offers much more tools for the analysis of normally distributed data. In the case of repeated measures, when there are more than 2 repeats of measurements and non-Gaussian distribution, proper statistical analysis requires data normalization to asses between which groups a significant difference occurs.
References
Bajpeyi S., Reed M.A., Molskness S., Newton C., Tanner C.J., McCartney J.S., Houmard J.A. Effect of short-term exercise training on intramyocellular lipid content. Appl. Physiol. Nutr. Metab. 2012; 37 (5): 822–828.
Colombini A., Corsetti R., Marco M., Graziani R., Lombardi G., Lanteri P., Banfi G. Serum creatine kinase activity and its relationship with renal function indices in professional cyclists during the Giro d’Italia 3-week stage race. Clin. J. Sport Med. 2012; 22 (5): 408–413.
Ferrauti A., Weber K., Striider H.K. Effects of tennis training on lipid metabolism and lipoproteins in recreational players. Br. J. Sports Med. 1997; 31 (4): 322–327.
Graph Pad software FAQ # 1093 (www.graphpad.com/support/faqid/1093).
Levin J.R., Serlin R.C., Seaman M.A. A controlled, powerful multiple-comparison strategy for several situations. Psychol. Bull. 1994; 115 (1): 153–159.
Manna I., Khanna G.L., Chandra Dhara P. Effect of training on physiological and biochemical variables of soccer players of different age groups. Asian J. Sports Med. 2010; 1 (1): 5–22.
Mena P., Maynar M., Campillo J.E. Changes in plasma enzyme activities in professional racing cyclists. Br. J. Sports Med. 1996; 30 (2): 122–124.
Pérusse L., Collier G., Gagnon J., Leon A.S., Rao D.C., Skinner J.S., Wilmore J.H., Nadeau A., Zimmet P.Z., Bouchard C. Acute and chronic effects of exercise on leptin levels in humans. J. Appl. Physiol. 1997; 83 (1): 5–10.
Stanisz A. Podstawy statystyki dla prowadzących badania naukowe. Odcinek 10: Testy istotnych różnic dla prób zależnych [in Polish]. Medycyna Praktyczna. 1999a; 7: 207–209.
Stanisz A. Podstawy statystyki dla prowadzących badania naukowe. Odcinek 12: Testy nieparametryczne – cz. II [in Polish]. Medycyna Praktyczna. 1999b; 10: 167–169.
Stanisz A. Podstawy statystyki dla prowadzących badania naukowe. Odcinek 16: Analiza wariancji – testy po fakcie [in Polish]. Medycyna Praktyczna. 2000a; 4: 159–162.
Stanisz A. Podstawy statystyki dla prowadzących badania naukowe. Odcinek 18: Pomiary powtarzane [in Polish]. Medycyna Praktyczna. 2000b; 6: 160–165.
Stanisz A. Podstawy statystyki dla prowadzących badania naukowe. Odcinek 20: ANOVA nieparametryczna [in Polish]. Medycyna Praktyczna. 2000c; 9: 166–168.
Watała C. Transformacja danych – sposoby normalizacji rozkładu. In: Biostatystyka – wykorzystanie metod statystycznych w pracy badawczej w naukach biomedycznych [in Polish]. Alfa Medica Press. Bielsko-Biała 2002: 97–100.