December, 1997
Tools for Teaching Change Management:
The Matrix of Change
tmand Supporting Software
Erik Brynjolfsson Stanford University and MIT
[email protected] http://ccs.mit.edu/erik Marshall van Alstyne* University of Michigan and MIT
[email protected] Abraham Bernstein
MIT [email protected] Amy Austin Renshaw
MIT
* Corresponding Author: School of Information, University of Michigan 305D West Hall, 550 East University Ave., Ann Arbor, MI 48109-1092 Voice: 313-647-8028, Fax: 313-764-2475, email: [email protected]
The Matrix of Change
tmand Supporting Software
Erik Brynjolfsson, Marshall Van Alstyne, Abraham Bernstein and Amy Renshaw
One of the key advantages of information technology is its ability to support new
organizational forms. The task of shifting between old and new forms, however, can be
a difficult, time consuming, and haphazard process (Davenport, 1993, Davenport and
Stoddard, 1994; Hammer, 1990). Interactions among various work practices can lead to
numerous unanticipated side effects as mangers alter individual practices without
considering whole systems of work. In particular, the importance of complementarities
among different practices has been formalized mathematically in the economic literature
(Milgrom and Roberts, 1990). However, practicing managers and students have had
difficult in applying these insights.
This talk will present recent developments in providing support tools for change management and explain how they have been effectively used for teaching students about IT-enabled change management in the core IT classes at MIT and Stanford. It will also demonstrate new software for use in both the teaching and practice of business process reengineering. The software has been developed using the Visual Basic programming language and executable versions will be available for delivery over the Worldwide Web for classroom use (see http://ccs.mit.edu/MoC).
The core of the new teaching sequence is a new tool, the Matrix of Change, which helps to characterize such change management features as the feasibility of proposed changes, the preferred speed of execution, and the best sequence of changes. It works by identifying
complementary and interfering work practices. Complementary practices reinforce one another. Doing more of one complement increases returns to another. Narrow job functions, for example, increase a firm’s ability to offer piece rate pay so these practices are complementary. In contrast, interfering practices work at cross-purposes. A flatter managerial hierarchy, for example, shifts more strategic decisions to workers, decreasing a firm’s ability to offer piece rate pay.
The experience of a large consumer products company provides an instructive example. Top management sought to use IT to drive a revolution in its manufacturing processes and they
understood well that simply introducing IT was not enough to get the results they required. Accordingly, they specified a detailed plan for changed business practices in several areas including supplier relations, product variety, inventory policy, job responsibilities, management systems and incentives. After an investment of millions of dollars in highly flexible,
computerized equipment, the firm was surprised to find that its productivity actually fell while it made no real gains in flexibility or responsiveness.
What went wrong? Close examination of the way workers were actually using the equipment revealed that they had only made surface level changes in their factories business processes. Many of the employees had several decades of deeply rooted experience with the old technology and systems and they found it all too easy to slip into their old routines.
For instance, with the old equipment, productivity depended critically on minimizing time-consuming change-overs from one product line to another and large work-in-process inventories were routinely built up to minimize stock-outs. With the new equipment, however, change-overs could be done in a matter of minutes and the management plan called for squeezing out inventories. Nonetheless, a lot of well-meaning factory workers continued to avoid change-overs since they “knew”, or thought they knew, that always keeping the production line humming was the key to higher productivity. Ironically, with a little tinkering, they found that the new equipment was so flexible that it could be used just like the old machines! This may have made it easy to avoid changing their tried and true work habits, but the net result was that none of the anticipated improvements in flexibility, responsiveness or inventories were realized.
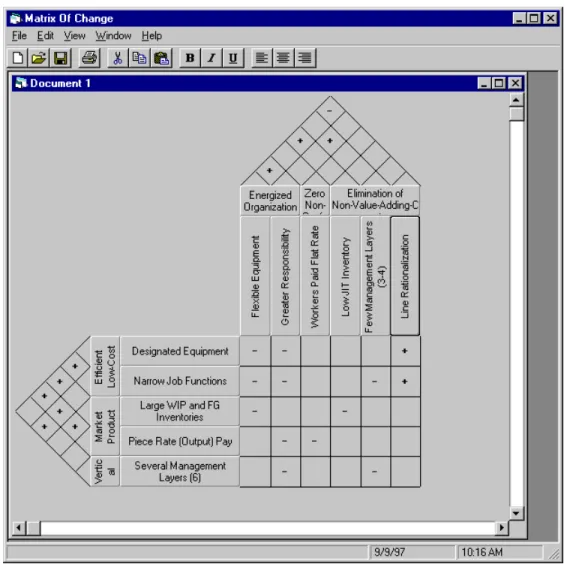
The basic problem with many business process redesign efforts is that the various components of the new system interact with each other. As a result, they often cannot be implemented in isolation. The accompanying diagram (figure 1) illustrates a few of the interactions at the consumer products company described above. In the figure, a representative set of existing practices for a more traditional hierarchy is shown juxtaposed against a
representative set of target practices for a more modern manufacturing plant. The results are summaries of data administered as a survey to a group consisting of managers, engineers, and plant workers.
’+’ Reinforcing Practice ’ ’ Weak / No Interaction ’- ’ Interfering Practice Matrix Interaction
+
+ +
Designated Equipment Narrow Job Functions Large WIP and FG Inventories Piece Rate (Output) Pay Several Mgmt Layers (6) Existing Practices Energized Organization Zero Non-Conform. Elimination of Non-Value-Adding Costs-+
+
+
+
+
+
+
+
-
2
+
1
-
1
Importance+
2
+
2
+
1
+
1
+2 Very Important +1 Somewhat Important 0 Irrelevant - 1 Somewhat Interfering - 2 Significantly Interfering Importance to Job-+
2
Figure 1: A Matrix of Change Analysis
Plus signs indicate complementary practices and minus signs indicate interfering practices. In this example, under existing practices, designated equipment complements narrow job functions hence the “+” sign where these two practices overlap at the left of the diagram. However, it interferes with the target practice of providing workers with greater responsibility, as indicated by the “-“ signs in the central matrix. A set of importance ratings also helps to indicate the relative value contributed by various practices as seen by respondents to the survey.
While this simple set of interactions is relatively easy to see, most IT-enabled process redesign projects involve a far larger number of interacting practices. For instance, really changing inventory policy requires more than a decree from above. It requires new incentives (the old piece rate system encouraged building up inventories) and new training. In fact, at the consumer product company, about two dozen distinct practices were involved in both the old work system and the new work system. IT directly changed only one of them, but indirectly, it required a much more complex collection of supporting changes.
This story had a happy ending. By increasing the level of communication among all the affected parties, the importance of aligning business practice with the new technology was better
understood. Within two years, performance increased significantly at the firms’ factories. The team implementing the changes found that many of the complicated interactions among practices could be visualized with the aid of an expanded version of the diagram above and some related tools. A more detailed description of this case and the change management tools that were used there was published earlier this year (Brynjolfsson, Renshaw and Van Alstyne, 1997).
The matrix is useful for answering several types of change management questions, including stability, pace, sequence, and transition difficulty. It suggests, for example, that the set of target practices is less stable than the set of existing practices since it contains interfering practices and many fewer complementary practices. Pace and sequence may be governed by the ability to identify blocks of complementary practices and remove them simultaneously. A block represents a cluster of thickly complementary practices. Given multiple blocks, the pace of change within a block should be rapid while the pace of change between blocks may be slow. The central matrix also shows how practices interfere so that target practices may be substituted for existing practices in a sequence that accumulates the least cost transitions. It would make little sense, for example, to introduce flexible equipment before the block of practices surrounding narrow job functions had been removed.
As a pedagogical tool, the Matrix of change has also been taught alongside alternative approaches to improve students comprehension of the change process in organizations. In particular, a more improvisational approach (Orlikowski and Hofman, 1997) emphasizes that change is incremental and that managers may need to revisit their preconceived plans as implementation proceeds and they encounter unanticipated obstacles. A learning approach (Leonard Barton, 1988) also emphasizes that the "know-how" and "know-why" of one group's change plans and experience may need to be disseminated among satellite groups to streamline the change process and allow groups to adapt to one another's modified behaviors. These alternatives nicely complement the Matrix of Change, which emphasizes the planning aspects of change management.
The Supporting Software
We have a working prototype of the software to support construction of the Matrix of Change and its use in teaching.
We will demonstrate the software and make it available to interested participants at the conference. Several screen shots are presented in the appendix. We implemented the software
using Visual Basic relying on the mostly object oriented features of version 5.1 The Matrix of Change software provides a standard MDI-interface2 and handles most operations by direct manipulation (like ‘drag and drop’, ‘double-clicking’ etc.). In terms of functionality the base release software offers support to draw the matrix and fill out its values as well as some sorting capabilities. These sorting capabilities allow users to sort the matrix according to the matrix-interactions. Furthermore reports of the matrix can be generated in Visio™. Online help will also be available.
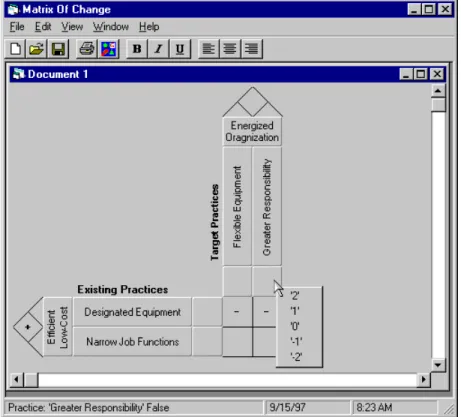
Figure 2: A screen shot from the software in use
The software can be obtained from the Matrix of Change web site:
http://ccs.mit.edu/MoC. It will be offered for download in form of a ‘zipped’ archive that will have all the executable files necessary to start the installation procedure. The software does not
1
encapsulation and polymorphism
2
Multi Document Interface: The ability to open a number of documents at the same time.
require any network connection. It was developed with the assumption that users will have to be able to use it while being at a field site as well as in their offices. In addition people may want to use the tool to examine proprietary data, they would not want to share over the Internet. We therefore chose the approach of developing a down-loadable application as opposed to a purely web-based tool. The software will only run on 32-Windows platforms such as Windows NT™ and Windows95™.
We are planning at least two major extensions to the current release: routing optimization and connections to a back-end database. The first extension will consider the possibility of optimizing the transition paths from the existing to target states to achieve a least cost or least disruptive path. The second extension will consider process specific knowledge captured in a large database of organizational practices [Malone et al. 1992]. Process specific knowledge might allow the software to automatically generate interference patterns in the matrix and enable the development of industry templates and allow for in depth studies in certain industries.
References
Brynjolfsson, Erik, Amy Renshaw and Marshall Van Alstyne, The Matrix of Change, Sloan Management Review, Winter, 1997.
Davenport, Thomas. Process Innovation. Boston: Harvard Business School Press, 1993. Davenport, Thomas, and Donna Stoddard. “Reengineering: Business Change of Mythic
Proportions?” MIS Quarterly 18 (1994): 121-127.
Hammer, Michael. “Reengineering Work: Don't Automate, Obliterate.” Harvard Business Review July-August (1990): 104-112.
Leonard-Barton, D. (1988). Implementation as Mutual Adaptation of Technology and Organization. Research Policy, 17, 251-267.
Malone, T. W., Crowston, K. L., & Pentland, B. (1992). “Tools for Inventing Organizations: Toward a Handbook of Organizational Processes.” MIT Center for Coordination Science. Milgrom, P., and J. Roberts. “The Economics of Modern Manufacturing: Technology, Strategy,
and Organization.” American Economic Review 80.3 (1990): 511-528.
Orlikowski, W., & Hofman, D. (1997). An Improvisational Model of Change Management: The Case of Groupware Technologies. Sloan Management Review, Winter.
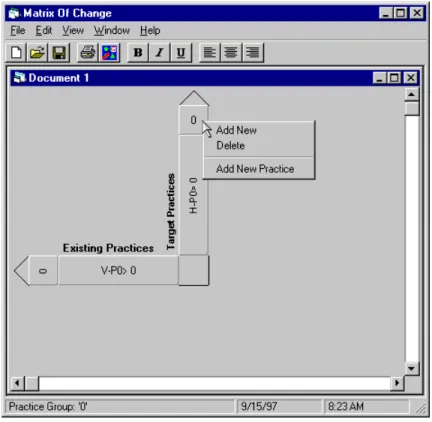
Figure A1:
Starting up the Matrix of Change Software
#HVGT5VCTVKPIVJG5QHVYCTGCP GORV[/CVTKZCRRGCTUKPYJKEJGXGT[UVCVGJCU
QPGFGHCWNVRTCEVKEGITQWRYKVJQPGRTCEVKEG$[ENKEMKPIQPVJGRTCEVKEGITQWRU
TGURGEVKXGN[VJGRTCEVKEGUYKVJVJGTKIJVOQWUGDWVVQPPGYRTCEVKEGITQWRUQT
RTCEVKEGUECPDGCFFGF
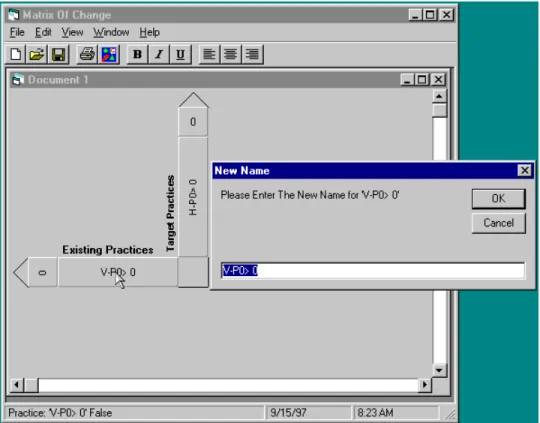
Figure A2:
Changing the Name of a Practice (or a Practice Group)
&QWDNGENKEMKPIQPCRTCEVKEGITQWRQTCRTCEVKEGRQRUWRCFKCNQIDQZYJKEJ
CNNQYUVQTGPCOGVJGRTCEVKEGITQWRTGURGEVKXGN[VJGRTCEVKEG
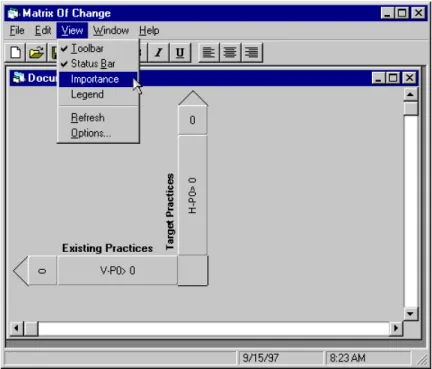
Figure A3:
The View Menu
6JG 8KGYOGPWEQPVTQNUVJGFKURNC[QHVJGOCVTKZCPFVJGCRRNKECVKQP'IVJG
KORQTVCPEGTCVKPIQTVJGNGIGPFECPDGJKFFGPCUKPVJKUUETGGPFWOR
Figure A4: