Article
1
Application of Benchmarking and Principal
2
Component Analysis in Measuring Performance of
3
Public Irrigation Schemes in Kenya
4
Faith Muema1,*, Patrick G. Home 1 and James M. Raude2
5
* Pan African University, Institute for Basic Sciences, Technology and Innovation, (PAUSTI). P. O. Box
6
62000-00200 Nairobi, Kenya: [email protected]; Tel.: +254713009267
7
1 Jomo Kenyatta University of Agriculture and Technology, (JKUAT).P. O. Box 62000-00200 Nairobi, Kenya;
8
9
2 Soil, Water and Environmental Engineering Department, Jomo Kenyatta University of Agriculture and
10
Technology, (JKUAT).P. O. Box 62000-00200 Nairobi, Kenya; [email protected]
11
12
Abstract: The Inefficient water use, varying and low productivity in Kenya public irrigation
13
schemes is a major concern. It is therefore necessary to periodically monitor and evaluate the
14
performance of public irrigation schemes. The performance of public irrigation in western Kenya
15
was assessed by combining benchmarking methodology and principal component analysis. The
16
aim was to quantify and rank the performance of pumped public irrigation schemes in Kenya.
17
Eleven benchmarking indicators were computed for the period from 2012 to 2016 and compared to
18
global benchmark values. The indicators used fall under agricultural productivity, water supply
19
and financial performance categories. The computed agricultural productivity was 36%–51% in
20
Ahero, 23%–42% in West Kano and 26%–50% Bunyala irrigation scheme. Water supply
21
performance in Ahero, West Kano and Bunyala irrigation schemes varied from 24% to 58%, 3% to
22
49% and 19% to 43% respectively. Financial performance varied from 46% to 54% in Ahero, 25% to
23
32% in West Kano and 54%–56% in Bunyala irrigation scheme. An average overall performance
24
efficiency of 46%, 39% and 31% was obtained in Ahero, Bunyala and West Kano irrigation schemes
25
respectively. The performance of the irrigation schemes is very poor and measures on improving
26
performance are needed.
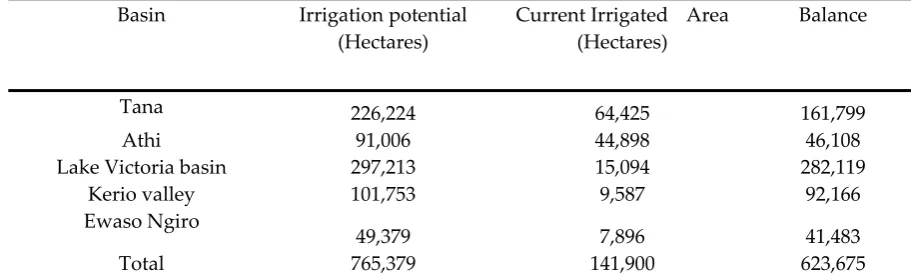
27
Keywords: Benchmarking, Evaluation of performance, Performance indicator, Principal
28
component analysis.
29
30
1. Introduction
31
Water is a limited resource facing stiff competition among various economic sectors. In
32
addition, the increasing population is exerting more pressure on the finite water resources making it
33
increasingly scarce [1].Agricultural activities in Kenya use 70 per cent of water available, majorly in
34
irrigation [2]. Therefore, efficient utilization of water is needed in irrigation to save water; increase
35
productions per water used and reduce negative effects on the environment such as salinization and
36
water logging because of applying excess water.
37
The population in Kenya has been growing rapidly having an increase from 28.7 million in
38
1999 to 38.6 million in 2009 and is expected to reach 69.5 million by 2030 [3-4]. The country is
39
therefore faced with need to provide adequate food supply by employing various strategies to
40
increase agricultural production to match the raising demands for food. Production in agriculture
41
can be increased through irrigation since expansion of land under agriculture is limited by
42
availability of rainfall [3]. Irrigation leads to increase in yield of most crops by 100 to 400 per cent and
43
it is projected that 70 per cent food produced in 30 years’ time will be from irrigated agriculture [5].
44
According to [6] irrigation in arid and semi-arid lands improves economic growth and can increase
45
production by up to 400 per cent.
46
Irrigated agriculture is faced with challenges such as inefficient water use, low returns in
47
investment, management and poor operation [1]. Increasing efficient water use promotes equity in
48
water distribution and reduces the difference between potential crop water requirement and actual
49
water use. Moreover, farmers can use less water to achieve high production while the remaining
50
water of water can be left to maintain ecological cycle and the environment of the river basin.
51
According to Kenya’s National water Master Plan 2030, the total irrigated area in Kenya as of 2010
52
was estimated to be 141,900 ha which is way below the potential irrigable area of 765,379 ha[7].
53
Irrigated agriculture utilises 4 per cent of the country’s total area under agriculture. This accounts for
54
18 per cent of the total value of all agricultural produce therefore contributing 3 per cent of the gross
55
domestic product. There exists a greater potential in increasing production and productivity in
56
agriculture through irrigation[7]. Irrigation potential in Kenya is under-utilized as indicated inTable
57
1.
58
Table 1. Irrigation potential in Kenya
59
Basin Irrigation potential
(Hectares)
Current Irrigated Area (Hectares)
Balance
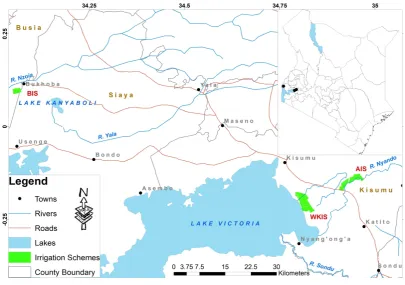
Tana 226,224 64,425 161,799
Athi 91,006 44,898 46,108
Lake Victoria basin 297,213 15,094 282,119
Kerio valley 101,753 9,587 92,166
Ewaso Ngiro
49,379 7,896 41,483
Total 765,379 141,900 623,675
Kenya’s irrigation systems can be broadly categorized into; smallholder schemes, large-scale
60
private/commercial irrigation schemes and public schemes [8]. Large commercial farms occupy 40
61
per cent of total irrigated land while smallholder irrigation schemes account for 42 per cent and the
62
rest 18 per cent is occupied by Government-managed schemes [9].The main irrigated crops grown
63
are rice, vegetables, coffee, fruits, sugarcane, cotton, maize and horticulture [3].The public
64
irrigation schemes in Kenya are characterised by poor performance hindering their expansion [8].
65
Heavy investments are channelled in these irrigation schemes and are therefore expected to be
66
operating efficiently and effectively to meet rising food demands [3]. However, the level of
67
performance and sustainability of the public irrigation schemes in Kenya is not known. This has
68
prompted measurement of performance of public irrigation schemes using benchmarking indicators
69
and principal component analysis. The study provides information to scheme management to
70
enable monitoring of irrigation operations and evaluation of efficiency of utilisation of resources at
71
system, scheme, catchment and national levels. Furthermore, it sheds some light to stakeholders and
72
policy makers on area that require policy interventions and reformulation of strategies needed to
73
achieve food security.
74
Performance assessment in irrigation sector looks into optimizing resource use with the aim of
75
achieving maximum possible produce [10]. Performance of an irrigation scheme is the measure of
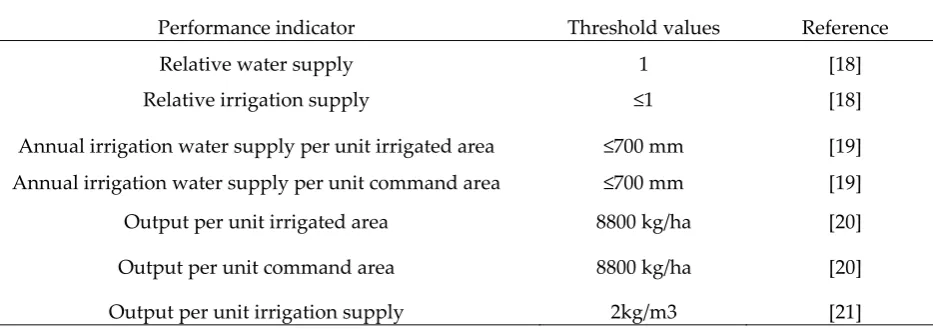
76
the degree to which it achieves target objectives [11]. Evaluation of performance of an irrigation
77
system gives an indication of how far the goals and objectives set during project formulation have
78
been met [12]. It compares the actual results to the expected results. To promote efficient utilisation
79
of resources, irrigation sector should be benchmarked. Benchmarking was developed by
80
International Programme for Technology and Research in Irrigation and Drainage (IPTRID) as a
81
management tool to be used in improving productivity and efficiency in irrigation and drainage
82
sector [13]. It is a process of analysing and comparing performance of an organisation either
83
identification gap in performance between current and better achievable standards and changes
85
required to achieve higher performance standards [15].
86
IPTRID, Food and Agriculture Organization (FAO), World Bank, International Water
87
Management Institute (IWMI) and International Commission on Irrigation and Drainage (ICID)
88
have laid emphasis on measuring performance in irrigation and drainage sector as a way of
89
achieving sustainable development in agriculture. However, benchmarking has received little
90
attention for most irrigation projects in developing countries and has not been embraced in Kenya.
91
The process of benchmarking involves six stages: identification and planning; data collection;
92
analysis; integration; action; and monitoring and evaluation [15]. It is a data intensive activity and
93
is limited by availability of data since it requires day to day data collection. Benchmarking looks into
94
comparison of input and outputs without considering the internal processes which affect the level of
95
output. The main goal of benchmarking is to improve performance of an organization [15]. There
96
are several drivers to improving performance of an irrigation system. These include; increasing
97
competition for water, rising food demand, need for more water use efficiency, water prices,
98
pressure to increase productivity for less cost[14]. Undertaking benchmarking enables project
99
managers and authorities to identify problems and measures required to bridge the gap between
100
current and desirable performance standards.
101
Performance in irrigation systems is measured using performance indicators which inform the
102
stakeholders on the level of performance. A performance indicator is a description of actual
103
achievement in relation to one of the goal of irrigation system [14]. In comparing performance
104
indicators, irrigation schemes that are less or more efficient in comparison to others are identified
105
and necessary measures needed to correct the inefficiency undertaken [16]. However, the irrigation
106
schemes cannot be ranked using indicator to indicator comparison. Stakeholders and policy makers
107
are interested in aggregated performance scores which give them an indication of level performance
108
of an irrigation schemes compared to the others [13]. In this paper, combination of performance
109
indicators and principal component analysis (PCA) was applied in evaluating the performance of
110
irrigation schemes. Combination of benchmarking and PCA enabled the determination of a single
111
performance score which indicates the performance level of an individual irrigation scheme in
112
comparison to the others.
113
This study was based on two domains: service delivery and Productive efficiency: Service
114
delivery domain contains two areas of service provision: (a) water supply efficiency - the adequacy
115
of managing water delivery to meet water demand; and (b) financial performance - the efficiency of
116
resource use to offer irrigation service. Productive efficiency measures the efficiency.
117
2. Materials and Methods
118
2.1. Description of study area
119
The study was carried in three rice growing irrigation schemes namely; Ahero, West Kano and
120
Bunyala, located in western Kenya (Figure 1)which are managed by National Irrigation Board (NIB).
121
All the schemes use pumped-gravity surface irrigation water distribution method. Water is
122
abstracted using electric powered pumps and conveyed with open earth canals. The western Kenya
123
region has a hot and humid weather with bimodal rainfall pattern. The schemes are underlain by
124
126
Figure 1. Study Area
127
Ahero Irrigation Scheme (AIS) lies at longitude 34°58’ east and latitude 00°10’ south in Kano
128
plains, Kisumu County and abstracts water from river Nyando. The Scheme has a gross area of 1540
129
ha out of which 900 ha has been developed for crop production supporting 556 tenant farmers. The
130
area gets mean annual rainfall of 1233 mm and the mean monthly temperature ranges from 23.4°C to
131
25.6°C. West Kano irrigation scheme (WKIS) is located between longitudes 34°48’ East and 35°02’
132
East and between latitudes 00°04’ South and 00°20’ South along the shores of Lake Victoria in Kano
133
plains, Kisumu County[17] . Water is abstracted from Lake Victoria by pumping. The scheme has a
134
service area of 1780 ha out of which 980 ha has been developed for crop production serving 845
135
tenant farmers. The area gets mean annual rainfall of 1100 mm and the mean diurnal temperature is
136
23°C. Bunyala irrigation scheme (BIS) is located at longitude 34°`04’ East and latitude 00°06’ North
137
in Kisumu Busia / Siaya County. The scheme has a total gazetted area of 728 ha with 702 ha under
138
irrigation supporting 1934 farmers. Water is drawn from River Nzoia. BIS gets mean annual
139
rainfall of 1620 mm and the mean monthly temperature ranges from 24.5°C to 31.5°C.
140
2.2. Data collection and analysis
141
Time series secondary data was collected for a period of five years (2012-2016). Data on total
142
yield per season, local crop price per season, cropped area, total command area, revenue collected,
143
expected revenue, cost of production, water supplied, pump speed and pumping hours was
144
obtained from records kept by irrigation scheme offices, NIB regional office and field survey.
145
Meteorological data was obtained from Ahero research station, West Kano weather station, Kenya
146
Meteorological Department (KMD) and NASA POWER centre. Key informant interviews,
147
observation and focus group discussion methods were used to collect data on farming practices,
148
cropping pattern, status of the irrigation systems and maintenance of the system.
149
Crop pattern, transplanting date and weather data was used in calculating crop water
150
requirement using CROPWAT8 software[14]. Performance of the irrigation schemes was evaluated
151
using standard performance indicators proposed by IPTRID [14]. The indicators were computed and
152
compared among the three schemes in each year. Eleven indicators were evaluated under water
153
supply, financial and agricultural productivity domains. Some of the recommended indicators
154
2.3. Computation of Performance indicators
156
The indicators were computed as shown in Table 2.
157
Table 2. IPTRID performance indicators
158
Performance
category Performance indicator Indicator equation
Water Supply
Relative water supply(RWS)
total annual volume of water supply total annual volume of crop irrigation demand
Relative irrigation supply (RIS)
total annual volume of irrigation supply total annual volume of crop water demand
Annual irrigation water supply per unit irrigated area (m3/ha)
Total annual volume of irrigation supply Total annual irrigated area
Annual irrigation water supply per unit command area (m3/ha)
Total annual volume of irrigation supply Total annual command area
Agricultural Productivity
Output per unit irrigated area(kg/ha)
Total annual agricultural production irrigated area
Output per unit command area (kg/ha)
Total annual agricultural production command area
Output per unit irrigation supply (kg/m3)
Total annual agricultural production total annual volume of irrigation suply
Output per unit water supply (kg/m3)
Total annual agricultural production total annual volume of water suply
Output per water consumed(kg/m3)
Total annual agricultural production total annual volume of crop water demand
Financial performance
Water fee collection performance (WFC)
Gross revenue collected Gross revenue invoiced
Average revenue per unit irrigation supply(KES/m3)
total annual revenue collected Total annual volume of irrigation supply
159
The computed indicators were compared amongst the schemes and performance threshold
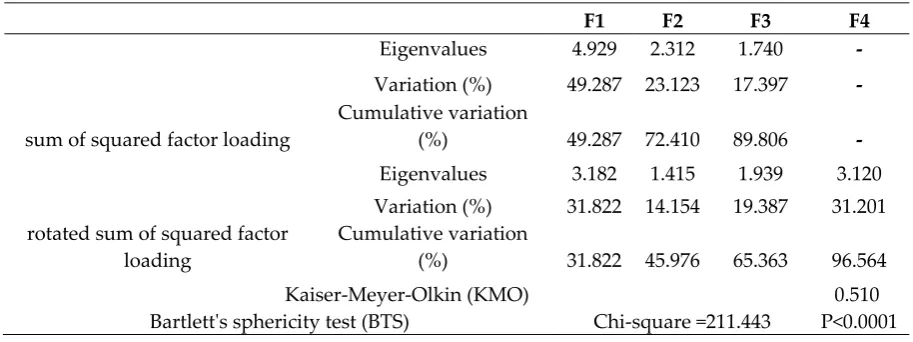
160
values presented in Table 3.
161
Table 3. Indicative benchmark values
162
Performance indicator Threshold values Reference
Relative water supply 1 [18]
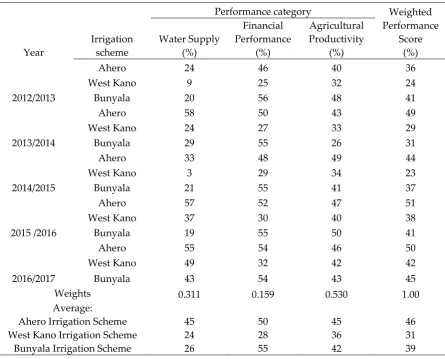
Relative irrigation supply ≤1 [18]
Annual irrigation water supply per unit irrigated area ≤700 mm [19]
Annual irrigation water supply per unit command area ≤700 mm [19]
Output per unit irrigated area 8800 kg/ha [20]
Output per unit command area 8800 kg/ha [20]
Output per unit water supply 2kg/m3 [21]
Output per water consumed 2kg/m3 [21]
Water fee collection performance 100% [14]
Average revenue per unit irrigation supply KES. 7.5 [22]
163
The overall scheme performance was determined by computing a composite indicator for each
164
domain; one for water delivery, one for financial performance and one for agricultural productivity.
165
The indicators were normalized using reference to target technique in order to convert them to the
166
same scale as follows:
167
𝐼 = (1)
168
Where; 𝐼 = normalised value of indicator q for scheme s at time t; 𝑥 = indicator value for
169
scheme s at time t; 𝑥 = benchmark indicator value.
170
Indicators were then tested for statistical correlation using Pearson to enable choice of only
171
indicators with low degree of correlation. The chosen indicators (ten) were then weighted and
172
aggregated using principal component analysis.
173
2.4. Principal Component Analysis (PCA)
174
This is a statistical multivariate technique which is used in weighting of indicators based on
175
eigenvalues and eigenvectors[23]. This method is objective and relies on the underlying data
176
structure to generate non-subjective weights which are less biased. Multicollinearity and presence of
177
outliers can be detected using this method [16]. Also, the analysis of multidimensional phenomenon
178
is simplified when variables are correlated using this method. Principal factors are generated
179
through linear combination of representative indicators which account for maximum variance and
180
are uncorrelated. Only principal factors with eigenvalues greater than one are considered since
181
eigenvalues below one account for insignificant variation [23]. The data was tested for suitability for
182
PCA using Kaiser-Meyer-Olklin (KMO) and Bartlett Test of Sphericity (BTS). The extracted factors
183
were rotated using orthogonal verimax method to achieve significant factors. The composite
184
indicators were then computed using rotated factor loadings and eigenvalues as follows [16].
185
CI = ∑ w I (2)
186
Where; wk= normalized indicator k for scheme s; CIst= composite indicator for performance for
187
scheme s at time t
188
w = ∑ ( ) ×
∑ (3)
189
Note that only principal factors (j=1…n) with Eigenvalues greater than 1 are included in the
190
calculation.
191
3. Results
192
3.1. Performance indicators
193
The computed performance indicators under the three performance criteria are presented as
194
follows.
195
3.1.1. Water supply performance
196
The indicators give a measure of water supply relative to demand of an individual irrigation
197
system. Water abundance or scarcity of water can be deduced from these indicators [18].The results
198
Table 4. Water supply indicators
200
Irrigation
Scheme Year
Relative water supply
Relative irrigation
supply
Annual irrigation supply per unit
Irrigated area (m3/ha)
Annual irrigation supply per unit Command area
(m3/ha)
Ahero
2012/2013 1.98 2.15 7,785 7,586
2013/204 1.14 0.86 5,837 5,487
2014/2015 1.45 1.31 6,217 5,409
2015/2016 1.28 0.86 5,294 4,847
2016/2017 1.24 0.68 5,487 4,389
West Kano
2012/2013 2.31 3.38 11,238 7,687
2013/2014 1.94 1.64 12,310 2,817
2014/2015 2.21 2.74 11,376 2,465
2015/2016 1.92 1.75 10,955 7,888
2016/2017 1.86 1.58 12,191 9,326
Bunyala
2012/2013 1.98 1.94 6,287 6,050
2013/2014 2.17 2.25 8,868 8,533
2014/2015 2.06 2.26 7,706 7,415
2015/2016 2.24 2.40 8,622 7,396
2016/2017 2.44 2.46 12,130 11,089
201
The relative irrigation supply (RIS) values varied from 0.68 to 3.38 during the study period.
202
Values above1 indicate abundance of water supply while below 1 indicate water deficit [24]. RIS
203
values close to 1 are recommended [24]. In addition, a value of 0.8 implies deficit irrigation is
204
practised to optimise crop production due to shortage in water supply. Supply of excess water in
205
Bunyala and West Kano is evident from the high values of RIS obtained during the study period. On
206
average, Ahero irrigation scheme recorded the least RIS values majority of which were below 1. This
207
means that deficit irrigation is practiced in Ahero irrigation scheme. Farmers have been trained on
208
water management and water saving. West Kano has the highest RIS of 3.38-1.68. This depicts excess
209
water supply and wastage. Farmers in West Kano irrigation scheme have not been trained on water
210
use and saving and believe the farms should be flooded all the time. The relative water supply
211
(RWS) varied between 1.14 and 2.44 for all the schemes which is above 1 indicating condition of
212
surplus water. Furthermore, these results could probably offer the answer to why excess drainage
213
water from Ahero is used to irrigate a block (Nyatini) which is unaccounted for. A lot of water goes
214
to waste in Bunyala and West Kano in the form of drainage water which could be utilised in
215
expanding the command area. Supply of excess water in West Kano adds up to extra cost of
216
pumping it back to Lake Victoria since the terrain does not allow for free gravity flow. The quantity
217
of water supplied per unit area varies with availability of water, climate, soil type, cropping
218
pattern, system conditions and system management [25].
219
The amount of water supplied per unit area is presented inTable 4.The annual irrigation water
220
supply per unit command area (ISCA) varied between 2,465 m3/ha (west Kano in 2014/2015) to 11,
221
089 m3/ha (Bunyala in 2016/2017). The determined ISCA are 4,389 m3/ha -7,586 m3/ha; 2,465 m3/ha
222
-9,326 m3/ha and 6,050 m3/ha -11,089 m3/ha for Ahero, West Kano and Bunyala Irrigation Schemes
223
respectively. These corresponds to depth of water supplied of 5.29m-7.79m,1.0m-1.23m and
224
0.63m-1.21m in Ahero, West Kano and Bunyala Irrigation Schemes respectively. According to FAO,
225
the average crop water need for paddy rice should be 0.45m-0.7m[19]. This means that Ahero
226
irrigation scheme supplies enough water to meet crop water needs while Bunyala and West Kano
227
irrigation schemes supply excess water. On average Bunyala has the highest ISCA of 8096 m3/ha
228
(ISIA) varied between 5,294 m3/ha (Ahero in 2015/2016) to 12,310 m3/ha (West Kano in2013/2014).
230
The calculated ISIA values for Ahero, West Kano and Bunyala irrigation schemes are 5,294 m3/ha
231
-7,787 m3/ha, 10,955 m3/ha -12,310 m3/ha and 6,287 m3/ha -12,130 m3/ha. On average West Kano has
232
the highest ISIA of 11,614 m3/ha while Ahero has the least value of 6,124 m3/ha. From the results, it
233
is evident that Ahero irrigation scheme experiences water scarcity compared to Bunyala and West
234
Kano which experience surplus supply of water. In another similar study, water supply in Mwea
235
was estimated to be 23,747 m3/ha for the period 2007/2008 [26]. Mwea irrigation scheme supplies too
236
much water in excess compared to the schemes in western Kenya.
237
3.1.2. Financial performance
238
The Financial performance indicator measures the efficiency with which the organization uses
239
resources to provide service to the farmers [27]. Water fee collection performance (WFC) values
240
obtained are 80-90%, 45-57%, and 92-97% for Ahero, West Kano and Bunyala irrigation schemes
241
respectively as shown in Figure 2.
242
243
Figure 2. Water fee collection indicator
244
According to [28]water fee collection value below 70% is considered unsatisfactory. Bunyala
245
has the highest average fee collection performance of 94% while West Kano has the least average
246
value of 51%. The ideal value recommended should be close to 100% [14]. Low value points out
247
unwillingness of farmers to pay water fee, poor organization of Irrigation Water Users Association
248
(IWUA), poor collection program and financial problems within the schemes. Bunyala is able to
249
sustain a value above 90% because of the well-organized farmer groups that are mandated with
250
mobilization of water fee. Also in Bunyala, the policy of water fee payment prior to ploughing is
251
strictly followed. Pricing of water is an economic aid to improving water allocation and sustainable
252
water utilization [29]. The water fee charged is KES.3100, KES.3640 and KES.4000 per acre in
253
Ahero, West Kano and Bunyala Irrigation Schemes respectively. The pricing is based on area
254
cropped and farming season and not the quantity of water consumed. This means that there is no
255
limit to the quantity of water that a farmer can use. This is a weakness since it is unsuitable in terms
256
of efficiency of water use and water conservation.
257
The average revenue per unit irrigation supply (ARIS) indicator accounts for every drop of
258
water supplied [30]. The values obtained varied from KES.0.79 to KES.1.26; KES.0.35 to KES.0.44 and
259
KES.0.79 to KES.1.45 per cubic meter in Ahero, Bunyala and West Kano irrigation schemes
260
respectively Figure 3.
261
262
0 20 40 60 80 100 120
2012/2013 2013/2014 2014/2015 2015/2016 2016/2017
Percent
year
Bunyala
West Kano
263
Figure 3. Average revenue per unit irrigation supply
264
This translates to 1 cubic meter of water being charged at an average of KES. 1.08, 0.4 and 1.11 in
265
Ahero, West Kano and Bunyala irrigation schemes respectively. This is equivalent to less than1$/m3.
266
These values are below the economic value of irrigation water of KES.7.54/m3 proposed byby [22] in
267
Ahero irrigation scheme. Bunyala is the leading irrigation scheme in terms of financial performance
268
indicator.
269
3.1.3. Agricultural productivity
270
Agricultural productivity gives the relationship between inputs and output. It is an indicator
271
of efficiency of crop production in terms of land used, amount of water used and the income
272
generated [31]. The indicators are grouped into land productivity and water productivity. Water
273
productivity relates amount of agricultural production to volume of applied or diverted. The output
274
per unit irrigation supply (OIS) ranges between 0.35 kg/m3 and1.03 kg/m3 in all the schemes Figure 4.
275
276
Figure 4. The output per unit irrigation supply
277
The average values for Ahero, West Kano and Bunyala irrigation schemes are 0.89 kg/m3, 0.47
278
kg/m3 and 0.60 kg/m3 respectively. West Kano and Bunyala with 0.47 and 0.60 kg/m3 have low water
279
productivity below the average global grain productivity ranging from 0.76 to 1.23 kg/m3 [27]. A
280
mean average water productivity of 0.1962kg/m3 was registered in Mwea irrigation scheme in
281
2007/2008 [26]. Ahero utilises water more efficiently compared to the others. The output per unit
282
0.00 0.50 1.00 1.50 2.00
2012/2013 2013/2014 2014/2015 2015/2016 2016/2017
ratio
year
Bunyala
West Kano
Ahero
2012/2013 2013/2014 2014/2015 2015/2016 2016/2017 0.00
0.20 0.40 0.60 0.80 1.00 1.20
Year
yield per
unit
volume of
water (kg/m
3)
Ahero
West Kano
water supply (OWS) puts into consideration the contribution of effective rainfall. The values vary
283
between 0.22 and 0.55 kg/m3 during the study period as shown in Figure 5.
284
285
Figure 5. Output per unit water supply
286
The highest (0.55 kg/m3) and the least (0.22 kg/m3) were obtained in Ahero in 2013/2014 and
287
Bunyala 2013/2014 respectively. On average Ahero has the highest value of 0.51 followed by
288
Bunyala (0.37) and the least is West Kano (0.36). The output per unit water consumed (OWC) varied
289
between 0.49 and 0.98kg/m3 as shown in Figure 6.
290
291
Figure 6. Output per unit water consumed
292
These values are within global rice water productivity range of 0.5-2kg/m3[21]. The highest
293
global values of rice water productivity of 1.77, 1.75 and 1.51kg/m3 have been reported in USA, Sri
294
Lanka and Spain respectively [21]. Ahero irrigation scheme is leading in terms of water productivity
295
while West Kano is the poorest. This means that Ahero irrigation scheme uses water more efficiently
296
than Bunyala and West Kano schemes. This is depicted by higher output per unit water consumed
297
than output per irrigation supply in Bunyala and West Kano insinuating inefficient water utilization.
298
According to[24], if output per unit water consumed is greater than output per irrigation supply,
299
some of irrigation water supplied is unproductive. The difference in water productivity is associated
300
with the difference in farming practices and water management amongst the schemes. In Ahero
301
irrigation scheme, some good agronomical practices have been adopted. Such practices include:
302
system of rice intensification (SRI), use of high yield hybrid seeds, use the right fertilizer (sulphate of
303
ammonia that lowers soil pH as opposed to urea) and high fertilizer application (an average of
304
175kg/acre). On the other hand, West Kano which is the least performing Irrigation Scheme in this
305
category suffers from; use of traditional seeds, and low fertilizer application (average 100kg/acre).
306
0.00 0.10 0.20 0.30 0.40 0.50 0.60
2012/2013 2013/2014 2014/2015 2015/2016 2016/2017
yield per
unit
volume of
water (kg/m
3)
year
Ahero
West Kano
Bunyala
0.00 0.10 0.20 0.30 0.40 0.50 0.60
2012/2013 2013/2014 2014/2015 2015/2016 2016/2017
yield per
unit
volume of
water (kg/m
3)
year
Ahero
West Kano
Land productivity indicators give a reflection of crop intensity[32]. The output per unit
307
command area (OCA) varies between 1260 kg/ha and 5285 kg/ha.
308
309
Figure 7. Output per unit command area
310
The highest value (5285 kg/ha) was registered in Ahero in 2015 while the least value (1260
311
kg/ha) was recorded in West Kano in 2013. The average values for Ahero, West Kano and Bunyala
312
are 4763 kg/ha, 2823 kg/ha and 4616 kg/ha respectively. High value indicates that there is intensive
313
irrigation. The sudden fall in output per command area in West Kano between 2012 and 2014 can be
314
attributed to collapse of Revolving Fund Committee. The committee was mandated with
315
responsibility of production and marketing in the whole scheme. Consequently, there was a decline
316
in production activities during that period associated with governance issues. From 2015 each block
317
in the scheme established production management structure which saw competition amongst the
318
blocks in terms of production activities hence an increase in production as well as the area under
319
crop. Bunyala irrigation scheme experienced hail stone in 2013 which shattered mature rice crop in
320
one of the phases (Muluwa phase 1). This contributed to a low harvest as depicted by sudden decline
321
in output per unit area in the scheme. The output per unit irrigated area (OIA) for all the schemes
322
varied from 3062 to 66160 kg/ha as shown in Figure 8. The values are comparable to global average
323
rice yield of 3800 kg/ha reported by [20].
324
325
Figure 8. Output per unit command area
326
The values are comparable to global average rice yield of 3800 kg/ha reported by [20]. However
327
,the highest value (6160 kg/ha) registered in Bunyala 2015 is way below the average produce yield in
328
Egypt of 8800 kg/ha which is the leading country in rice productivity within Nile basin [20]. In
329
0.00 1.00 2.00 3.00 4.00 5.00 6.00
2012/2013 2013/2014 2014/2015 2015/2016 2016/2017
yield per
unit
area *10
3(kg/ha)
year
Ahero
West Kano
Bunyala
0.00 1.00 2.00 3.00 4.00 5.00 6.00 7.00
2012/2013 2013/2014 2014/2015 2015/2016 2016/2017
yield per
unit
area *10
3(kg/ha)
year
Ahero
West Kano
2012-2013, there was strong sensitization on System of Rice Intensification (SRI) technology in Ahero
330
and West Kano. SRI is involve changes in plants, water soil and nutrients management aimed at
331
increasing productivity of rice under irrigation. Most farmers adopted SRI and this saw increase in
332
average yields from 4341 kg/ha to 5818 kg/ha and from 4765 kg/ha to 4943 kg/ha in West Kano and
333
Ahero Irrigation Schemes respectively. The output per irrigated area is higher than output per
334
command area in all the schemes indicating a cropping intensity of less than 1.
335
3.2. Estimation of overall scheme performance
336
Correlation analysis of the 11 indicators is presented in Table 5. RWS and RIS are strongly
337
positively correlated (r2= 0.950). This means that the indicators measure the same element. To avoid
338
double counting, only one of them can be used in computation of composite indicator. RIS is more
339
important because it relates irrigation water supplied to crop water demand.
340
Table 5. Correlation matrix Pearson (n)
341
Variables RWS RIS ISIA ISCA WFC ARIS OIA OCA OIS OWC OWS
RWS 1 0.950 0.711 0.458 -0.168 -0.425 -0.185 -0.305 -0.801 0.278 -0.855 RIS 0.950 1 0.648 0.455 -0.259 -0.457 -0.273 -0.292 -0.778 0.189 -0.845
ISIA 0.711 0.648 1 0.283 -0.645 -0.873 0.092 -0.570 -0.870 0.060 -0.701 ISCA 0.458 0.455 0.283 1 0.284 -0.029 -0.312 0.475 -0.432 -0.047 -0.471
WFC -0.168 -0.259 -0.645 0.284 1 0.889 -0.180 0.696 0.469 0.125 0.278
ARIS -0.425 -0.457 -0.873 -0.029 0.889 1 -0.125 0.662 0.723 0.109 0.514 OIA -0.185 -0.273 0.092 -0.312 -0.180 -0.125 1 0.156 0.375 0.741 0.553
OCA -0.305 -0.292 -0.570 0.475 0.696 0.662 0.156 1 0.566 0.301 0.480
OIS -0.801 -0.778 -0.870 -0.432 0.469 0.723 0.375 0.566 1 0.217 0.936 OWC 0.278 0.189 0.060 -0.047 0.125 0.109 0.741 0.301 0.217 1 0.245
OWS -0.855 -0.845 -0.701 -0.471 0.278 0.514 0.553 0.480 0.936 0.245 1
RWS-relative water supply; RIS-relative irrigation supply; ISIA- irrigation supply per unit irrigated area; ISCA-
342
irrigation supply per unit command area; WFC- water fee collection; ARIS- annual revenue per unit irrigation
343
supply; OIA- output per unit irrigated area; OCA- output per unit command area; OIS- output per unit
344
irrigation supply; OWC- output per unit water consumed; OWS- output per unit water supply
345
3.2.1. Principal Component Analysis results
346
The extracted principal factors, Kaiser-Meyer-Olkin (KMO) measure of sampling adequacy and
347
Bartlett's sphericity test (BTS) results are presented in Table 6.
348
Table 6. Extracted Principal component factors
349
F1 F2 F3 F4
sum of squared factor loading
Eigenvalues 4.929 2.312 1.740 - Variation (%) 49.287 23.123 17.397 - Cumulative variation
(%) 49.287 72.410 89.806 -
rotated sum of squared factor loading
Eigenvalues 3.182 1.415 1.939 3.120 Variation (%) 31.822 14.154 19.387 31.201
Cumulative variation
(%) 31.822 45.976 65.363 96.564
Kaiser-Meyer-Olkin (KMO) 0.510
350
According to [33], if KMO value is greater than 0.5 and BTS less than 0.05, the data is suitable
351
for PCA. In this study, KMO co-efficient of 0.510 is adequate and Bartlett's test is significant at
352
99% (P (< 0.0001). The weighted performance score per category of each scheme from 2012 to 2017 is
353
presented in Table 7.
354
Table 7. Weighted performance score for each category
355
Year
Irrigation scheme
Performance category Weighted Performance
Score (%) Water Supply
(%)
Financial Performance
(%)
Agricultural Productivity
(%)
2012/2013
Ahero 24 46 40 36
West Kano 9 25 32 24
Bunyala 20 56 48 41
2013/2014
Ahero 58 50 43 49
West Kano 24 27 33 29
Bunyala 29 55 26 31
2014/2015
Ahero 33 48 49 44
West Kano 3 29 34 23
Bunyala 21 55 41 37
2015 /2016
Ahero 57 52 47 51
West Kano 37 30 40 38
Bunyala 19 55 50 41
2016/2017
Ahero 55 54 46 50
West Kano 49 32 42 42
Bunyala 43 54 43 45
Weights 0.311 0.159 0.530 1.00
Average: Ahero Irrigation Scheme West Kano Irrigation Scheme
Bunyala Irrigation Scheme
45 24 26
50 28 55
45 36 42
46 31 39
356
The computed agricultural productivity was 36% -51% in Ahero, 23%-42% in West Kano and
357
26%-50% Bunyala irrigation scheme. Water supply performance in Ahero, West Kano and Bunyala
358
irrigation schemes varied from 24% to 58%, 3% to 49% and 19% to 43% respectively. Financial
359
performance varied from 46% to 54% in Ahero, 25% to32% in West Kano and 54%-56% in Bunyala
360
irrigation scheme. Generally, financial performance category is the leading while water supply is the
361
least performing category. Ahero irrigation scheme is leading in both agricultural productivity and
362
water supply performance while Bunyala irrigation scheme is leading in financial performance.
363
Bunyala and West Kano should therefore adopt the best agronomical, farming and water
364
management practices from Ahero irrigation scheme. Best practices in financial management in
365
irrigation schemes should be adopted from Bunyala irrigation scheme. An average overall
366
performance efficiency of 46%, 39% and 31% was obtained in Ahero, Bunyala and West Kano
367
irrigation schemes respectively.
368
The water supply, finance and agricultural productivity categories have a relative weight of
369
0.311, 0.159 and 0.530 respectively. Agricultural productivity is the most important category having
370
an effect of 53% on the overall performance. Therefore, a lot of focus should be put on adopting right
371
farming technologies such as use of systematic of rice intensification (SRI) instead of flooding
372
method, use of high yield seeds, timely and application of right amount of agro-inputs. Only two
373
in all the schemes on operation and maintenance expenses to enable in-depth financial evaluation.
375
This explains why a low weight was assigned to financial performance category. The comparison of
376
overall performance of each scheme is presented in Figure 9.
377
378
379
Figure 9. Comparison of performance score
380
The performance in irrigation schemes has been fluctuating with time. Generally, the trend
381
show that performance in all the three irrigation schemes has been increasing at a reducing rate. The
382
overall performance in Ahero, West Kano and Bunyala irrigation schemes varied from 35% to 51%;
383
31% to45% and 23% to 42% respectively. The performance in all the schemes is very low. West
384
Kano irrigation scheme experienced a fall in performance in 2014 due to collapse of Revolving Fund
385
Committee. The committee was mandated with responsibility of production and marketing in the
386
whole scheme. The establishment of production management structure which created competition
387
amongst the blocks in terms of production increased performance from 2015. The sudden decline in
388
performance in Bunyala in 2013 was due to hail stone that shattered mature rice crop in one of the
389
phases (Muluwa phase 1).
390
4. Discussion
391
The level of performance of irrigation schemes can be sufficiently measured using performance
392
indicators and Principal Component Analysis method. The results of this study show that
393
performance of public irrigation schemes in western Kenya is very poor (below 50%) compared to
394
global benchmark values. This depicts inefficient use of available resources. The average
395
performance in terms of water supply, financial performance and agricultural productivity of
396
irrigation schemes in western Kenya is 32%, 45% and 41% respectively. Water supply performance is
397
the area that needs immediate intervention by scheme managers and policy makers. The inefficient
398
water use depicted by very low water supply performance (32%) is a threat to our scarce water
399
resources. The trend is worrying since water is a scarce resource. Moreover, Kenya is a water scarce
400
country with only 647 cubic meters per capita per annum of renewable freshwater which is way
401
below international acceptable levels of 1,000 cubic meters per capita per annum [2].
402
Promoting efficient water use is a step towards achieving sustainable agricultural development.
403
Intervention measures geared towards increasing water use efficiency should be adopted. These
404
include: canal lining; systematic of rice intensification (SRI) instead of flooding method; installation
405
on water monitoring devices; proper irrigation scheduling; change in water costing system from
406
area-based to volume-based system to discourage wastage. The low financial performance is a
407
reflection of poor revenue collection coupled with low water fee charges in irrigation sector. This can
408
be improved by increasing the revenue collection to almost 100% and increasing the water fees
409
charged. Initiating water fee collection by water users association as is practiced in Bunyala can
410
also improve financial performance. In addition, introduction of public-private partnership and use
411
of incentive based fee collection strategy can also improve financial performance [13]. The current
412
2011 2012 2013 2014 2015 2016 2017
0 10 20 30 40 50 60
year
performance
score (%)
AIS
WKIS
water fee for all the schemes is too low to sustain the schemes necessitating government budgetary
413
allocation through National Irrigation Board (NIB). The schemes are not financially self-sustainable.
414
Despite contributing to 53 %, agricultural productivity (water and land productivity) is very
415
low at 39% of the target values. This makes the opportunity cost forgone in utilizing water in
416
irrigation sector other than other sectors of the economy such as manufacturing not worthwhile.
417
More efforts should therefore be put in this area if higher performance levels are to be realised.
418
Better farming technology that focuses on intensive farming and efficient resource use should be
419
embraced. System of rice intensification irrigation technology has been introduced to these schemes
420
but need to be fully adopted. Ahero irrigation scheme is the benchmark for rice farming in western
421
Kenya. Bunyala and West Kano irrigation schemes should therefore copy the best operation and
422
management practices to improve their performance.
423
5. Conclusions
424
Combination of benchmarking and Principal Component Analysis forms a powerful tool for
425
evaluating efficiency of irrigation schemes. Benchmarking was applied to investigate the potential
426
factors that can influence performance of the irrigation scheme. The computed performance
427
indicators provided information on the areas of shortcomings in the operation of the irrigation
428
schemes. Application of benchmarking in evaluating performance of irrigation schemes provides
429
individual indicator comparison without quantifying the overall performance of the irrigation
430
scheme. This cannot sufficiently give a measure of the level of performance an individual irrigation
431
scheme in comparison to the others. Computation of overall performance score was achieved by
432
combining benchmarking and Principal Component Analysis. Principal component analysis
433
provided numerical quantification of the best performing irrigation scheme. Combination of
434
benchmarking indicators and Principal Component Analysis provided information on best practices
435
and techniques in irrigation that can enhance irrigation efficiency. The less efficient irrigation
436
schemes (Bunyala and West Kano) can enhance their performance by borrowing the best operation
437
and management practices from Ahero irrigation scheme.
438
The performance of public irrigation schemes in western Kenya is very poor and measures on
439
improving performance are needed. The irrigation managers and policy makers can use this
440
information in championing for efficient utilisation of water through intensive irrigation. Further
441
farming practices that minimise use of inputs and maximize outputs should be adopted.
442
Improvement should focus on adoption of gravity-fed irrigation system instead of pumped system
443
which is very expensive to operate and maintain. Modernization of operation and management of
444
the scheme will enable routine monitoring and evaluation to check if the set targets have been
445
achieved. The schemes need to adopt a systematic routine collection and management of data to aid
446
in monitoring and evaluation of performance. The study could provide an insight to other schemes
447
in Kenya to adopt benchmarking as a tool towards improving performance.
448
Author Contributions: Faith M. Muema designed the methodology, analyzed data, interpreted the results and
449
prepared the manuscript. Patrick G. Home conceived the research idea. James M. Raude assisted in obtaining
450
the datasets. Patrick G. Home and James M. Raude guided in analysis and correction of the initial draft.
451
Acknowledgments: The authors are grateful to National Irrigation Board (NIB) for granting access to western
452
Kenya irrigation schemes. We are also grateful to Kenya Meteorological Department (KMD) and the
453
management of Ahero, Bunyala and West Kano irrigation schemes for providing historical data sets for this
454
study.
455
Conflicts of Interest: The authors have no conflict of interest.
456
457
References
458
(1) Yildirim, M.; Cakmak, B.; Gokalp, Z. Benchmarking and Assessment of Irrigation Management
459
(2) Krhoda, G. O. Kenya National Water Development Report. 2006, 1–244.
461
(3) Ngenoh, E.; Kirui, L. K.; Mutai, B. K.; Maina, M. C.; Koech, W.; Victoria, L. Economic Determinants of
462
the Performance of Public Irrigation Schemes in Kenya. J. Dev. Agric. Econ. 2015, 7 (10), 344–352,
463
http://dx.doi.org/10.5897/JDAE2015.0676/.
464
(4) Kenya National Bureau of Statistics (KNBS). Kenya Population Census Report; 2010.
465
(5) Glantz, M. H.; Ramasamy, R. G. S. Coping with a Changing Climate : Considerations for
466
Adaptation and Mitigation in Agriculture; FAO: Rome,Italy, 2009.
467
(6) Fernández Cirelli, A.; Arumí, J. L.; Rivera, D.; Boochs, P. W. Environmental Effects of Irrigation in Arid
468
and Semi-Arid Regions. Chil. J. Agric. Res.2009, 69, 27–40.
469
(7) GoK. National Water Master Plan 2030 in the Republic of Kenya Final Report Volume -v Sectoral Report (2/3);
470
2013.
471
(8) Ngigi, S. N. Review of Irrigation Development in Kenya. In The changing face of irrigation in Kenya:
472
Opportunities for anticipating change in eastern and southern Africa.; Blank, H. G., Mutero, C. M.,
473
Murray-Rust, H., Eds.; International Water Management Institute (IWMI): Colombo, Sri Lanka, 2002;
474
Vol. xiv, pp 35–54.
475
(9) GoK. Agricultural Sector Development Strategy; 2010-2020; 2015.
476
(10) Gomo, T.; Senzanje, A.; Mudhara, M.; Dhavu, K. Assessing The Performance of Smallholder Irrigation
477
and Deriving Best Management Practices In South Africa. Irrig. Drain. 2014, 63 (4), 419–429,
478
http://dx.doi.org/10.1002/ird.1815.
479
(11) Hassen, Y. K. Asessment of Small Scale Irrigation Using Comparative Performance Indicators on Two
480
Selected Schemes in Upper Awash River Valley.Msc, Alemaya University School of Graduate Studies
481
Assessment, 2004.
482
(12) Rani, S. Y. R.; Venkateswarao, B.; Sreekanth, S. Modernization of an Existing Irrigation Project by
483
Perfrmance Evaluation Using Performance Indicators. Int. eJournal Math. Eng.2011, 141, ISBN 1273–
484
1292.
485
(13) Phadnis, S. S.; Kulshrestha, M. Evaluation for Measuring Irrigation Service Performance Using a
486
Scorecard Framework. Irrig. Drain.2013, 62 (2), 181–192, http://dx.doi.org/10.1002/ird.1725.
487
(14) Malano, H.; Burton, M.; Makin, I. Guidelines For Benchmarking Performance in the Irrigation and Drainage
488
Sector, 1st ed.; International Programme for Technology and Research in Irrigation and Drainage
489
(IPTRID) Knowledge Synthesis Report No. 5.; FAO: Rome,Italy, 2001, ISBN 9251046182.
490
(15) Malano, H.; Hungspreug, S.; Plantey, J.; Bos, M. G.; Vlotman, W. F.; Molden, D.; Burton, M.
491
Benchmarking Of Irrigation And Drainage Projects; International Commission On Irrigation And Drainage
492
(ICID): New Delhi, India,2004.
493
(16) Rodrı´guez-Dı´azz, J. A.; Camacho-Poyato a, E.; Lo ´pez-Luque, R.; Pe ´rez-Urrestarazu, L.
494
Benchmarking and Multivariate Data Analysis Techniques for Improving the Efficiency of Irrigation
495
Districts: An Application in Spain. Agric. Syst. 2008, 96 (1–3), 250–259,
496
http://dx.doi.org/10.1016/J.AGSY.2007.07.010.
497
(17) Kipkorir, E. C. Rice Productivity , Water and Sanitation Baseline Survey Report Western Kenya Rice Irrigation
498
Schemes; 2018., http://dx.doi.org/10.13140/RG.2.2.35997.82409.
499
(18) Bos, M. G.; Burton, M. A.; Molden, D. J. Irrigation and Drainage Performance Assessment Practical
500
Guidelines; CABI Publishing: Cambridge, USA, 2005, ISBN 0851999670.
501
(19) Brouwer, C., K. Prins, Heibloem, M. Irrigation Water Management: Irrigation Scheduling; Food and
502
(20) Bastiaanssen, W.; Perry, C. Agricultural Water Use & Water Productivity in the Large Scale
504
Irrigation(LSI) Schemes of the Nile Basin; 2009.
505
(21) Bastiaanssen, W. G. M.; Steduto, P. The Water Productivity Score (WPS) at Global and Regional Level:
506
Methodology and First Results from Remote Sensing Measurements of Wheat, Rice and Maize. Sci.
507
Total Environ.2017, 575, 595–611,http://dx.doi.org/10.1016/j.scitotenv.2016.09.032.
508
(22) Omondi, S. O. Economic Valuatio of Irrigation Water in Ahero Irrigation Scheme. Master of science,
509
University of Nairobi, Kenya, 2014.
510
(23) OECD. Handbook on Constructing Composite Indicators: Methodology and User Guide; OECD Publishing:
511
Paris, France, 2008.
512
(24) Molden, D.; Sakthivadivel, R.; Perry, C. J.; De Fraiture, C.; Kloezen, W. H. Indicators for Comparing
513
Performance of Irrigated Agricultural Systems; 1998, ISBN 9290903562.
514
(25) INDIA, G. O. M. Report on Benchmarking of Irrigation Projects in Maharashtra; 2005.
515
(26) Obiero, O. B. P. Analysis of Economic Efficiency of Irrigation Water-Use in Mwea Irrigation Scheme,
516
Kirinyaga District, Kenya. Master of science, Kenyatta University,Kenya, 2010.
517
(27) Balderama, O. F.; Bareng, J. L. R.; Alejo, L. A. Benchmarking for Performance Assessment of Irrigation
518
Schemes : The Case of National Irrigation Systems and Small Water Impounding Projects in Cagayan
519
River Basin. 2014, No. Icid, 6–10.
520
(28) Borgia, C.; García-Bolaños, M.; Li, T.; Gómez-Macpherson, H.; Comas, J.; Connor, D.; Mateos, L.
521
Benchmarking for Performance Assessment of Small and Large Irrigation Schemes along the Senegal
522
Valley in Mauritania. Agric. Water Manag.2013, 121, 19–26,http://dx.doi.org/10.1016/j.agwat.2013.01.002.
523
(29) Kuşçu, H. Benchmarking Performance Assessment of Irrigation Water Management in a River Basin:
524
Case Study of the Susurluk River Basin, Turkey. African J. Bus. Manag. 2012, 6 (8), 2848–2859,
525
http://dx.doi.org/10.5897/AJBM11.1030.
526
(30) INDIA, G. O. M. Benchmarking of Irrigation Systems in Maharashtra State 2010-11; 2012.
527
(31) De Alwis, S. M. D. L. K.; Wijesekara, N. T. S. Comparison of Performance Assessment Indicators for
528
Evaluation of Irrigation Scheme Performances in Sri Lanka. 2011, XXXXIV (03), 39–50.
529
(32) Mchele, A. R. Perfomance of Rehabilitated Irrigation Systems:A Case of Igomelo Irrigation Scheme.
530
Master of science, 2011, Sokoine University of Agriculture, Tanzania.
531
(33) Kalantari, K. h. Processing and Analysis of Economic Data in Social Research. Publ. Consult. Eng. Landsc.
532