© The Author(s) 2018. Published by Oxford University Press on behalf of the Annals of Botany Company. This is an Open Access article distributed under the terms of the Creative Commons Attribution License (http://creativecommons.org/licenses/
by/4.0/), which permits unrestricted reuse, distribution, and reproduction in any medium, provided the original work is properly cited.
VIEWPOINT
Genomic index selection provides a pragmatic framework for setting and
refining multi-objective breeding targets in
Miscanthus
Gancho T. Slavov1,*, Christopher L. Davey2, Maurice Bosch2, Paul R. H. Robson2, Iain S. Donnison2 and Ian J. Mackay3
1Computational & Analytical Sciences Department, Rothamsted Research, Harpenden, Hertfordshire AL5 2JQ, UK, 2Institute of Biological, Environmental and Rural Sciences, Aberystwyth University, Aberystwyth SY23 3DA, UK and
3IMPlant Consultancy Limited, Chelmsford CM2 6HA, UK * For correspondence. E-mail: [email protected]
Received: 1 May 2018 Returned for revision: 23 July 2018 Editorial decision: 20 September 2018 Accepted: 2 October 2018
• Background Miscanthus has potential as a biomass crop but the development of varieties that are consistently superior to the natural hybrid M. × giganteus has been challenging, presumably because of strong G × E interactions and poor knowledge of the complex genetic architectures of traits underlying biomass productivity and climatic adaptation. While linkage and association mapping studies are starting to generate long lists of candidate regions and even individual genes, it seems unlikely that this information can be translated into effective marker-assisted selection for the needs of breeding programmes. Genomic selection has emerged as a viable alternative, and prediction accuracies are moderate across a range of phenological and morphometric traits in Miscanthus, though relatively low for biomass yield per se.
• Methods We have previously proposed a combination of index selection and genomic prediction as a way of overcoming the limitations imposed by the inherent complexity of biomass yield. Here we extend this approach and illustrate its potential to achieve multiple breeding targets simultaneously, in the absence of a priori knowledge about their relative economic importance, while also monitoring correlated selection responses for non-target traits. We evaluate two hypothetical scenarios of increasing biomass yield by 20 % within a single round of selection. In the first scenario, this is achieved in combination with delaying flowering by 44 d (roughly 20 %), whereas, in the second, increased yield is targeted jointly with reduced lignin (–5 %) and increased cellulose (+5 %) content, relative to current average levels in the breeding population.
• Key Results In both scenarios, the objectives were achieved efficiently (selection intensities corresponding to keeping the best 20 and 4 % of genotypes, respectively). However, the outcomes were strikingly different in terms of correlated responses, and the relative economic values (i.e. value per unit of change in each trait compared with that for biomass yield) of secondary traits included in selection indices varied considerably.
• Conclusions Although these calculations rely on multiple assumptions, they highlight the need to evaluate breeding objectives and explicitly consider correlated responses in silico, prior to committing extensive resources. The proposed approach is broadly applicable for this purpose and can readily incorporate high-throughput phenotyping data as part of integrated breeding platforms.
Keywords: Selection indices, genomic selection, breeding objectives, economic values, correlated responses,
Miscanthus sinensis.
SIMULTANEOUS IMPROVEMENTS IN MULTIPLE
TRAITS ARE NEEDED FOR MISCANTHUS TO BECOME
A WIDELY GROWN BIOMASS CROP
Despite relatively poor uptake so far, the potential of Miscanthus as a biomass crop is high, and many technical barriers to its
broader adoption have largely been resolved (Clifton‐Brown
et al., 2017). However, several major challenges remain, includ-ing the need to reduce the cost of establishment further and to develop varieties with consistently higher yields than the sterile triploid M. × giganteus clones, which are currently the only
commercially available option. The potential for Miscanthus
as a biomass crop in Europe, the USA and in Asia has been
discussed over the last two decades, and several studies high-light the need for cold and drought tolerance, in particular, to be improved (Lewandowski et al., 2000; Heaton et al., 2004;
Richter et al., 2008; Chung and Kim, 2012; Liu et al., 2012). Improvements in abiotic stress tolerance are also needed to mitigate the potential impact of climate change and to allow biomass crops to generate high yields on marginal lands. For example, Hastings et al. (2009) predicted an 80 % decline in energy production from M. × giganteus due to a reduction in seasonal water availability due to climate change in Europe up to 2080. Improved tolerance to single or combinations of
abi-otic stresses will allow Miscanthus to be grown increasingly
on areas of marginal land (Stavridou et al., 2017, 2019), thus
preventing potential competition with food crops (Valentine
et al., 2012).
Although significant progress has been made already, much remains to be learned about the abiotic stress resilience of Miscanthus, which will be a crucial factor for its successful deployment in a broad range of environments. Unusually for
a C4 crop, Miscanthus exhibits cold-tolerant photosynthesis
(Naidu et al., 2003; Long and Spence, 2013), although there remains significant potential to increase yield by up to 25 % by
extending the season through improved cold tolerance (Farrell
et al., 2006). When a small number of chilling-tolerant and chilling-sensitive genotypes were compared under field con-ditions, there appeared to be a trade-off between high
photo-synthesis and chilling tolerance. The commercial clone M. ×
giganteus displayed both early-season chilling tolerance and, later in the season, high photosynthesis more typical of the chilling-sensitive genotypes (Fonteyne et al., 2018). Drought
tolerance is another major opportunity for improvement as M.
× giganteus is reported to have poor water-use efficiency, and
yield is strongly impacted by water stress (Clifton-Brown and
Lewandowski, 2000; Ings et al., 2013). However, the genus comprises highly diverse species that have developed across different habitats in Asia (Clifton-Brown et al., 2008; Sacks
et al., 2013), and such diversity may hold the key to overcoming yield limitations due to abiotic stress. Performance under water stress treatment has been related to meteorological data from the site of origin (Weng, 1993; Malinowska et al., 2017) and illustrates the potential to combine the useful variation within
diverse Miscanthus ecotypes to produce superior germplasm.
Finally, there is also tremendous potential for manipulating biomass quality, particularly cell wall structure and composi-tion (Slavov et al., 2013a; Bhatia et al., 2017). Given the com-plex nature of biomass recalcitrance to deconstruction, dictated by the relative abundances and interactions of the cell wall components within the cell wall matrix, it is difficult to predict recalcitrance based on single compositional traits. Nevertheless, lignin is commonly regarded as one of the main factors imped-ing saccharification by enzymatic hydrolysis as it prevents enzymes accessing the hemicellulose and cellulose in plant cell walls (Zeng et al., 2014). Indeed, reduction in lignin content by various methods resulted in improved biomass digestibility and reduced recalcitrance (Welker et al., 2015). Increasing cel-lulose content represents another potential breeding target for improving biomass quality as this would increase the
propor-tion of easily fermentable glucose monosaccharides (Furtado
et al., 2014; Bhatia et al., 2017). It is important to note that biomass quality parameters depend on the intended technology for lignocellulose conversion (van der Weijde et al., 2017b; da Costa et al., 2019). For instance, while a low lignin content may improve enzymatic conversion, its high energy density means that a high lignin content is favourable for thermochemical con-version (Welker et al., 2015). Other biomass quality parameters that influence thermochemical conversion (such as combustion, gasification and pyrolysis) include ash, mineral and moisture content (Tanger et al., 2013). Interestingly, previous studies have shown organ-specific abundance, distribution, composi-tion and ornamentacomposi-tion of cell wall polymers (e.g. acetylacomposi-tion, arabinosylation and feruloylation of arabinoxylans), affecting sugar release differently (da Costa et al., 2014, 2017). Hence, besides targeting cell wall features directly, biomass quality
can possibly also be manipulated by allometry (i.e. the relative proportions of leaf vs. stem biomass) in order to reduce recal-citrance to bioconversion or increase the biomass properties for thermochemical conversion. Furthermore, drought treatment also impacts cell wall composition and, consequently, how the biomass is processed. For example, in a study of 50 diverse Miscanthus genotypes, drought tolerance and cell wall compo-sition were only weakly correlated, suggesting that the
poten-tial exists for both traits to be improved independently (van
der Weijde et al., 2017a). More generally, future domestica-tion and breeding efforts are likely to target the joint improve-ment of biomass yield, cell wall composition and abiotic stress resilience.
LINKAGE AND ASSOCIATION MAPPING STUDIES CAN PROVIDE INSTRUCTIVE CASE STUDIES, BUT ARE UNLIKELY TO TRANSFORM BREEDING APPROACHES Recent advances in sequencing and genotyping technology (Davey et al., 2011) have made high-density linkage and associa-tion mapping studies affordable across a range of food (Buckler
et al., 2009; Bentley et al., 2014) and energy crops (Evans et al., 2014; Hallingback et al., 2016), including Miscanthus (Slavov
et al., 2014; Gifford et al., 2015; Clark et al., 2016; Dong et al.,
2018). While these studies have identified numerous
candi-date regions and individual genes, it seems unlikely that this information can be translated into effective marker-assisted selection (MAS) for the needs of breeding programmes. One reason for this is that mapping populations developed previ-ously for Miscanthus (typically n = 100–200) were too small (Cockram and Mackay, 2018) relative to the presumed high complexity of trait genetic architectures. Consequently, many of the associations and quantitative trait loci (QTLs) detected so far are likely to be false positives [i.e. because low statis-tical power tends also to result in higher rates of false posi-tives (Button et al., 2013)], while the naïve effect size estimates of all detected QTLs/associations are inflated by as much as an order of magnitude (Beavis, 1998; Allison et al., 2002).
Although several larger mapping populations (n = 500–1000)
have recently become available for Miscanthus (G. Slavov and
C. Davey, unpubl. data; P. Robson, unpubl. data; L. Clark and E. Sacks, pers. comm.), statistical power will remain extremely low for the foreseeable future (Visscher et al., 2017). Another, less tractable problem is that combining favourable alleles even for as few as 30 unlinked QTLs is a major logistical challenge (Bernardo, 2016), while some quantitative traits may be con-trolled by thousands, or even tens of thousands, of loci (Boyle
et al., 2017; Visscher et al., 2017). Thus, MAS may be a viable breeding approach for traits that are controlled by major loci (e.g. disease resistance), but probably not for most quantitative traits (Bernardo, 2016).
Genomic prediction [also referred to as genomic selection (GS): trait prediction from a genome-wide set of markers, with-out necessarily testing for significant marker–trait associations (Meuwissen et al., 2001)] currently appears to be an effective alternative to MAS, although relatively few examples of the successful implementation of GS in actual plant breeding
pro-grammes have been published (Bernardo, 2016). Based on a
pilot-scale study in a population of 138 M. sinensis genotypes,
the accuracy of genomic prediction was moderate across a range of phenological and morphometric traits, though very low for biomass yield per se (Slavov et al., 2014). In a recent follow-up study (Davey et al., 2017), we demonstrated that this limitation can easily be overcome by capturing the genetic correlations between biomass yield and individual phenological and mor-phometric traits. Here we extend this approach and illustrate its potential to achieve multiple breeding targets simultaneously, in the absence of a priori knowledge about their relative eco-nomic importance, while also monitoring correlated selection responses for non-target traits.
GENOMIC INDEX SELECTION CAN BE USED TO
EVALUATE BREEDING TARGETS IN SILICO
Methodology
Dating back nearly a century (Smith, 1936), the idea of a selec-tion index is to combine all available informaselec-tion about the genetic worth (i.e. breeding value) of an individual, includ-ing information about its relatives and/or multiple traits with different heritabilities and genetic/environmental correlations (Falconer, 1989). Briefly, to construct a selection index, one needs to have estimates of the phenotypic and genetic vari-ance–covariance matrices, as well as a quantitative measure of the relative importance of different traits (i.e. economic values). The index (I) is a linear combination of phenotypic trait values and is calculated for each individual (line or genotype) as:
I=b X´ (1)
where b´ is a transposed n × 1 vector of weighting factors and X an n × 1 vector of phenotypic measurements for n traits.
The weighting factors for the index are obtained by solving:
b=P Ga–1 (2)
where P–1 is the inverse of the n × n phenotypic
variance–covar-iance matrix, G is the n × n additive genetic variance–covari-ance matrix and a is an n × 1 vector of economic values per unit of change for each trait. Selection for the index is then expected to be more efficient than selecting for individual traits in suc-cessive generations (tandem selection) or independently culling individuals based on standards for each trait.
In a recent study (Davey et al., 2017), we demonstrated that selection indices targeting biomass yield can effectively exploit the genetic correlations of this highly composite trait with individual phenological and morphometric traits to increase the accuracy of genomic prediction by an order of magnitude, while also increasing the expected response relative to selection for biomass yield alone, as expected from quantitative genetics theory (Falconer, 1989; Mackay et al., 2015). To achieve this, we assigned an economic value of 1 to biomass yield and 0 to all other traits included in any given selection index (Mackay et al.,
2015). This approach was effective for improving the accuracy
of genomic prediction, but does not fully exploit the conceptual strength of index selection (i.e. simultaneous improvement of multiple valuable traits). Because the objective assignment of economic values is challenging for many traits, a potentially
more useful alternative approach is to specify desired selection gains for all n or a sub-set of m traits (Yamada et al., 1975). In the simple case of n = m, and when the traits of breeding inter-est are the same as the traits that are measured, the weighting factors for the index can be calculated as:
b=G Q–1 (3)
where Q is an n × 1 vector of desired genetic gains and G–1
is the inverse of the n × n additive genetic variance–covari-ance matrix, which is typically estimated based on quantitative
genetic analyses of phenotypic data from relatives (Falconer,
1989). More importantly, this approach can also be applied
when the breeder is only able to set desired genetic gains for a sub-set of the traits of interest (e.g. because of insufficient information to inform decisions). In that case (n> m), after simplifying equation 13 of Yamada et al. (1975) by setting the relationship matrix to unity (i.e. assuming that selection candi-dates are phenotyped directly), the n weighting factors for the selection index are calculated as:
b=P G–1 * Géëê *´P G–1 *ûúù–1Q (4)
where Q is an m × 1 vector of desired genetic gains, G* is a non-invertible n × m matrix, which is derived from G by only keeping the m columns for the traits represented in Q, and P–1 is
the inverse of the n × n phenotypic variance–covariance matrix. Rearranging eqn (2), economic values corresponding to the desired genetic gains in Q can then be calculated as:
a=G Pb–1 (5)
Thus, breeders are given the option of assessing the changes in relative economic values resulting from the choice of desired genetic gains, as well as to evaluate the n × 1 vector of corre-lated responses (Q*) for traits for which desired genetic gains had not been specified by calculating:
Q* =Gb (6)
Finally, assuming that the intensity of selection (i) required to achieve the desired genetic gains is equal to the standard deviation of the selection index σI [i.e. the breeding objective is to be achieved in a single generation, Yamada et al. (1975)], i can be calculated as:
i=sI= (b Pb´ ) (7)
Illustration through two genomic index selection scenarios in
Miscanthus
The framework described above (see ‘Methodology’) allows breeders to assess different multi-objective selection scenarios in silico, without complete knowledge about the economic values of target traits. For example, eqns (4)–(6) make it pos-sible to set breeding targets for only a small sub-set of traits
(i.e. those for which desired genetic changes can be justified), evaluate the economic values associated with setting these tar-gets and assess correlated responses for other traits of interest. Furthermore, if breeders are not satisfied with some of the eco-nomic values and/or expected correlated responses, selection targets can be modified iteratively until an acceptable solution is found.
We illustrate the flexibility of this approach through two
hypothetical scenarios based on real data from Miscanthus
sinensis (Slavov et al., 2013b, 2014; Davey et al., 2017) and variance–covariance matrices estimated using molecular mark-ers. In addition to dry biomass yield (DryMatter) and moisture content, the traits of interest include two phenological, nine morphometric (i.e. excluding the less easily interpretable com-bined StatureCategory trait used in earlier studies) and three
cell wall composition measurements (Table 1). The primary
breeding objective in both scenarios was to increase dry bio-mass yield by 20 % relative to the mean for the current popula-tion. The first scenario (S1) also aimed to delay flowering by 44 d (approx. 20 %) to better take advantage of the growing season (Jensen et al., 2011), while also exploiting the genetic correla-tion (r = 0.19) between flowering time and yield (Slavov et al., 2014). In contrast, the second scenario (S2) targeted changes in cell wall composition (i.e. a 5 % reduction in lignin and a 5 % increase in cellulose), without aiming to alter phenology. These cell wall composition changes may be expected to increase the yields of biomass conversion to ethanol, with the reduction in lignin alone expected to result in roughly 5 % higher ethanol yields per unit of dry biomass (da Costa et al., 2014).
We made slight modifications to the approach used to esti-mate genetic and phenotypic variance–covariance matrices
in our previous study (Davey et al., 2017), in which selection indices were used primarily as a way to increase the genomic predictive ability of dry biomass yield. The additive genetic variance–covariance matrix (G) for the 16 traits was estimated from approx. 53 000 single-nucleotide variants generated using a RAD-Seq genotyping approach and alignments to the Sorghum bicolor genome (Slavov et al., 2014). This was done
by fitting a multi-trait GBLUP model (Jia and Jannink, 2012)
using the MTM R package (Cuevas et al., 2017) with
unstruc-tured covariance matrices to the best linear unbiased estimator (BLUE) values for the 16 traits. Because the emphasis of this
analysis was the estimation of G from a genome-wide set of
markers, we used BLUEs instead of best linear unbiased pre-dictors (BLUPs), which were preferred in our previous studies (Slavov et al., 2014; Davey et al., 2017), to avoid the
undesir-able shrinkage and consequent underestimation of G
associ-ated with the BLUP approach (Garrick et al., 2009). Following a burn-in of 1000 iterations, we ran 10 000 iterations of the Gibbs sampler in MTM, keeping every fifth iteration (thin = 5) to reduce auto-correlation. The phenotypic
variance–covari-ance matrix (P) was calculated as the sum of the genetic and
residual variance–covariance matrices estimated using MTM (Supplementary Data File S1). Weighting factors for the selec-tion indices corresponding to each scenario were then calcu-lated using eqn 4, while economic values, expected correcalcu-lated responses and selection intensities were estimated using eqns (5), (6) and (7) respectively. All input data sets and scripts for these analyses are available at github.com/ChrisDaveyCymru/ genomic_index_selection.
The desired genetic gains in both scenarios were achievable within a single round of selection with relatively low intensity
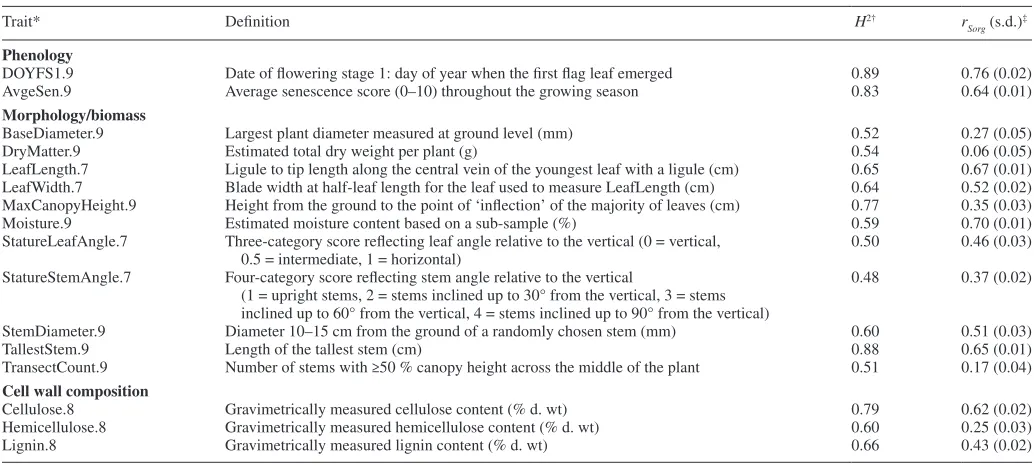
Table 1. Definitions, broad-sense heritabilities and genomic predictive abilities for 16 traits measured in 138 M. sinensis genotypes
Trait* Definition H2† r
Sorg (s.d.)‡ Phenology
DOYFS1.9 Date of flowering stage 1: day of year when the first flag leaf emerged 0.89 0.76 (0.02) AvgeSen.9 Average senescence score (0–10) throughout the growing season 0.83 0.64 (0.01)
Morphology/biomass
BaseDiameter.9 Largest plant diameter measured at ground level (mm) 0.52 0.27 (0.05)
DryMatter.9 Estimated total dry weight per plant (g) 0.54 0.06 (0.05)
LeafLength.7 Ligule to tip length along the central vein of the youngest leaf with a ligule (cm) 0.65 0.67 (0.01) LeafWidth.7 Blade width at half-leaf length for the leaf used to measure LeafLength (cm) 0.64 0.52 (0.02) MaxCanopyHeight.9 Height from the ground to the point of ‘inflection’ of the majority of leaves (cm) 0.77 0.35 (0.03)
Moisture.9 Estimated moisture content based on a sub-sample (%) 0.59 0.70 (0.01)
StatureLeafAngle.7 Three-category score reflecting leaf angle relative to the vertical (0 = vertical,
0.5 = intermediate, 1 = horizontal) 0.50 0.46 (0.03)
StatureStemAngle.7 Four-category score reflecting stem angle relative to the vertical
(1 = upright stems, 2 = stems inclined up to 30° from the vertical, 3 = stems inclined up to 60° from the vertical, 4 = stems inclined up to 90° from the vertical)
0.48 0.37 (0.02)
StemDiameter.9 Diameter 10–15 cm from the ground of a randomly chosen stem (mm) 0.60 0.51 (0.03)
TallestStem.9 Length of the tallest stem (cm) 0.88 0.65 (0.01)
TransectCount.9 Number of stems with ≥50 % canopy height across the middle of the plant 0.51 0.17 (0.04)
Cell wall composition
Cellulose.8 Gravimetrically measured cellulose content (% d. wt) 0.79 0.62 (0.02) Hemicellulose.8 Gravimetrically measured hemicellulose content (% d. wt) 0.60 0.25 (0.03)
Lignin.8 Gravimetrically measured lignin content (% d. wt) 0.66 0.43 (0.02)
*Trait: phenotypic traits measured in 2007 (.7), 2008 (.8) or 2009 (.9) (i.e. after two, three or four growing seasons, respectively). Detailed phenotyping proto-cols were described by Slavov et al. (2013b).
†H2: broad-sense heritability (Slavov et al., 2014). ‡r
Sorg (s.d.): average predictive ability and standard deviation across 100 random 10-fold cross-validations based on 53 174 single-nucleotide variants obtained
from alignments to the Sorghum bicolor genome (Slavov et al., 2014).
[i =1.41 and 2.15, corresponding to keeping the best 20 and 4
% of genotypes in S1 and S2, respectively (Falconer, 1989)].
However, the outcomes were strikingly different in terms of correlated responses (Table 2; Fig. 1; Supplementary Data File S1). As expected from the pre-specified genetic gains, biomass yield in S1 was increased by 20 %, while flowering was delayed by 44 d (20 %). Unfavourably, this also resulted in 21 % lower average senescence and 26 % higher biomass moisture con-tent, as expected from the strong genetic correlations of these traits with flowering time (rg> 0.8, Supplementary Data File
S1). However, somewhat surprisingly, given the moderate
gen-etic correlation between stem/canopy height and biomass yield (Slavov et al., 2014; Supplementary Data File S1), the canopy height increased modestly (5 %), whereas the length of the tall-est stem was reduced by 22 %. Furthermore, both BaseDiameter (i.e. a measure of the overall area occupied by each plant) and TransectCount (i.e. a correlate of the total number of stems)
were reduced by 7 and 19 %, respectively. This was counterbal-anced by substantial increases in stem diameter (18 %), leaf width (19 %) and particularly leaf length (37 %) (i.e. leaves can form a substantial proportion of final biomass yields; da Costa
et al., 2014). Leaf orientation also changed considerably, with leaf angle shifting by 28 % towards the vertical. Finally, cel-lulose, hemicellulose and lignin contents were all reduced (by approx. 5, 1 and 3 %, respectively).
In contrast, the mean flowering time under S2 was shifted 17 d earlier (8 %) compared with the current population mean, with a surprising (i.e. inconsistent with the sign of the genetic correlation) slight decrease in senescence (4 %), but also with a substantial reduction in biomass moisture content (13 %). Furthermore, canopy height was increased considerably (17 %), while there were also modest increases in the length of the tallest stem, and base and stem diameters (4, 5 and 6 %, respec-tively). Leaf and stem orientation both changed, with leaf angle shifting by 8 % towards the horizontal, but stems becoming 12 % more upright. Finally, changes in cellulose and lignin con-tents were as specified by desired genetic changes (an increase and a reduction of 5 %, respectively), while there was also a small increase (1 %) in hemicellulose content.
The relative economic values of secondary traits included in selection indices varied considerably (Table 2; Supplementary Data File S1). In S1, for example, the economic value of delaying flowering by 1 d was only 2.2 times higher than that of increasing biomass yield by 1 g per plant (Table 2). Given that plants were grown on a 1.5 × 1.5 m grid (4444 plants ha–1), the delay of flowering by 44 d in S1 translates to the
equivalent of an increase in dry biomass by 0.43 t ha–1 (i.e.
4444 × 44 × 2.2/1000/1000), or roughly €30 ha–1, if a price
of €70 t–1 is assumed (Witzel and Finger, 2016). With similar
assumptions, the economic values of increasing cellulose by 5 % and decreasing lignin by 5 % in S2 would be equivalent
to yield increases worth approx. €112 and €280 ha–1,
respec-tively (e.g. the breeding effort required to reduce lignin by 5
% would be equivalent to increasing biomass yield by 4.0 t ha–
1, translating to €280 ha–1). However, the increased efficiency
of bioconversion expected to result from these modifications (which is not reflected in these calculations) may substantially influence these comparisons. Ultimately, whether these eco-nomic values are acceptable will probably depend on many factors, including the expected scale of deployment of the crop, the risk of maladaptation associated with changes in phenological traits and the actual effects of changes in cell wall composition on bioconversion. However, having eco-nomic value estimates before breeding has been undertaken may be preferable to setting completely arbitrary selection targets.
Assuming that the outcomes of both scenarios are not completely satisfactory to breeders (e.g. because of the increase of moisture content in S1 and shift towards earlier flowering in S2), we modified the vector of desired genetic gains (Q), by setting target changes of 0 for moisture content
in S1 and flowering time in S2 (Table 3; Supplementary Data
File S1). As expected from the increased number of breed-ing targets, selection intensities for these refined scenarios
were higher, but the increase was relatively small (i = 2.18
and 2.58, corresponding to keeping the best 3.8 and 1.3 % of genotypes in S1* and S2*, respectively). Correlated
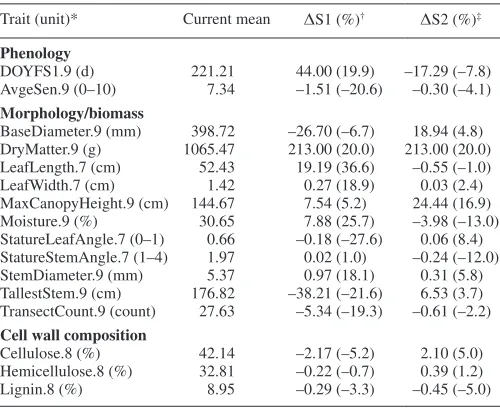
Table 2. Absolute (Δ) and relative (%) changes in trait values resulting from two contrasting genomic index selection scenarios (see text and Supplementary Data File S1 for additional parameter
estimates)
Trait (unit)* Current mean ΔS1 (%)† ΔS2 (%)‡
Phenology
DOYFS1.9 (d) 221.21 44.00 (19.9) –17.29 (–7.8) AvgeSen.9 (0–10) 7.34 –1.51 (–20.6) –0.30 (–4.1)
Morphology/biomass
BaseDiameter.9 (mm) 398.72 –26.70 (–6.7) 18.94 (4.8) DryMatter.9 (g) 1065.47 213.00 (20.0) 213.00 (20.0) LeafLength.7 (cm) 52.43 19.19 (36.6) –0.55 (–1.0) LeafWidth.7 (cm) 1.42 0.27 (18.9) 0.03 (2.4) MaxCanopyHeight.9 (cm) 144.67 7.54 (5.2) 24.44 (16.9) Moisture.9 (%) 30.65 7.88 (25.7) –3.98 (–13.0) StatureLeafAngle.7 (0–1) 0.66 –0.18 (–27.6) 0.06 (8.4) StatureStemAngle.7 (1–4) 1.97 0.02 (1.0) –0.24 (–12.0) StemDiameter.9 (mm) 5.37 0.97 (18.1) 0.31 (5.8) TallestStem.9 (cm) 176.82 –38.21 (–21.6) 6.53 (3.7) TransectCount.9 (count) 27.63 –5.34 (–19.3) –0.61 (–2.2)
Cell wall composition
Cellulose.8 (%) 42.14 –2.17 (–5.2) 2.10 (5.0) Hemicellulose.8 (%) 32.81 –0.22 (–0.7) 0.39 (1.2) Lignin.8 (%) 8.95 –0.29 (–3.3) –0.45 (–5.0)
Weighting factors for the selection indices corresponding to each scenario were calculated using eqn (4), while economic values, expected correlated responses and selection intensities were estimated using eqns (5), (6) and (7), respectively.
*Trait (unit): phenotypic traits as defined in Table 1. Detailed phenotyping protocols were described by Slavov et al. (2013b).
†Breeding scenario with objectives: (1) increase yield (DryMatter) by 20 %
and (2) delay flowering (DOYFS1) by 44 d (approx. 20 %). The genetic gains listed in the table can be achieved in a single round of selection with inten-sity = 1.41 (i.e. selecting the top 20 % of lines based on genomic estimated aggregate breeding values). The relative economic values per unit of change for the traits in the selection index are DOYFS1:DryMatter = 2.2:1.
‡Breeding scenario with objectives: (1) increase yield by 20 %, (2) increase
cellulose content by 5 % and (3) reduce lignin by 5 %. The genetic gains listed in the table can be achieved in a single round of selection with intensity = 2.15 (i.e. selecting the top 4 % of lines based on genomic estimated aggregate breed-ing values). The relative economic values per unit of change for the traits in the selection index are Lignin:Cellulose:DryMatter = –180:72:1.
A
vgeSen
BaseDiameter
Dr
yMatter
Cellulose
Hemicellulose
Lignin
DO
YFS1
AB
C
40 30 20 10 0 –10 –20 –30 40 30 20 10 0 –10 –20 –30
LeafLength
TallestStem
LeafWidth
StemDiameter
MaxCanop
yHeight
Tr
ansectCount
Moisture
StatureLeafAngle
StatureStemAngle
A
vgeSen
BaseDiameter
Dr
yMatter
Cellulose
Hemicellulose
Lignin
DO
YFS1
LeafLength
TallestStem
LeafWidth
StemDiameter
MaxCanop
yHeight
Tr
ansectCount
Moisture
StatureLeafAngle
StatureStemAngle
40 30 20 10 0 –10 –20 –30
A
vgeSen
BaseDiameter
Dr
yMatter
Cellulose
Hemicellulose
Lignin
DO
YFS1
LeafLength
TallestStem
LeafWidth
StemDiameter
MaxCanop
yHeight
Tr
ansectCount
Moisture
StatureLeafAngle
StatureStemAngle
Fig.
1.
Quantitati
ve (bottom) and schematic (top) representation of current population mean v
alues (A) for 16 phenotypic traits (
Table
1
) and outcomes from genomic inde
x selection scenarios S1 (increase
biomass yield by 20 % and delay flo
wering by 44 d; B) and S2 (increase biomass yield by 20 %, while also increasing cellulose content by 5 % and reducing lignin content by 5 %; C).
The orange line in all
radar charts is set to 0 and corresponds to the baseline (i.e. current population mean v
alues;
Table 2
).
The green lines in (B) and (C) correspond to the relati
ve changes (%) for the 16 traits (
Table 2
).
responses in the modified scenarios were generally similar to those in S1 and S2, with an even greater increase in leaf length and canopy height in S1* and an even larger reduc-tion in moisture content in S2*. There were, however, also a few sign differences. For example, stem orientation in S1* became 26 % more vertical [i.e. compared with a slight (1 %) shift towards horizontal orientation in S1]. Similarly, changes in base diameter, number of stems (TransectCount) and leaf size (both length and width) switched signs between S2 and S2* (Table 2 vs. Table 3). Finally, as expected, the relative economic values of all secondary traits included in the original scenarios increased substantially in the modified scenarios.
Implications
The analytical framework discussed above can be used to evaluate numerous scenarios with different breeding objectives, explicitly considering correlated responses and relative eco-nomic values in silico, prior to committing extensive resources. The proposed approach is broadly applicable for this purpose and can readily incorporate high-throughput phenotyping data as part of integrated breeding platforms (i.e. traits in selection indices do not have to be the same as those that are targeted for improvement). Obtaining accurate estimates of variance–covar-iance matrices is critical as they largely determine the outcome of all subsequent analyses and limit applicability to a specific population and environment. Thus, although the estimation of these matrices from molecular markers is one of the appealing features of this approach (i.e. because conventional methods are much slower and costlier), building in some form of empirical validation would be prudent.
Because the computational cost of evaluating each scenario is very low (i.e. once genetic and phenotypic variance–covariance matrices are estimated), a large set of candidate scenarios can be assessed at the beginning of each breeding cycle. One approach for doing this might be to start from relatively simple scenarios and iteratively modify selection targets and/or economic values as in the examples above. A more systematic alternative might be to perform a search of the multivariate space of scenarios defined by desired gains, correlated responses, economic values and selec-tion intensities using different constraints [e.g. overall cost of the breeding cycle (Gaynor et al., 2017)] or approach the search as an optimization problem (Akdemir et al., 2018; Li et al., 2017).
SUPPLEMENTARY DATA
Supplementary data are available online at https://academic.
oup.com/aob and consist of the following. File S1: phenotypic and genetic variance–covariance matrices, correlations and parameter estimates for four genomic index selection scenarios.
ACKNOWLEDGEMENTS
This work was supported by the Biotechnology and Biological Sciences Research Council (grant nos BB/K01711X/1, BBS/E/ W/10963A01A and BB/CSP1730/1).
LITERATURE CITED
Akdemir D, Beavis W, Fritsche-Neto R, Singh AK, Isidro-Sánchez J.2018. Multi-objective optimized genomic breeding strategies for sustainable food improvement. Heredity. doi: 10.1038/s41437-018-0147-1.
Allison DB, Fernandez JR, Heo M, et al. 2002. Bias in estimates of quantita-tive-trait-locus effect in genome scans: demonstration of the phenomenon and a method-of-moments procedure for reducing bias. American Journal of Human Genetics70: 575–585.
Beavis WD.1998. QTL analyses: power, precision, and accuracy. In: Paterson AH, ed. Molecular dissection of complex traits. Boca Raton, FL: CRC Press, 145–162.
Bentley AR, Scutari M, Gosman N, et al. 2014. Applying association map-ping and genomic selection to the dissection of key traits in elite European wheat. Theoretical and Applied Genetics127: 2619–33.
Bernardo R.2016. Bandwagons I, too, have known. Theoretical and Applied Genetics129: 2323–2332.
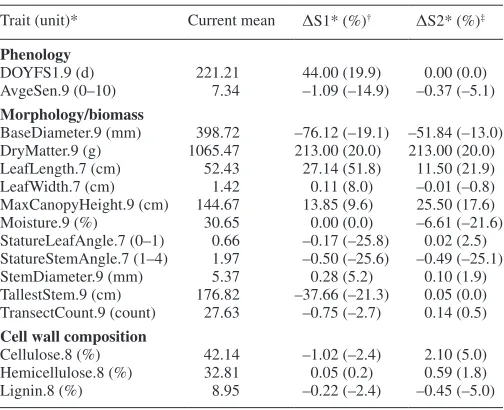
Table 3. Absolute (Δ) and relative (%) changes in trait values resulting from two refined genomic index selection scenarios (i.e. S1* and S2* are modified versions of S1 and S2 from Table 2; see text and Supplementary Data File S1 for additional parameter
estimates)
Trait (unit)* Current mean ΔS1* (%)† ΔS2* (%)‡
Phenology
DOYFS1.9 (d) 221.21 44.00 (19.9) 0.00 (0.0) AvgeSen.9 (0–10) 7.34 –1.09 (–14.9) –0.37 (–5.1)
Morphology/biomass
BaseDiameter.9 (mm) 398.72 –76.12 (–19.1) –51.84 (–13.0) DryMatter.9 (g) 1065.47 213.00 (20.0) 213.00 (20.0) LeafLength.7 (cm) 52.43 27.14 (51.8) 11.50 (21.9) LeafWidth.7 (cm) 1.42 0.11 (8.0) –0.01 (–0.8) MaxCanopyHeight.9 (cm) 144.67 13.85 (9.6) 25.50 (17.6) Moisture.9 (%) 30.65 0.00 (0.0) –6.61 (–21.6) StatureLeafAngle.7 (0–1) 0.66 –0.17 (–25.8) 0.02 (2.5) StatureStemAngle.7 (1–4) 1.97 –0.50 (–25.6) –0.49 (–25.1) StemDiameter.9 (mm) 5.37 0.28 (5.2) 0.10 (1.9) TallestStem.9 (cm) 176.82 –37.66 (–21.3) 0.05 (0.0) TransectCount.9 (count) 27.63 –0.75 (–2.7) 0.14 (0.5)
Cell wall composition
Cellulose.8 (%) 42.14 –1.02 (–2.4) 2.10 (5.0) Hemicellulose.8 (%) 32.81 0.05 (0.2) 0.59 (1.8) Lignin.8 (%) 8.95 –0.22 (–2.4) –0.45 (–5.0)
Weighting factors for the selection indices corresponding to each scenario were calculated using eqn (4), while economic values, expected correlated responses and selection intensities were estimated using eqns (5), (6) and (7), respectively.
*Trait (unit): phenotypic traits as defined in Table 1. Detailed phenotyping protocols were described by Slavov et al. (2013b).
†Breeding scenario with objectives: (1) increase yield (DryMatter) by 20
% and (2) delay flowering (DOYFS1) by 44 d (approx. 20 %), while keep-ing moisture content unchanged. The genetic gains listed in the table can be achieved in a single round of selection with intensity = 2.18 (i.e. selecting the top 3.8 % of lines based on genomic estimated aggregate breeding values). The relative economic values per unit of change for the traits in the selection index are Moisture:DOYFS1:DryMatter = –45:9:1.
‡Breeding scenario with objectives: (1) increase yield by 20 %, (2) increase
cellulose content by 5 % and (3) reduce lignin by 5 %, while keeping flowering time unchanged. The genetic gains listed in the table can be achieved in a single round of selection with intensity = 2.58 (i.e. selecting the top 1.3 % of lines based on genomic estimated aggregate breeding values). The relative economic values per unit of change for the traits in the selection index are Cellulose:Lign in:DOYFS1:DryMatter = 518:–318:25:1.
Bhatia R, Gallagher JA, Gomez LD, Bosch M.2017. Genetic engineering of grass cell wall polysaccharides for biorefining. Plant Biotechnology Journal15: 1071–1092.
Boyle EA, Li YI, Pritchard JK.2017. An expanded view of complex traits: from polygenic to omnigenic. Cell169: 1177–1186.
Buckler ES, Holland JB, Bradbury PJ, et al. 2009. The genetic architecture of maize flowering time. Science325: 714–718.
Button KS, Ioannidis JPA, Mokrysz C, et al. 2013. Power failure: why small sample size undermines the reliability of neuroscience. Nature Reviews. Neuroscience14: 365.
Chung J-H, Kim D-S.2012. Miscanthus as a potential bioenergy crop in East Asia. Journal of Crop Science and Biotechnology15: 65–77.
Clark LV, Dzyubenko E, Dzyubenko N, et al. 2016. Ecological character-istics and in situ genetic associations for yield-component traits of wild Miscanthus from eastern Russia. Annals of Botany118: 941–955.
Clifton-Brown JC, Lewandowski I.2000. Water use efficiency and biomass partitioning of three different Miscanthus genotypes with limited and unlimited water supply. Annals of Botany86: 191–200.
Clifton-Brown J, Chiang Y-C, Hodkinson TR.2008. Miscanthus: genetic resources and breeding potential to enhance bioenergy production. In: Vermerris W, ed. Genetic improvement of bioenergy crops. New York, NY: Springer New York, 295–308.
Clifton‐Brown J, Hastings A, Mos M, et al. 2017. Progress in upscaling Miscanthus biomass production for the European bio‐economy with seed‐ based hybrids. Global Change Biology Bioenergy9: 6–17.
Cockram J, Mackay I. 2018. Genetic mapping populations for conduct-ing high-resolution trait mappconduct-ing in plants. Advances in Biochemical Engineering/Biotechnology164: 109–138.
da Costa RMF, Lee SJ, Allison GG, Hazen SP, Winters A, Bosch M.2014. Genotype, development and tissue-derived variation of cell-wall properties in the lignocellulosic energy crop Miscanthus. Annals of Botany114: 1265–1277.
da Costa RM, Pattathil S, Avci U, et al. 2017. A cell wall reference profile for Miscanthus bioenergy crops highlights compositional and structural variations associated with development and organ origin. New Phytologist
213: 1710–1725.
da Costa RMF, Simister R, Roberts LA, et al. 2019. Nutrient and drought stress: implications for phenology and biomass quality in miscanthus. Annals of BotanyXXX: XXX–XXX.
Cuevas J, Crossa J, Montesinos-López OA, Burgueño J, Pérez-Rodríguez P, de los Campos G.2017. Bayesian genomic prediction with genotype × environment interaction kernel models. G3: Genes|Genomes|Genetics
7: 41–53.
Davey CL, Robson P, Hawkins S, et al. 2017. Genetic relationships between spring emergence, canopy phenology and biomass yield increase the accuracy of genomic prediction in Miscanthus. Journal of Experimental Botany68: 5093–5102.
Davey JW, Hohenlohe PA, Etter PD, Boone JQ, Catchen JM, Blaxter ML. 2011. Genome-wide genetic marker discovery and genotyping using next-generation sequencing. Nature Reviews. Genetics12: 499–510.
Dong H, Liu S, Clark LV, et al. 2018. Genetic mapping of biomass yield in three interconnected Miscanthus populations. Global Change Biology Bioenergy10: 165–185.
Evans LM, Slavov GT, Rodgers-Melnick E, et al. 2014. Population genomics of Populus trichocarpa identifies signatures of selection and adaptive trait associations. Nature Genetics46: 1089–1096.
Falconer DS. 1989. Introduction to quantitative genetics. Harlow, UK: Longman.
Farrell AD, Clifton‐Brown JC, Lewandowski I, Jones MB.2006. Genotypic variation in cold tolerance influences the yield of Miscanthus. Annals of Applied Biology149: 337–345.
Fonteyne S, Muylle H, Lootens P, et al. 2018. Physiological basis of chilling tolerance and early-season growth in Miscanthus. Annals of Botany121: 281–295.
Furtado A, Lupoi JS, Hoang NV, et al. 2014. Modifying plants for biofuel and biomaterial production. Plant Biotechnology Journal12: 1246–58.
Garrick DJ, Taylor JF, Fernando RL.2009. Deregressing estimated breed-ing values and weightbreed-ing information for genomic regression analyses. Genetics Selection Evolution41: 55. doi: 10.1186/1297-9686-41-55.
Gaynor RC, Gorjanc G, Bentley AR, et al. 2017. A two-part strategy for using genomic selection to develop inbred lines. Crop Science57: 2372–2386.
Gifford JM, Chae WB, Swaminathan K, Moose SP, Juvik JA. 2015. Mapping the genome of Miscanthus sinensis for QTL associated with bio-mass productivity. Global Change Biology Bioenergy7: 797–810.
Hallingback HR, Fogelqvist J, Powers SJ, et al. 2016. Association mapping in Salix viminalis L. (Salicaceae) – identification of candidate genes asso-ciated with growth and phenology. Global Change Biology Bioenergy8: 670–685.
Hastings A, Clifton-Brown J, Wattenbach M, Mitchell CP, Stampfl P, Smith P.2009. Future energy potential of Miscanthus in Europe. Global Change Biology Bioenergy1: 180–196.
Heaton E, Voigt T, Long SP.2004. A quantitative review comparing the yields of two candidate C4 perennial biomass crops in relation to nitrogen, tem-perature and water. Biomass and Bioenergy27: 21–30.
Ings J, Mur LA, Robson PR, Bosch M. 2013. Physiological and growth responses to water deficit in the bioenergy crop Miscanthus × giganteus. Frontiers in Plant Science4: 468. doi: 10.3389/fpls.2013.00468.
Jensen E, Farrar K, Thomas-Jones S, Hastings A, Donnison I, Clifton-Brown J.2011. Characterization of flowering time diversity in Miscanthus species. Global Change Biology Bioenergy3: 387–400.
Jia Y, Jannink J-L.2012. Multiple-trait genomic selection methods increase genetic value prediction accuracy. Genetics192: 1513–1522.
Lewandowski I, Clifton-Brown JC, Scurlock JMO, Huisman W. 2000. Miscanthus: European experience with a novel energy crop. Biomass and Bioenergy19: 209–227.
Li Y, Dungey H, Yanchuk A, Apiolaza LA.2017. Improvement of non-key traits in radiata pine breeding programme when long-term economic importance is uncertain. PLoS One12: e0177806. doi: 10.1371/journal. pone.0177806.
Liu W, Yan J, Li J, Sang T.2012. Yield potential of Miscanthus energy crops in the Loess Plateau of China. Global Change Biology Bioenergy 4: 545–554.
Long SP, Spence AK.2013. Toward cool C4 crops. Annual Review of Plant Biology 64: 701–722.
Mackay I, Ober E, Hickey J.2015. GplusE: beyond genomic selection. Food and Energy Security4: 25–35.
Malinowska M, Donnison IS, Robson PRH.2017. Phenomics analysis of drought responses in Miscanthus collected from different geographical locations. Global Change Biology Bioenergy9: 78–91.
Meuwissen THE, Hayes BJ, Goddard ME.2001. Prediction of total genetic value using genome-wide dense marker maps. Genetics157: 1819–1829.
Naidu SL, Moose SP, Al-Shoaibi AK, Raines CA, Long SP.2003. Cold tol-erance of C4 photosynthesis in Miscanthus × giganteus: adaptation in amounts and sequence of C4 photosynthetic enzymes. Plant Physiology
132: 1688–1697.
Richter GM, Riche AB, Dailey AG, Gezan SA, Powlson DS.2008. Is UK biofuel supply from Miscanthus water‐limited? Soil Use and Management
24: 235–245.
Sacks EJ, Juvik JA, Lin Q, Stewart JR, Yamada T.2013. The gene pool of Miscanthus species and its improvement. In: Paterson AH, ed. Genomics of the Saccharinae. New York, NY: Springer New York, 73–101.
Slavov GT, Allison GG, Bosch M.2013a. Advances in the genetic dissection of plant cell walls: tools and resources available in Miscanthus. Frontiers in Plant Science4: 217. doi: 10.3389/fpls.2013.00217.
Slavov GT, Robson P, Jensen E, et al. 2013b. Contrasting geographic pat-terns of genetic variation for molecular markers vs phenotypic traits in the energy grass Miscanthus sinensi.Global Change Biology Bioenergy
5: 562–571.
Slavov GT, Nipper R, Robson P, et al. 2014. Genome-wide association stud-ies and prediction of 17 traits related to phenology, biomass and cell wall composition in the energy grass Miscanthus sinensis. New Phytologist
201: 1227–1239.
Smith HF. 1936. A discriminant function for plant selection. Annals of Eugenics7: 240–250.
Stavridou E, Hastings A, Webster RJ, Robson PRH.2017. The impact of soil salinity on the yield, composition and physiology of the bioenergy grass Miscanthus × giganteus. Global Change Biology Bioenergy 9: 92–104.
Stavridou E, Webster R, Robson PRH.2019. Novel Miscanthus genotypes selected for different drought tolerance phenotypes show enhanced tol-erance across combinations of salinity and reduced available water treat-ments. Annals of BotanyXXX: xxx–xxx.
Tanger P, Field JL, Jahn CE, DeFoort MW, Leach JE.2013. Biomass for thermochemical conversion: targets and challenges. Frontiers in Plant Science4: 218. doi: 10.3389/fpls.2013.00218.
Valentine J, Clifton-Brown J, Hastings A, Robson P, Allison G, Smith P. 2012. Food vs. fuel: the use of land for lignocellulosic ‘next generation’
energy crops that minimize competition with primary food production. Global Change Biology Bioenergy4: 1–19.
Visscher PM, Wray NR, Zhang Q, et al. 2017. 10 years of GWAS discovery: biology, function, and translation. American Journal of Human Genetics
101: 5–22.
van der Weijde T, Huxley LM, Hawkins S, et al. 2017a. Impact of drought stress on growth and quality of Miscanthus for biofuel production. Global Change Biology Bioenergy9: 770–782.
van der Weijde T, Kiesel A, Iqbal Y, et al. 2017b. Evaluation of Miscanthus sinensis biomass quality as feedstock for conversion into different bioenergy products. Global Change Biology Bioenergy9: 176–190.
Welker C, Balasubramanian V, Petti C, Rai K, DeBolt S, Mendu V.2015. Engineering plant biomass lignin content and composition for biofuels and bioproducts. Energies8: 7654–7676.
Weng JH.1993. Photosynthesis of different ecotypes of Miscanthus spp as affected by water stress. Photosynthetica29: 43–48.
Witzel C-P, Finger R.2016. Economic evaluation of Miscanthus production – a review. Renewable and Sustainable Energy Reviews53: 681–696.
Yamada Y, Yokouchi K, Nishida A.1975. Selection index when genetic gains of individual traits are of primary concern. Japanese Journal of Genetics50: 33–41.
Zeng Y, Zhao S, Yang S, Ding S-Y.2014. Lignin plays a negative role in the biochemical process for producing lignocellulosic biofuels. Current Opinion in Biotechnology27: 38–45.