Supplemental Information
Cai et. al.
Table 1S
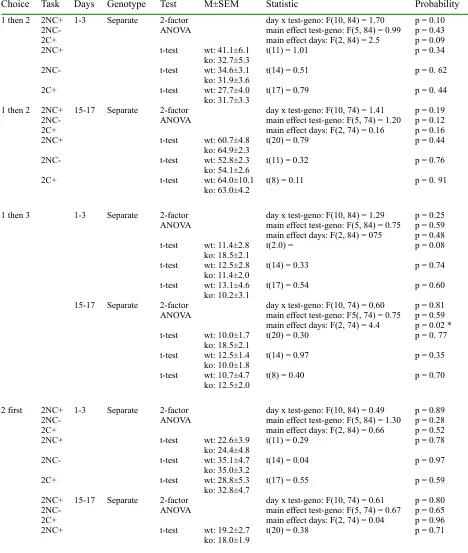
Choice Task Days Genotype Test M±SEM Statistic Probability
1 then 2 2NC+ 2NC-2C+
1-3 Separate 2-factor
ANOVA day x test-geno: F(10, 84) = 1.70main effect test-geno: F(5, 84) = 0.99 main effect days: F(2, 84) = 2.5
p = 0.10 p = 0.43 p = 0.09
2NC+ t-test wt: 41.1±6.1
ko: 32.7±5.3 t(11) = 1.01 p = 0.34
2NC- t-test wt: 34.6±3.1
ko: 31.9±3.6 t(14) = 0.51 p = 0. 62
2C+ t-test wt: 27.7±4.0
ko: 31.7±3.3 t(17) = 0.79 p = 0. 44
1 then 2 2NC+ 2NC-2C+
15-17 Separate 2-factor
ANOVA day x test-geno: F(10, 74) = 1.41main effect test-geno: F(5, 74) = 1.20 main effect days: F(2, 74) = 0.16
p = 0.19 p = 0.12 p = 0.16
2NC+ t-test wt: 60.7±4.8
ko: 64.9±2.3 t(20) = 0.79 p = 0.44
2NC- t-test wt: 52.8±2.3
ko: 54.1±2.6 t(11) = 0.32 p = 0.76
2C+ t-test wt: 64.0±10.1
ko: 63.0±4.2 t(8) = 0.11 p = 0. 91
1 then 3 1-3 Separate 2-factor
ANOVA day x test-geno: F(10, 84) = 1.29main effect test-geno: F(5, 84) = 0.75 main effect days: F(2, 84) = 075
p = 0.25 p = 0.59 p = 0.48 t-test wt: 11.4±2.8
ko: 18.5±2.1 t(2.0) = p = 0.08
t-test wt: 12.5±2.8
ko: 11.4±2.0 t(14) = 0.33 p = 0.74
t-test wt: 13.1±4.6
ko: 10.2±3.1 t(17) = 0.54 p = 0.60
15-17 Separate 2-factor
ANOVA day x test-geno: F(10, 74) = 0.60main effect test-geno: F5(, 74) = 0.75 main effect days: F(2, 74) = 4.4
p = 0.81 p = 0.59 p = 0.02 * t-test wt: 10.0±1.7
ko: 18.5±2.1 t(20) = 0.30 p = 0. 77
t-test wt: 12.5±1.4
ko: 10.0±1.8 t(14) = 0.97 p = 0.35
t-test wt: 10.7±4.7
ko: 12.5±2.0 t(8) = 0.40 p = 0.70
2 first 2NC+ 2NC-2C+
1-3 Separate 2-factor
ANOVA day x test-geno: F(10, 84) = 0.49main effect test-geno: F(5, 84) = 1.30 main effect days: F(2, 84) = 0.66
p = 0.89 p = 0.28 p = 0.52
2NC+ t-test wt: 22.6±3.9
ko: 24.4±4.8 t(11) = 0.29 p = 0.78
2NC- t-test wt: 35.1±4.7
ko: 35.0±3.2 t(14) = 0.04 p = 0.97
2C+ t-test wt: 28.8±5.3
ko: 32.8±4.7 t(17) = 0.55 p = 0.59
2NC+ 2NC-2C+
15-17 Separate 2-factor
ANOVA day x test-geno: F(10, 74) = 0.61main effect test-geno: F(5, 74) = 0.67 main effect days: F(2, 74) = 0.04
p = 0.80 p = 0.65 p = 0.96
2NC+ t-test wt: 19.2±2.7
2NC- t-test wt: 24.5±2.9
ko: 25.3±2.9 t(14) = 0.19 p = 0.85
2C+ t-test wt: 17.6±6.6
ko: 15.3±2.1 t(8) = 0.39 p = 0.71
3 first 2NC+ 2NC-2C+
1-3 Separate 2-factor
ANOVA day x test-geno: F(10, 84) = 3.30 main effect test-geno: F(5, 84) = 0.61 main effect days: F(2, 84) = 0.59
p = 0.0012 ** p = 0.69 p = 0.0.56
2NC+ t-test wt: 11.4±2.8
ko: 18.5±2.1 t(11) = 2.0 p = 0.08
2NC- t-test wt: 12.5±2.9
ko: 11.4±2.0 t(14) = 0.33 p = 0.74
2C+ t-test wt: 13.1±4.6
ko: 10.2±3.1 t(17) = 0.54 p = 0.60
2NC+ 2NC-2C+
15-17 Separate 2-factor
ANOVA day x test-geno: F(10, 76) = 1.40main effect test-geno: F(5, 76) = 4.20
main effect days: F(2, 76) = 1.14
p = 0.20 p = 0.004 ** p = 0.32
2NC+ t-test wt: 10.2±2.3
ko: 7.6±1.9 t(20) = 0.85 p = 0.40
2NC- t-test wt: 12.5±2.1
ko: 17.3±2.4 t(14) = 1.4 p = 0.19
2C+ t-test wt: 7.7±1.3
ko: 9.3±1.9 t(8) = 0.61 p = 0.56
1 then 2 2NC+ 2NC-2C+
1-3 Combined 1-factor
ANOVA 37.2±4.132.9±2.6 30.0±2.5
f(2, 45) = 1.4 p = 0.26
2NC+ 2NC-2C+
4-6 Combined 1-factor ANOVA (1)
47.0±3.4 39.2±1.9 51.5±2.8
f(2, 45) = 5.5
2NC- v. 2C+ q = 4.7 p < 0.01 ** p = 0.007 **
2NC+ 2NC-2C+
7-9 Combined 1-factor ANOVA (1)
50.5±2.0 45.1±2.0 60.9±2.7
f(2, 45) = 12.4
2C+ v. 2NC+ q = 4.3 p < 0.05 * 2C+ v. 2NC- q = 6.9 p < 0.001 ***
p < 0.0001 ***
2NC+ 2NC-2C+
10-12 Combined 1-factor ANOVA (1)
59.2±3.1 50.2±2.7 62.6±3.4
f(2, 45) = 4.4
2NC- v. 2C+ q = 4.1 p < 0.05 * p = 0.02 *
2NC+ 2NC-2C+
13-15 Combined 1-factor ANOVA (1)
63.7±4.0 49.9±2.4 62.8±3.6
f(2, 50) = 4.7
2NC- v. 2NC+ q = 3.9 p < 0.05 * 2NC- v. 2C+ q = 3.7 p < 0.05 *
p = 0.014 *
2NC+ 2NC-2C+
15-17 Combined 1-factor
ANOVA 62.3±2.653.7±1.9 63.4±4.4
f(2, 42) = 3.01 p = 0.06
1 then 3 2NC+ 2NC-2C+
1-3 Combined 1-factor
ANOVA 14.7±2.011.8±1.6 11.4±2.6
f(2, 45) = 0.60 p = 0.85
2NC+ 2NC-2C+
15-17 Combined 1-factor
ANOVA 9.7±1.111.0±1.2 11.8±2.1
f(2, 45) = 0.62 p = 0.54
2 first 2NC+ 2NC-2C+
1-3 Combined 1-factor
ANOVA 23.4±2.935.1±2.6 31.1±3.5
f(2, 45) = 3.2
2NC+ v. 2NC- q = 3.5 p < 0.05 p = 0.05 *
2NC+ 2NC-2C+
15-17 Combined 1-factor
ANOVA 18.6±1.625.0±1.9 16.2±2.7
f(2, 45) = 4.8
2NC- v. 2C+ q = 3.9 p < 0.05 * p = 0.013 *
3 first 2NC+ 2NC-2C+
1-3 Combined 1-factor
ANOVA 24.3±2.820.2±2.5 22.2±3.2
f(2, 45) = 0.50 p = 0.61
2NC+ 2NC-2C+
15-17 Combined 1-factor
ANOVA 8.9±1.515.5±1.8 8.6±1.2
f(2, 45) = 5.7
2NC- v. 2NC+ q = 4.4 p < 0.01 ** 2NC- v. 2C+ q = 3.7 p < 0.05 *
1 then 2 2NC+ 1-3 v.
15-17 Combined t-test 1-3: 37.2±4.115-17: 62.8±2.6 t(33) = 5.5 p < 0.0001 ***
2NC- 1-3: 32.9±2.6
15-17: 53.7±1.9 t(27) = 6.1 p < 0.0001 ***
2C+ 1-3: 30.0±2.5
15-17: 63.4±4.4 t(27) = 7.1 p < 0.0001 *** 1 then 3 2NC+ 1-3 v.
15-17 Combined t-test 1-3: 14.7±2.015-17: 9.7±1.1 t(33) = 2.4 p = 0.02 *
2NC- 1-3: 11.8±1.6
15-17: 11.0±1.2 t(30) = 0.41` p = 0.68
2C+ 1-3: 11.4±2.6
15-17: 11.8±2.1 t(27) = 0.10 p = 0.92 2 first 2NC+ 1-3 v.
15-17 Combined t-test 1-3: 23.4±2.915-17: 18.6±1.6 t(33) = 1.6 p = 0.13
2NC- 1-3: 35.1±2.6
15-17: 25.0±1.9 t(30) = 3.1 p = 0.004 **
2C+ 1-3: 31.1±3.5
15-17: 16.2±2.7 t(27) = 2.9 p = 0.008 ** 3 first 2NC+ 1-3 v.
15-17 Combined t-test 1-3: 24.7±2.815-17: 8.9±1.5 t(33) = 5.4 p < 0.0001 ***
2NC- 1-3: 15.5±1.8
15-17: 4.7±3.1 t(30) = 1.5 p = 0.13
2C+ 1-3: 8.6±1.2
15-17: 13.6±4.6 t(27) = 3.0 p = 0.006 **
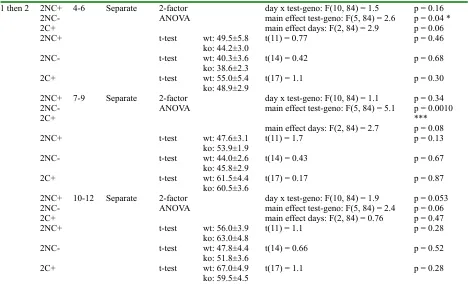
Table 2S 1 then 2 2NC+
2NC-2C+
4-6 Separate 2-factor
ANOVA day x test-geno: F(10, 84) = 1.5main effect test-geno: F(5, 84) = 2.6 main effect days: F(2, 84) = 2.9
p = 0.16 p = 0.04 * p = 0.06
2NC+ t-test wt: 49.5±5.8
ko: 44.2±3.0 t(11) = 0.77 p = 0.46
2NC- t-test wt: 40.3±3.6
ko: 38.6±2.3 t(14) = 0.42 p = 0.68
2C+ t-test wt: 55.0±5.4
ko: 48.9±2.9 t(17) = 1.1 p = 0.30
2NC+ 2NC-2C+
7-9 Separate 2-factor
ANOVA day x test-geno: F(10, 84) = 1.1main effect test-geno: F(5, 84) = 5.1
main effect days: F(2, 84) = 2.7
p = 0.34 p = 0.0010 *** p = 0.08
2NC+ t-test wt: 47.6±3.1
ko: 53.9±1.9 t(11) = 1.7 p = 0.13
2NC- t-test wt: 44.0±2.6
ko: 45.8±2.9 t(14) = 0.43 p = 0.67
2C+ t-test wt: 61.5±4.4
ko: 60.5±3.6 t(17) = 0.17 p = 0.87
2NC+ 2NC-2C+
10-12 Separate 2-factor
ANOVA day x test-geno: F(10, 84) = 1.9main effect test-geno: F(5, 84) = 2.4 main effect days: F(2, 84) = 0.76
p = 0.053 p = 0.06 p = 0.47
2NC+ t-test wt: 56.0±3.9
ko: 63.0±4.8 t(11) = 1.1 p = 0.28
2NC- t-test wt: 47.8±4.4
ko: 51.8±3.6 t(14) = 0.66 p = 0.52
2C+ t-test wt: 67.0±4.9
2NC+ 2NC-2C+
13-15 Separate 2-factor
ANOVA day x test-geno: F(10, 66) = 1.4main effect test-geno: F(5, 66) = 2.0 main effect days: F(2, 66) = 4.3
p = 0.22 p = 0.11 p = 0.02 *
2NC+ t-test wt: 57.0±6.8
ko: 70.4±3.2 t(16) = 1.8 p = 0.09
2NC- t-test wt: 54.9±2.5
ko: 46.9±3.2 t(14) = 1.7 p = 0.11
2C+ t-test wt: 63.9±6.5
ko: 61.9±4.3 t(17) = 0.26 p = 0.80
1 then 2 2NC+ 21-23 Separate 2-factor
ANOVA day x test-geno: F(2, 14) = 3.4main effect test-geno: F(1, 14) = 0.13 main effect days: F(2, 14) = 0.28
p = 0.06 p = 0.73 p = 0.76 2C+ 21-23 Separate 2-factor
ANOVA day x test-geno: F(2, 16) = 0.6main effect test-geno: F(1, 16) = 1.1 main effect days: F(, ) = 2.8
p = 0.56 p = 0.33 p = 0.09 2C+ 26-28 Separate 2-factor
ANOVA day x test-geno: F(2, 16) = 1.5main effect test-geno: F(1, 16) = 1.9 main effect days: F(2, 16) = 1.5
p = 0.24 p = 0.21 p = 0.26 2NC+ 15-17 v.
21-23 Combined t-test (1): 62.8±2.6(2): 63.6±2.5 t(29) = 0.19 p = 0.85 2C+ 15-17 v.
21-23 t-test (1): 63.4±4.4(2): 72.5±5.1 t(18) = 1.3 p = 0.19 2C+ 21-23 v.
26-28 t-test (1): 72.5±5.1(2): 82.2±4.1 t(18) = 1.5 p = 0.16 2C+ 15-17 v.
Figure 2S(a). 2-sequence response choices days 1-3
Figure 2S(b) 2-sequence response response choices days 15-17
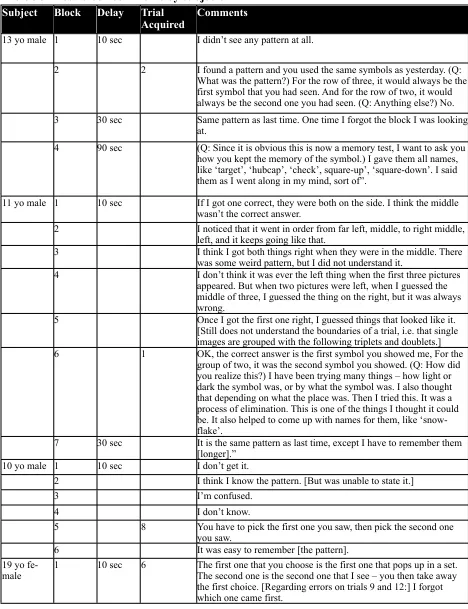
Table 3S - Post-block comments by subjects Subject Block Delay Trial
Acquired Comments
13 yo male 1 10 sec I didn’t see any pattern at all.
2 2 I found a pattern and you used the same symbols as yesterday. (Q: What was the pattern?) For the row of three, it would always be the first symbol that you had seen. And for the row of two, it would always be the second one you had seen. (Q: Anything else?) No. 3 30 sec Same pattern as last time. One time I forgot the block I was looking
at.
4 90 sec (Q: Since it is obvious this is now a memory test, I want to ask you how you kept the memory of the symbol.) I gave them all names, like ‘target’, ‘hubcap’, ‘check’, square-up’, ‘square-down’. I said them as I went along in my mind, sort of”.
11 yo male 1 10 sec If I got one correct, they were both on the side. I think the middle wasn’t the correct answer.
2 I noticed that it went in order from far left, middle, to right middle, left, and it keeps going like that.
3 I think I got both things right when they were in the middle. There was some weird pattern, but I did not understand it.
4 I don’t think it was ever the left thing when the first three pictures appeared. But when two pictures were left, when I guessed the middle of three, I guessed the thing on the right, but it was always wrong.
5 Once I got the first one right, I guessed things that looked like it. [Still does not understand the boundaries of a trial, i.e. that single images are grouped with the following triplets and doublets.] 6 1 OK, the correct answer is the first symbol you showed me, For the
group of two, it was the second symbol you showed. (Q: How did you realize this?) I have been trying many things – how light or dark the symbol was, or by what the symbol was. I also thought that depending on what the place was. Then I tried this. It was a process of elimination. This is one of the things I thought it could be. It also helped to come up with names for them, like ‘snow-flake’.
7 30 sec It is the same pattern as last time, except I have to remember them [longer].”
10 yo male 1 10 sec I don’t get it.
2 I think I know the pattern. [But was unable to state it.]
3 I’m confused.
4 I don’t know.
5 8 You have to pick the first one you saw, then pick the second one you saw.
6 It was easy to remember [the pattern].
19 yo
2 First slide pick the first one which shows up [among the triplet]; second slide pick the second one [among the doublet]. I realized this after the last test.
3 30 sec Same thing I noticed the first time I did this.
4 60 sec I used the same rule. I repeated the name of the thing to myself, such as ‘pie’ followed by ‘squiggly thing’. [Regarding error on trial 13:] I wasn’t paying attention because it was the same thing over and over again.
90 sec Subject reported feeling “antsy” and “bored”. 41 yo
fe-male 1 10 sec There’s a pattern. [But she could not state it explicitly.]
2 1 First you pick the first symbol. Then the next symbol to choose is the second one you saw during the slides with only one symbol shown.
3 You have to remember the symbol during the blank period because sometimes it’s a long wait.
15 yo
fe-male 1 10 sec X It’s hard to remember because of the blank slides.
2 I’m trying to remember.
3
4 Drawing a “blank”; “distracted”.
5 When I looked at the screen I went blank. I was thinking of other things.
6 “Choose the first picture for the triplet.” [Correct.] [She said that the second image she was] “picking at random”.
45 yo male 1 10 sec X I don’t know which is correct or incorrect.
2 I think there is a pattern.
3 I don’t know the pattern.
4 I just choose the pictures I like.
5 I still don’t know the pattern.
6 [No comment.]
7 There are always two that look similar so I pick whichever image doesn't belong or look alike.
45 yo
fe-male 1 10 sec X What does symbol mean? [Explained. Not a native English speaker.]
2 Don’t know.
3 Nothing.
4 [Tried choosing shapes based on their sizes.]
5 No.
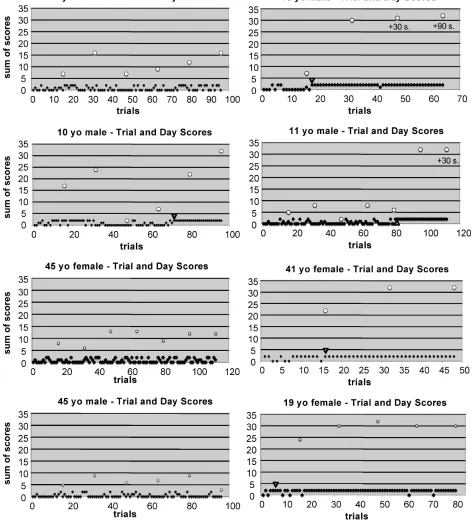
Figure 7S Human 2-sequence learning curves - complete set.
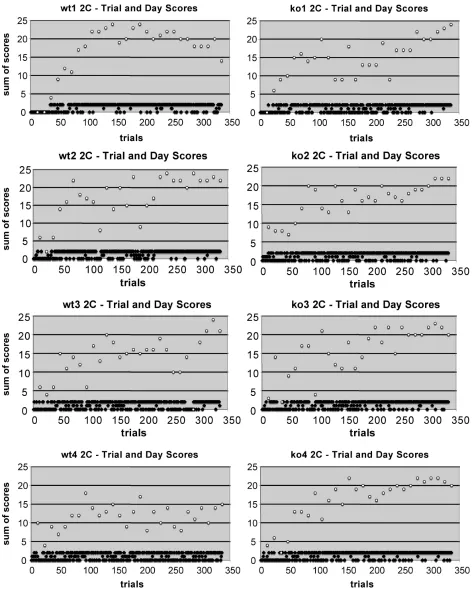
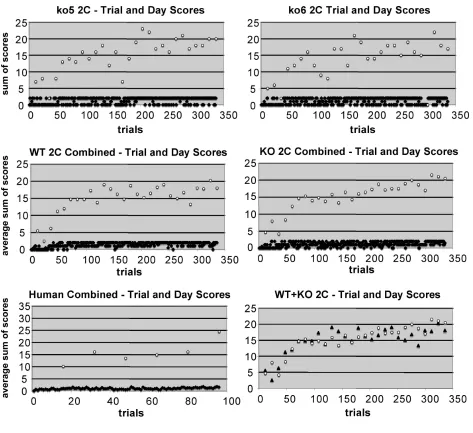
Figure 8S(a) Mouse 2-sequence learning curves
Figure 8S(b) Mouse 2-sequence learning curves
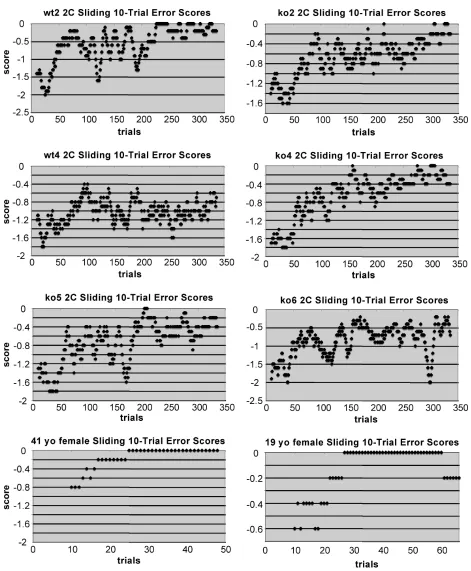
Figure 10S Additional Mouse and Human Sliding Error Score Plots
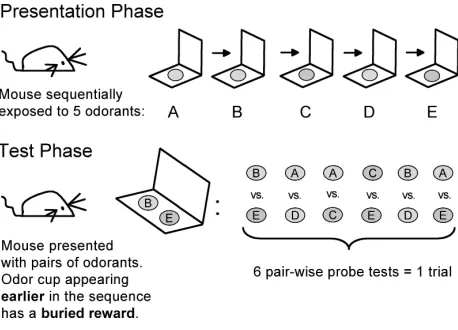
Odor Learning and Memory—Template for 2 Sequence Task
No food days 1-3 (to lab on Friday). Shape to dig on day 4 (Monday) + 4 pellets evening day 4
Continue shape to dig and adjust pellet number if necessary (0-6 pellets) for full motivation with stable weight and no starvation (through Sunday)
Begin acquisition (learning) test second Monday (Day 11 of preparation = Day 1 of acquisition).
Day one will include one additional shape as a 13th trial (do not record). Subsequent days will consist of only 12 trials.
Total Num. of Trials: % 1then2 % 1then3 %2first %3first
Refresh sand every Monday and Thursday morning before testing
Shaping Schedule-has buried food (is baited): wait for animal to choose correctly: D1 Trial 1,4,7,10,13 trial are shapes (every 3rd trial)
D2 Trial 1,4,7,10 D3 Trial 1,4,7 D4 Trial 1,4 D5 Trial 1 D6+ no shaping Choice/Shape coding:
Place a checkmark in the Choice column if the mouse was given a choice; in the Shape column if that was the case Sum only the number of Choices made (a checkmark=a “1”)
If for some reason a trial was not done, leave the Choice box blank and put a “n.d.” in the Comments box with the reason why
Negative reinforcement coding:
Only actual pinches get a checkmark
Write “T” (threatened) in comments section if no pinch was given
Mice are only pinched when they stop responding to (retreating from) the sight of the pinchers Type of test coding:
Components of Test: Abbreviations: Emphasis v. no Emphasis Emph v. NonEmph 2 constant v. 2 changing 2C v. 2NC With punishment v. dropped punishment P v. nP Delays (write in the time)
Animal ID: Day of Testing:
Date: Operator Initials:
Test Type: Delay Time: Pellets Fed:
Trial: Choice: Shape: 1then2 1then3 2first 3first Pinch: Comments:
1 - 312
2 - 123
3 - 231
4 - 321
5 - 132
6 - 213
7 - 231
8 - 123
9 - 312
10 - 132
11 - 321 12 - 213
Sums: X X
TesterInstructions
Before the first day’s testing, please read the underlined text:
“You are going to see some symbols in a slide presentation.
You will have to make a choice of one symbol when you see more than one. I will respond correct or incorrect.
You try to make as many correct choices as you can.
You are to say nothing during the test. Simply point to a symbol.”
After we are done today, I may ask you some questions.”
********
For blank slides, follow the timing on the scoring sheet; count to yourself by mentally saying “one one-thousand, two one-thousand, three one-thousand”, then tell the subject: “Please choose a symbol.”
********
After the first day’s testing, please read the underlined text:
“Did you notice anything about the test?”
(From Willingham et. al., 1989)
Make notes on the front of the scoring sheet quoting (if possible), or paraphrasing if nec-essary, the comments of the subject as to what, if anything, he or she noticed about the test.
Scoring Sheet
Problem Triplet Order Triplet Choice*
Correct (1)# Incorrect (0)
Pair Choice Correct (1) Incorrect (0)
1 3-1-2
2 1-2-3
3 2-3-1
4 3-2-1
5 1-3-2
6 2-1-3
7 2-3-1
8 1-2-3
9 3-1-2
10 1-3-2
11 3-2-1
12 2-1-3
13 1-2-3
14 1-3-2
15 2-1-3
16 2-3-1
Total
* Use the designation in the triplet order immediately to the left.
# Based on the rule stated on the back of the score sheet. Under no circumstances let the subject see this rule, or even hint that one exists.
Timing for slide sets 1-7:
1) Single image 1 2 or 3 seconds^ 2) Single image 2 2 or 3 seconds
3) Blank ! ! ! 10 seconds = default (the “delay”)
4) Triplet 3 seconds
If correct triplet
5) Blank following 2 seconds 6) Pair 3 seconds
If correct pair
If incorrect pair
7) Blank following 10 seconds If incorrect triplet
- S to look up to ceiling
5) Advance to blank slide after pair
- S to look at blank 15 seconds
^ say “one one-thousand, two one-thousand, three one-thousand” to yourself, then say “please choose a symbol”; use 3 seconds if needed by the subject
************************************* (Back of scoring sheet):
Initial Information – Not to be seen by the Subject
RULE = ________________
DELAY ______________
Date _______________
Test Day Number _______________
Block Number ________________
Subject Name _______________
Subject Age/Sex ________________
Subject Phone _______________
Tester Name _______________
Symbols for Human 2-sequence testing.
Table 4S subject (A) significant er-ror change point (B) rank sum difference (C) total blocks (D) statistically near-errorless (E) perfect blocks (F) reported insight trial (G)
11yo M+ 8 vs 9 *** 8 vs 10 *** 8 vs 11 ***
-56.25 -56.25 -56.25
11 YES 9-11 9-11
(30/30) 81 of 112
15yo F- none n.a. 10 NO 1-9 # none
(13/30) never of 96 13yo M+ 2 vs. 3 **
2 vs. 4 ** 2 vs. 5 * 2 vs. 6 ** 2 vs. 7 ns #
-22.35 -22.35 -19.80 -22.35 -22.35
7 YES 3-7 3-4, 6-7
(46/47) 18 of 64
45yo F- none n.a. 12 NO 1-11 # none
(9/30) never of 112 10yo M+ 7 vs 8 *
7 vs 9 ** 7 vs 10 * #
-39.95 -42.80 -42.80
10 YES 8-10 9-10
(25/25) 72 of 96
41yo F+ 1 vs. 2 ns 1 vs 3 * 1 vs 4 * 1 vs 5 ns #
-9.600 -9.600 -9.600
5 YES 2-5 4-5
(32/32) 17 of 48
45yo M- none n.a. 12 NO 1-11 # none
(2/30) never of 112 19yo F+ 1 vs 2 ns
1 vs 3 ns 1 vs 4 ns
-4.000 -12.00 -12.00
8 YES 1-8 3-6
(70/75) 6 of 80
wt1 None n.a. 34 6
8-32 12, 14, 15, 19, 32 (20/30) ko1 none n.a. 34 6, 10-11, 15, 21
24-33 28, 30, 32 (29/30)
wt2 none n.a. 34 5-11
13-18 21-33
23, 24, 27, 29
(27/30) ko2 none n.a. 34 8-9, 11, 13-15
17-33 33(27/30)
wt3 29 vs 30 ns 29 vs 31 * 29 vs 32 ** 29 vs 33 * 29 vs 34 ns
-39.85 -48.60 -43.20 -43.02
34 11, 13-14, 18-24
27-33 32(27/30)
wt4 none n.a. 34 10-11, 14, 19
30, 33 none(17/30) ko3 none n.a. 34 7-8, 11-12, 15
ko4 none n.a. 34 8-10
12-33 30 (25/30) ko5 none n.a. 34 6-8, 10-13, 16
19-33 none(25/30)
ko6 30 vs 31 ** 30 vs 32 * 30 vs 33 **
-50.40 -41.25 -46.85
34 9, 14, 16-18, 20
22-28, 32-33 none(21/30)
Table Legend
Significant changes between block errors assessed by Kruskal-Wallis test followed by Dunn’s Multiple Comparison test in groups of 10 (initial) and then 11 blocks, e.g. 1-10, 9-20, etc. All data were also assessed as complete sets, but significance levels are those from the 10-11 block analyses. For results showing a significant reduction in error median, significance of difference from no error state
was assessed by Wilcoxon Signed Rank test.
A – “M” is human male, “F” is human female, “+” means the human subject reported acquiring the cor-rect rule; “-“ means they did not do so, “yo” is “years old”.
B – Blocks showing significant decrease in consecutive error median (Dunn’s Multiple Comparison Test) C – Difference in rank sum for column B
D – Total blocks
E – Statistically near-errorless performance (by Dunn’s Multiple Comparison Test) after change point (B) or start point if no detectable significant error change point
F – Blocks with perfect performance (truly errorless) among those listed in (E). In parentheses are the number of perfect trials out of the trials following the insight trial or the last 30 trials if no re-ported insight (including for all mice).
G – Trial at which the human subject reported knowing the rule.
Endnotes (EN)
EN1 - Learning sets
! Early learning set experiments required monkeys to learn to choose the rewarded object
from a pair presented simultaneously during a trial (Harlow, 1949). When first presented with a
new pair of objects, the subject would have to choose one randomly. From the response, either
reward or no reward, the subject would presumably be informed as to which object was the
re-warded one. Thus, if it had learned to use a “win-stay, lose-shift” strategy (Levine, 1959), the
subject would be able to choose the rewarded object in the following trials. In its most stringent
sense, achieving a learning set would require that the subject choose the correct object on trial 2
greater than 90% of the time, or “near errorlessly” (Reid and Morris, 1993). Harlow found that
rhesus monkeys could, on average, improve their correct choice on trial two from just over 50%
to well over 90% (Harlow, 1949). They therefore appeared to have achieved a learning set. What
made the concept of learning set interesting to many scientists was that as a potential measure of
higher order cognitive function, it could be used to compare intelligence among non-human
spe-cies (Macphail, 1982; Slotnick et al., 2000; Warren, 1973).
! Rats and mice originally performed very poorly on learning set tests when compared with
primates, birds and other animals (Warren, 1973). However, rodents have relatively poor visual
acuity (Artal et al., 1998), and when tested for visual stimulus discrimination, they also perform
poorly compared to birds or primates. When the sensory modality was changed from a visual to
an olfactory one, rats and mice performed very well in learning tasks (Jennings and Keefer,
1969; Nigrosh et al., 1975). Indeed, in tests of learning set acquisition, rats were able to obtain
in which hundreds of trials had been required (Slotnick et al., 2000). Furthermore, it was argued
that the ability to achieve learning set within a handful of trials indicated that rats had a special
facility for olfactory learning (Eichenbaum and Otto, 1993). However, others have argued that
such exceptional performances might be due to “contaminant” cues accessible to the rodent
sub-jects (Reid and Morris, 1993). We have previously provided evidence that, in at least some test
formats, such artifacts can produce what appear to be remarkable feats of memory (Katz et al.,
2003).
EN2 - Effect of developmental stage on learning curves
Harlow also tested human subjects with the same test apparatus used by his monkeys
(Harlow, 1949). The ages of the children he studied ranged from two to five years old.
Unfortu-nately, the capacity for rational, hypothesis-based thought is relatively limited in humans for
much of that developmental period, e.g. at least until after the pre-conceptual substage of Piaget,
ending at four years of age; information processing related to the use of strategies for
memoriza-tion is believed to begin at seven to eight years of age (Bernstein et al., 2003). Therefore,
differ-ences in the learning curves between animals and more mature humans may have been missed,
as the data here suggest.
EN3 – Insight effect on learning curves
! The human subjects in these studies who inferred the rule, e.g. “when shown three
im-ages simultaneously, chose the image shown two-back first followed by that shown one-back
vari-ous possible rules to determine which consistently produced correct responses. The variable
choice of hypotheses to test led to another distinguishing feature of the human learning curves:
the moment of insight, when the correct rule was obtained and confirmed, was also highly
vari-able as to the trial on which it occurred.
EN4 – Examples of streak and slump performance by rodents in olfactory learning sets
! The best performing rat in one olfactory learning set study performed 11 of 20
post-training problems with one or no errors; however, the same rat did not meet criterion on 9 of the
20 problems (Slotnick and Katz, 1974). Individual rat performance in another olfactory learning
set study also suggested variable performance: “True errorless learning (making no mistakes
af-ter the first information trial) occurred in one problem for each of two rats, in 3 problems for 1
rat, and, for the best performer (L14), on 4 of the last 10 problems” (Slotnick et al., 2000). A
fi-nal example further documented that rats in an olfactory learning set assay “did sometimes
per-form errorlessly from trial 2 onwards on a given problem, but … such animals always perper-formed
less well on later problems” (Reid and Morris, 1993).
EN5 – Learning set use in mental retardation
It is conceivable that further increases in olfactory list length might allow some
discrimi-nation between FX and wild-type mouse short-term sequence memory, although as previously,
these genotypes did not differ in working memory for spatial location of four baited arms of a
radial maze. Nonetheless, those with FXS could recall an average of more than three numbers on
and touch over three pictures in the order stated by the examiner (Dykens et al., 1987; Hodapp et
al., 1992; Kemper et al., 1988). Therefore, the primary importance of the memory assessment in
this study is the demonstration that for mice it remains error-prone in a way that is different from
that of human subjects who have explicitly acquired the rule of the task.
! Nonetheless, essentially all prior learning set (LS) studies on human subjects have used
repeated trials of two-object discrimination (with changing positions among right and left, also
known as “object-quality discrimination” tests; reviewed in (Kaufman and Prehm, 1966)). In
those LS studies, normal subjects outperformed those with mild mental retardation, who in turn
outperformed those with more severe mental retardation. Therefore, LS studies in humans have
used two-item lists, and performance did correlate with IQ and mental age. Furthermore, as we
found with our normal human subjects, acquisition of the two-item learning set by those with
mental retardation occurred at quite different trial number for participants, including a substantial
proportion who did not appear to significantly improve (Wischner et al., 1962). A learning set
examination that included those with superior IQs also showed the influence of mental age and
IQ on trial at which LS was acquired, but also indicated that beyond an mental age of 8 or 9,
such “win-stay, lose-shift” LS tasks were too simple to provide discrimination (Harter, 1965). In
contrast, the 2-sequence task used here may be more comparable to a more complex form of
object-quality discrimination learning set known as conditional discrimination. In conditional
discriminations, the reward value of a particular object depends on some other associated
attrib-ute, such as the color of the background (e.g. tray) on which it was presented. Similarly, the
re-ward value of any particular odor in the 2-sequence task depended on its presentation position. In
conditional discriminations also effectively contain built-in reversals, as do the 2-sequence tests,
e.g. sometimes squares on blue trays (or the odorant rosemary in position 2) can be rewarded and
sometimes not.
EN6 - Protocol effects on learning and memory tasks
! Of note, aside from strain-dependent effects (e.g. see (Paradee et al., 1999)), replication of
some of the subtle differences reported in FX mouse cognitive tests appears to be dependent on
aspects of protocol that would not seemingly directly relate to intelligence or memory. For
ex-ample, it was previously shown that differences between wt and FX mouse performance in a
classic 8-arm radial maze (RAM) task were not likely due to a profound learning deficit, since
the early “memory” differences could be eliminated by a protocol change (“strong choice”)
which required the mice to stop to choose a door, rather than allowing impulsive choices early in
the task (Yan et al., 2004). Diminished impulse suppression was subsequently shown to have a
dramatic effect on the error rate of FX mice in tasks measuring attention (Moon et al., 2006).
! The ability of mice to suppress responses to spatial cues might also have a significant effect
on performance of mice in olfactory-based matching tasks. To further examine this issue, we
have compared wt and FX male mice (on the FVB/NJ strain background beginning at 3 months
of age) in an olfactory task we designed for use in an 8-arm radial maze. The testing included
both win-stay components and changes of correct odorant (“reversals”). When a single exposure
arm was employed followed by the mouse having to choose from among four test arms (see Fig.
12S, below), the FX mice were able to learn as effectively as the wt mice (Fig. 14S). However,
when the test was altered such that odorants were first presented from one of four different arms
Nor could they successfully perform the task when each of the four exposure arms had the same
spice odorant. The four exposure door tests included the mice which had already successfully
learned to perform the same task from the single exposure arm. Therefore, it appeared that the
mice (wt and FX) were not assessing the odorants marking each test door on each trial, as would
be required when the exposure arms were changing on each trial. (FVB/NJ mice are blind as
adults, so a visual spatial map would not be produced). However, when the exposure arm was in
a fixed position, the mice could learn the relative spatial position of the odor-marked test doors
over a number of trials, and thereby improve their performance. In these particular tests,
thefore, the wt mice were not obviously more attentive than the FX mice to odorant cues. These
re-sults serve to emphasize the significant impact that apparatus design can have on mouse learning
performance. Indeed, it should be noted that in some cognitive studies, FX mice apparently
out-performed wt mice (e.g. see (Fisch et al., 1999)).
! In the work presented here, there was never any observation that FX mice on average
per-formed better or worse than wt mice. However, a recent study of olfactory discrimination
learn-ing uslearn-ing a “runway” design did find an elevated error rate by FX mice (Larson et al., 2008). The
olfactory runway task required water-restricted mice to choose a water-rewarded scent and avoid
an unrewarded one. After obtaining criterion for percent correct choice score over twenty trials,
the odor pair would be changed. Therefore, the olfactory runway test was a win-stay, lose-shift
task which required mice to learn to stay with the odor providing a reward. A win-stay, lose-shift
task for human subjects would generally be considered easier to learn than the more complex,
memory intensive task used in this 2-sequence study. This raises the question of why FX mice
! Among the differences in protocol between the runway and present tests were trial number
per day (12-13 in this study vs. 40 for the runway task) and housing (singly here vs. 3-4 mice per
cage for the runway task). Increased trial number could have led to increased attentional
de-mands with consequent increased FX error rates (Moon et al., 2006). Furthermore, housing
dif-ferences may have led to motivational variation among the mice. In the studies presented here,
daily monitoring of the weight of each food-restricted mouse was very important. Mouse body
weights were not perfectly stable on the defined calorie diets used (footnote 1, below),
necessi-tating on going adjustments of calorie intake. As mice gained weight, they were less hunger
mo-tivated and often apparently content to “game” the task, e.g. by making a repetitive spatial choice
until rewarded. When mice became too low in weight and thereby very hungry, they often
be-came highly agitated and made rapid choices with an elevated error rate. The latter was
particu-larly true for the FX mice. By food or water restricting mice in groups, more dominant mice
could obtain more sustenance per day than less dominant mice. As a result, more dominant mice
would have less motivation to perform, particularly for tasks with large numbers of trials as in
the runway task. Conversely, the least dominant mice can become too agitated from hunger or
thirst to perform adequately. Therefore, we do not believe it would have been possible to food
restrict our mice in groups and retain a consistent amount of motivation and calmness (ability to
attend to the task).
! In the olfactory runway studies it was observed that for wild-type and FX mice, “errors
were preceded by errors less often than expected” (Larson et al., 2008). This could be consistent
with mice losing motivation, e.g. upon receiving a reward, not feeling the need to further attend
port became rewarded again (a reasonable strategy if the subject was not trying to maximize
re-ward intake. See also footnote 2 below.) Another potential sign of elevated agitation or
inade-quate motivation was that FX mice had 50% more no-response trials than wild type in the
run-way tests. Therefore, it seems consistent with our observations that inadequate motivation (e.g.
from thirst), or possibly elevated agitation from too much thirst, or both, led the mice to olfactory
runway sessions with elevated errors (what we here would term “slumps”). Of the two
possibili-ties, our experience would suggest that low water was a greater factor, since we would expect
this to produce a more FX-specific effect on agitation, consistent also with observations that FX
mice have reduced impulse control (Moon et al., 2006). Therefore, we would predict that
proto-col changes to address motivation and emotional arousal, e.g. from variable water intake, could
reduce the genotypic differences seen. One obvious means to accomplish this would be to singly
house the subjects and individually monitor water intake (footnote 3, below).
! Nevertheless, the olfactory runway study serves to emphasize that mutation of the Fmr1
gene can have behavioral consequences in mice. As shown with the “strong choice” 8-arm radial
maze task, behavioral differences can be revealed or masked with seemingly minor protocol
changes (Yan et al., 2004). However, it is unlikely that elevated arousability, impulsivity, or
at-tention deficit could account for most of the diminished intelligence in humans with mental
re-tardation. We would not expect, for example, a treatment of the ADHD seen in many of those
with FXS to provide a substantial cure for the intellectual deficits seen in FXS. Similarly, it is
telling that conditions can be found under which FX and wild-type mice can learn to perform a
complex cognitive task in a very comparable manner; this is something that is not likely to be
There-fore, we believe that the current affirmative olfactory 2-sequence data are supportive of
essen-tially normal implicit learning and memory ability in FX mutant mice.
(1) Use of smaller unit-size, fixed calorie food has been helpful in reducing weight
fluc-tuations (e.g. 0.19 g pellets from Bio-Serve, in addition to 500 mg or 1 g. pellets).
(2) Errors were further suppressed in this study by the use of tail pinch threat/punishment
for incorrect responses.
(3) Mice may have an instinct that would induce them to try new food sources after
hav-ing just obtained sustenance from a particular location. If so, then FX mice may have had a
harder time suppressing such an instinct. This would not have been an issue in the current
study, as rewarded odors changed on each trial.
EN7 – Metacognitive deficit in Fragile X Syndrome
It is clear that conscious strategic thinking is important in human performance of
se-quence tasks of the type used in this study. Consistent with this, a primary deficit observed in
those with FXS is metacognitive, i.e. a deficit in ability to employ more sophisticated strategies
to augment basic memory functions (e.g. see Sternberg, 1986). This would not be unexpected, as
conscious, spontaneous strategy use may be seriously deficient in those with mental retardation
(Brown, 1974; Butterfield and Wambold, 1973; Vakil et al., 1997). Although those with mental
retardation were able to benefit from strategies when those were taught (Brown, 1974;
Butter-field and Wambold, 1973; Das et al., 1979), transfer of such strategy was generally poor (Ellis et
most likely produced not necessarily from a major deficit in short-term memory or from a
com-plete inability to internally rehearse, but rather from a deficit in spontaneous use of internal
re-hearsal and in the coordination of strategy steps (Butterfield and Wambold, 1973; Conners et al.,
1998).
The well-known variation in FXS IQ subtest strengths, (e.g. see Theobald, 1987), may
also reflect the degree to which implicit vs. explicit systems are involved. Non-verbal tests such
as Block Design (WISC-III) may require more strategic thinking than many verbal tests, which
rely on vocabulary, (e.g. the Peabody Picture Vocabulary Test). The real impact of FXS might be
better reflected, or at least less variable, in an IQ score comprising measures of metacognitive
thinking and strategic problem-solving dependent on explicit learning and memory functions,
rather than those based on implicit learning and memory such as vocabulary acquisition.
Lan-guage acquisition in children is thought to occur primarily by implicit means; clearly this too is
not functioning at normal levels in FXS. Nonetheless, language deficits may be expected to have
an amplified effect on metacognitive strategic thinking as compared to vocabulary, which is
crys-tallized knowledge based largely on direct associative learning.
EN8 – Impact of emphasis and punishment
Emphasis and punishment were found to have substantial effects on the new 2-sequence
task performance. The most simple explanation for the positive effect of emphasis on learning
was that it made the emphasized odorant more salient. This is supported by the various ways in
which we found that emphasis could be achieved, e.g. by repeating odor two twice or placing
ef-fect, in which one item in a list is made more salient, and therefore recalled more effectively,
than nonemphasized items residing in the same position. Such effects have been demonstrated
frequently in human studies, and have also been reported for rodents (Reed and Richards, 1996).
! Dropping punishment after two weeks of training had a dramatic negative effect on
per-formance in the 2-sequence task. It has been shown that mild tail pinch can induce greater food
consumption (Levine and Morley, 1982), so pinching may have allowed the mice to consume
more rewards. However, the mice were not pinched on most errors (Methods). Instead, it seems
more likely that the pinch, or fear of the pinch, increased the mouse’s attention to the task. (See
also EN5, above.) Controversy exists as the value of aversive stimuli in the Lovaas technique, a
form of applied behavior analysis used in the treatment of autism in humans. The data presented
here tend to support the view that such approaches may have a beneficial effect on performance,
though there remain serious questions as the ethicalness of applying aversive stimuli in human
learning.
EN9 – Brain anatomical bases for some differences in problem solving among species
Although rodents have frontal lobes with orbital prefrontal and anterior cingulate cortices
corresponding to those of primates, there is evidence to suggest that they do not have a lateral
prefrontal cortex in a form recognizable in the primates. This could be relevant here since the
lateral prefrontal cortex may be associated with alternative strategy consideration and
decision-making (Striedter, 2005). In humans, fMRI indicates that the lateral prefrontal cortex is involved
in the maintenance and manipulation of information in working memory, including in n-back
1999). Interestingly, neuroimaging during a serial reaction time test showed that the dorsolateral
prefrontal cortex of humans became activated as the subjects became aware of the sequence
(Grafton et al., 1995). Thus, rodents might have different problem solving options from primates
in general, not only because of likely differences in internal labeling abilities relative to humans,
but also because of other human or primate-specific brain regions. Even among primates,
por-tions of the prefrontal cortex and networked regions such as the mediodorsal nucleus and
pulvi-nar of the thalamus, appear to have undergone substantial further evolution in humans (reviewed
in (Striedter, 2005)).
EN10 – Other reasons for relative resistance of mice to cognitive deficits in FXS
! In addition to lack in mice of important brain regions mediating some metacognitive
func-tions in humans, it has been previously proposed that the relative resistance of mice to the
nega-tive intellectual effects of FMRP loss could be due to a subtle effect on neural performance that
is much less notable in the mouse’s significantly smaller neocortex (Yan et al., 2004). Although
larger groups of wild-type and FX mice could provide increased statistical power which might
reveal a difference in performance in this task, at the very least we can conclude that no major
difference is likely, i.e. one comparable in magnitude to that observed in similar tests between
normal and FXS humans.
Artal, P., Herreros de Tejada, P., Munoz Tedo, C., Green, D. G., 1998. Retinal image quality in
Bernstein, D. A., Penner, L. A., Clarke-Stewart, A., Roy, E. j., 2003. Psychology. Houghton
Mif-flin.
Braver, T. S., Cohen, J. D., Nystrom, L. E., Jonides, J., Smith, E. E., Noll, D. C., 1997. A
para-metric study of prefrontal cortex involvement in human working memory. Neuroimage 5,
49-62.
Brown, A. L., 1974. The Role of Strategic Behavior in Retardate Memory. In: Ellis, N. R., (Ed),
International Review of Research In Mental Retardation. Academic Press, pp. 55-111.
Butterfield, E. C., Wambold, C., 1973. On the theory and practice of improving short-term
mem-ory. American Journal of Mental Deficiency 77, 654-659.
Conners, F. A., Carr, M. D., Willis, S., 1998. Is the phonological loop responsible for
intelligence-related differences in forward digit span? American Journal of Mental
Retar-dation 103, 1-11.
D'Esposito, M., Postle, B. R., Ballard, D., Lease, J., 1999. Maintenance versus manipulation of
information held in working memory: an event-related fMRI study. Brain and Cognition
41, 66-86.
Das, J. P., Kirby, J., Jarman, R. F., 1979. Simultaneous and Successive Cognitive Processes.
Aca-demic Press.
Dykens, E. M., Hodapp, R. M., Leckman, J. F., 1987. Strengths and weaknesses in the
intellec-tual functioning of males with fragile X syndrome. American Journal of Mental
Defi-ciency 92, 234-236.
Eichenbaum, H., Otto, T., 1993. Odor-guided learning and memory in rats: is it 'special'? Trends
Ellis, N. R., Deacon, J. R., Harris, L. A., Poor, A., Angers, D., Diorio, M. S., Watkins, R. S.,
Boyd, B. D., Cavalier, A. R., 1982. Learning, memory, and transfer in profoundly,
se-verely, and moderately mentally retarded persons. American Journal of Mental
Defi-ciency 87, 186-196.
Fisch, G. S., Hao, H. K., Bakker, C., Oostra, B. A., 1999. Learning and memory in the FMR1
knockout mouse. American Journal of Medical Genetics 84, 277-282.
Grafton, S. T., Hazeltine, E., Ivry, R., 1995. Functional mapping of sequence learning in normal
humans. Journal of Cognitive Neuroscience. Vol 7, 497-510.
Harlow, H. F., 1949. The formation of learning sets. Psychological Review 56, 51-65.
Harter, S., 1965. Discrimination learning set in children as a function of IQ and MA. Journal of
Experimental Child Psychology 2, 31-43.
Hodapp, R. M., Leckman, J. F., Dykens, E. M., Sparrow, S. S., Zelinsky, D. G., Ort, S. I., 1992.
K-ABC profiles in children with fragile X syndrome, Down syndrome, and nonspecific
mental retardation. American Journal of Mental Retardation 97, 39-46.
Jennings, J. W., Keefer, L. H., 1969. Olfactory learning set in two varieties of domestic rat.
Psy-chological Reports 24, 3-15.
Katz, E., Rothschild, O., Herrera, A., Huang, S., A., W., Wojciechowski, Y., Gil, A., Yan, Q.,
Bauchwitz, R., 2003. Odor Based Behavioral Tasks Confounded by Distance Dependent
Detection: Modfication of a Murine Digging Paradigm. CogPrints
Kaufman, M. E., Prehm, H. J., 1966. A Review of Research on Learning Sets and Transfer of
Training in Mental Defectives. International Review of Research in Mental Retardation 2,
123-149.
Kemper, M. B., Hagerman, R. J., Altshul-Stark, D., 1988. Cognitive profiles of boys with the
fragile X syndrome. American Journal of Medical Genetics 30, 191-200.
Larson, J., Kim, D., Patel, R. C., Floreani, C., 2008. Olfactory discrimination learning in mice
lacking the fragile X mental retardation protein. Neurobiology of Learning and Memory
90, 90-102.
Levine, A. S., Morley, J. E., 1982. Tail pinch-induced eating: Is it the tail or the pinch?
Physiol-ogy and Behavior 28, 565-567.
Levine, M., 1959. A model of hypothesis behavior in discrimination learning set. Psychological
Review 66, 353-366.
Macphail, E. M., 1982. Brain and Intelligence in Vertebrates. Clarendon Press, Oxford.
Minsky, S. K., Spitz, H. H., Bessellieu, C. L., 1985. Maintenance and transfer of training by
mentally retarded young adults on the Tower of Hanoi problem. American Journal of
Mental Deficiency 90, 190-197.
Moon, J., Beaudin, A. E., Verosky, S., Driscoll, L. L., Weiskopf, M., Levitsky, D. A., Crnic, L. S.,
Strupp, B. J., 2006. Attentional dysfunction, impulsivity, and resistance to change in a
mouse model of fragile X syndrome. Behavioral Neuroscience 120, 1367-1379.
Nigrosh, B. J., Slotnick, B. M., Nevin, J. A., 1975. Olfactory discrimination, reversal learning,
and stimulus control in rats. Journal of Comparative and Physiological Psychology 89,
Paradee, W., Melikian, H. E., Rasmussen, D. L., Kenneson, A., Conn, P. J., Warren, S. T., 1999.
Fragile X mouse: strain effects of knockout phenotype and evidence suggesting deficient
amygdala function. Neuroscience 94, 185-192.
Reed, P., Richards, A., 1996. The von Restorff effect in rats (Rattus norvegicus). Journal of
Comparative Psychology 110, 193-198.
Reid, I. C., Morris, R. G., 1993. The enigma of olfactory learning. Trends in Neurosciences 16,
17-20.
Slotnick, B., Hanford, L., Hodos, W., 2000. Can rats acquire an olfactory learning set? Journal of
Experimental Psychology: Animal Behavior Processes 26, 399-415.
Slotnick, B. M., Katz, H. M., 1974. Olfactory learning-set formation in rats. Science 185,
796-798.
Striedter, G. F., 2005. Principles of Brain Evolution. Sinauer Associates.
Vakil, E., Shelef-Reshef, E., Levy-Shiff, R., 1997. Procedural and declarative memory processes:
individuals with and without mental retardation. American Journal of Mental Retardation
102, 147-160.
Warren, J. M., 1973. Learning in Vertebrates. In: Dewsbury, D. A., Rethlingshafer, D. A., (Eds),
Comparative psychology: a modern survey. McGraw-Hill, New York, pp. 471-509.
Wischner, G. J., Braun, H. W., Patton, R. A., 1962. Acquisition and long-term retention of an
object-quality set by retarded children. [References]. Journal of Comparative and
Yan, Q. J., Asafo-Adjei, P. K., Arnold, H. M., Brown, R. E., Bauchwitz, R. P., 2004. A
pheno-typic and molecular characterization of the fmr1-tm1Cgr Fragile X mouse. Genes, Brain
Figure 12S 1-exposure door test
(A) Three month old male FVB/NJ wt and FX mice (n = 7) were food restricted to approximately 80 - 85% free-fed body weight (exact weight range for each mouse was determined by its motivation to perform and lack of agitation - see text) and then shaped to eat sugar treats (TestDiet 5TUT) from the terminal runway cups of an 8-arm radial maze. An exposure arm contained one replaceable “odor card” with one of the four spices on it. After the subject mouse smelled the spice in the exposure arm, the four test doors were opened. (B) The central arena had four test doors with a well in front of each containing a different spice. The mouse had to learn to match the spice in the expo-sure arm to the same spice in the cup outside of one of the test doors. If the correct arm was entered, the mouse could retrieve a food reward. If an incorrect arm is entered, the mouse received a 30 - 60 second time out in the arm.
A
B
Figure 13S 4-exposure door test
1 exposure door - wt v ko2
R2 = 0.0384 R2 = 0.5308
0.00 0.10 0.20 0.30 0.40 0.50 0.60 0.70 0.80
1 3 5 7 9 11 13 15 17 19 21 23
blocks of 8 tests
fraction correct
ko2 wt
Linear (ko2) Linear (wt)
Figure 14S 1-exposure door results
4 exposure door - wt v ko2
R2 = 0.0153
R2 = 0.0323
0.00 0.10 0.20 0.30 0.40 0.50 0.60 0.70 0.80
1 3 5 7 9 11 13 15 17 19 21
blocks of 8 tests
fraction correct
ko2 wt
Linear (ko2) Linear (wt)
Figure 15S 4-exposure door results