83
Volume LIX 10 Number 1, 2011
EXPLORATORY ANALYSIS OF DYNAMICS OF
FREQUENCY DISTRIBUTION OF RAW COW MILK
QUALITY INDICATORS IN THE CZECH REPUBLIC
O. Hanuš, L. Janů, J. Schuster, J. Kučera, M. Vyletělová, V. Genčurová
Received: August 9, 2010
Abstract
HANUŠ, O., JANŮ, L., SCHUSTER, J., KUČERA, J., VYLETĚLOVÁ, M., GENČUROVÁ, V.: Exploratory analysis of dynamics of frequency distribution of raw cow milk quality indicators in the Czech Republic. Acta univ. agric. et silvic. Mendel. Brun., 2011, LIX, No. 1, pp. 83–100
A consistent link of the raw milk quality (RMQ) to the farmer price is essential. The aim was to analyse the properties of milk quality indicators (MQIs) and propose a new synthetic relative MQI (SQSM) from among various individual MQIs. SQSM could serve for consistent inclusion each quality change into the price. The paper was focused on exploratory analysis (normality (N) testing of fi les of MQIs). On the basis of the results, the MQIs were divided into two groups without and with necessity of origi-nal data transformation (TRN). Log and Box–Cox TRNs were tested in terms of possibilities of the fi les approach to the normal data frequency distribution (FD). The compositional MQIs deviated less and health and hygienic MQIs more from normal FD in original data (P < 0.05). The TRNs approached the data fi les to N very markedly in health and hygienic MQIs. The synthesis of various values of MQIs into SQSM was proposed. SQSM values were derived from model fi le of real data about MQIs and val-idated for use at farmer milk price modifi cations by the normality FD test. 33.3% of month SQSM fi les were normal (P > 0.05), the other were very close to the N with negligible deviations. The useability of the SQSM system for the balancing of raw milk purchase price premiums and penalties was tenta-tively confi rmed.
dairy cow, raw milk, bulk sample, milk quality indicator, exploratory analyse, data frequency distri-bution
The raw milk quality (RMQ) is a crucial factor of the dairy food chain safety (Vyletělová et al., 1999, 2000 and 2001; Cempírková and Thér, 2000; Cempírková, 2001, 2002 and 2007; Hanuš et al., 2004 a). The reg-ular RMQ control system satisfi es the important so-cial order (Baumgartner et al., 2000). Therefore the current RMQ investigation and its payment are very important measures. It was confi rmed by the results of the authors Deneke et al., (2004). They concluded that farms with service agreements about their milk-ing plants had lower tank cell counts, higher RMQ and lower losses due to penalization. The positive development of cow RMQ, which was caused due to the legislative changes of the milk quality indi-cators (MQIs) discrimination limits, was compared during the period of ten years in the Czech
Repub-lic (CR). The expressive improvement was observed both compositional and especially health and hy-gienic indicators (Janů et al., 2007). E. g. the arith-metical means of the total mesophilic bacteria count (TMBC) were 203.8 ths.ml−1 in 1994 and 44.5 ths.ml−1
in 2003 (today 37.4 ths.ml−1). A treble reduction was
relatively 78.2 (2003) and 81.6% (today). A ten times as numerous reduction in the coli bacteria count was found. Also the decrease of the occurrence frequency in the inhibi tory substance residues from 0.64 to 0.24% (today 0.17%) was very important. A stagnation was stated in somatic cell count (SCC, x = 272 and xg = 228 ths.ml−1 in 1994; x = 252 and xg
= 230 ths.ml−1 in 2003). The current RMQ is quite
is nearing the quality in the dairy developed coun-tries with small dairy cow herds (Hanuš et al., 2003). The relationships among occurrences of diff erent risky microorganism groups in the various organic materials (feed, raw milk, excrements) at the agricul-tural beginning of milk food chain were evaluated in other paper (Hanuš et al., 2004, a) including the good absolute results under average conditions of model farms in the CR. A reserve for the next improvement of the RMQ is particularly in the SCC in the CR. De-spite this fact it can be stated that the milk produc-tion and processing chain is probably the safest of those considered for comparison (Hanuš et al., 2004, b). It was confi rmed by a monitoring result in Ger-many as well. According to the offi cial survey re-sults it was stated (circular of AFEMA, Baumgart-ner and Schuster, 2005) that milk and milk products pertained to the safest food on the market. The gen-eral aspects of quality in market chains were defi ned by Titchener (1998). Kvapilík (1997, 2004, 2005 a, b), Wet (1998), Hamann (2002), Bossuyt (2003) and Kvapilík and Střeleček (2003) were concerned with questions of the payment of raw cow milk in accor-dance with its quality or economy. It means with a link of the purchase price to the values of the MQIs in diff erent point of views. E. g. in terms of the rules and links of the farmer price construction according to supplier-processor contracts, which are the main instruments for the RMQ growth. Some of the rules are in other publication (Dairy Crest, 2002). Some materials (Hanuš, 2000; Janů et al., 2005, 2007; Hanuš
et al., 2007) were concerned with the problem of the possibility of creating a new, consistent, synthetic, relative quality indicator of raw cow milk for every change of its quality to be taken into account in the purchase price. For a further improvement of MQIs a consistent link of the RMQ to the farmer price is essential. This fact was o en underestimated in the CR during last time (Hanuš, 2000; Janů et al., 2005 and 2007; Hanuš et al., 2007).
Aim of the work
The aim of this work is to prepare a basis for for-mulation possibility of construction rules of an evalua tion algorithm, which will be able to syn-thetize the diff erent MQIs into one relative quality value. Further, the aim of the mentioned algorithm will be to create a new synthetic relative RMQ indi-cator (SQSM) from among various individual MQIs, which will be consistently able to include each of the quality changes into the price. It has to be fl ex-ible in terms of number of the possibly included MQIs. Therefore, an analysis of the properties and behaviour of the MQIs during the period is neces-sary. That is reason, why this work was focused on statistical exploratory analyse of the one-dimen-sional data sets about real MQIs in terms of their dy-namics evaluation of data frequency distribution (FD). Such a kind of evaluation has not been per-formed in the CR up to now. Nevertheless, any study about FD of MQIs for purposes of the obtaining of knowledge and subsequently construction rules
of a synthetic RMQ indicator is not known as well. In general, the existence of hypothesis about men-tioned synthetic RMQ indicator was allowed due to milk analytical methods and statistical methods expansion during last time. Possible application of SQSM system in the practice could improve objec-tivity of milk payment according to its quality and in this way support higher quality more consistently as compared to today circumstances. The work was carried out in terms of further promotion of the milk food chain safety as well as for the improve-ment of the competitive ability of the dairy produc-tion branch.
MATERIAL AND METHODS
Evaluated set of bulk milk samples
The bulk milk samples (MSs) of a large data set were regularly obtained (once or several times per month) from commercial dairy herds for the RMQ determination (mostly according to the stan-dard CSN 57 0529) within the framework of the of-fi cial milk payment system during twelve calendar months of 1994 and 2003. The MSs were treated by a low temperature of about 6 °C and immediately transported to the accredited milk laboratory. Some of them were preserved, some of them not, but the MSs were generally analysed in accordance with the relevant standard operation procedures of the ac-credited laboratory. The MSs came from both of the milked populations of the dairy cows in the country, Holstein and Czech Fleckvieh. There were investi-gated diff erent numbers of MSs for diff erent MQIs. The maximum sample number was for milk freez-ing point and some other MQIs (n = 72 607) and the minimum for free fatty acids (n = 11 540). The data sets of 1994 and 2003 were a slightly diff erent as to the MQIs, which are regularly measured. E. g. the ca-sein content was measured and whey protein con-tent calculated in 2003 only similarly the free fatty acid concentrations.
Legislation aspects of standards for raw cow milk quality
In general, the discrimination limit values ac-cording to the valid standards (EEC 92/46; Regula-tion 853/2004 and CSN 57 0529) were used for the purposes of evaluations and comparisons of the raw MQIs in this work. During the mentioned pe-riod the legislative discrimination limit for the SCC was changed. That was made with the limit <400 ths.ml−1 being valid for the fi rst quality class by the
end of 1994 (there also existed a lower class for the <500 ths.ml−1 standard quality). From the
begin-ning of 1995 the limit <400 ths.ml−1 was already valid
were also lower classes of quality (II <800 and III < 2 000 ths.CFU.ml−1). From the beginning of 1995 the
limit <100 ths.CFU.ml−1 was valid for the fi rst class of
quality and from 1998 already for the allover stan-dard RMQ (CSN 57 0529).
Investigated MQIs with their abbreviations and units
With tested MQIs that were measured and calcu-lated the following listed abbreviations and units have been used: F milk fat content (g.100ml−1; %);
L lactose content (monohydrate; g.100g−1; %); SNF
solids non fat content (g.100g−1; %); DM dry matter
(g.100g−1; %; calculated indicator); CP crude protein
(total N×6.38; g.100g−1; %); CAS casein (casein N×6.38;
g.100g−1; %); WP whey protein content (g.100g−1; %;
calculated indicator); MFP milk freezing point (°C or m°C × (−1)); SCC somatic cell count (ths.ml−1); F/CP
ratio between fat and crude protein, calculated indi-cator of nitrogen/protein metabolism of dairy cow herd; U urea concentration (mmol.l−1); SHtitratable
acidity (in ml 0.25 mol.l−1 NaOH solution); FFA
con-centration of milk fat free fatty acids (mmol.100g−1);
TMBC total mesophilic bacteria count (ths.CFU. ml−1); CBC coli bacteria count (CFU.ml−1); TRBC
thermoresistant bacteria count (CFU.ml−1); PBC
psy-chrotrophic bacteria count (CFU.ml−1); RIS
occur-rence frequency of residues of inhibitory substances (%; antibiotic drugs occurrence); MFA milk fermen-tation ability by dairy noble culture (Rx, Lactobacil-lus bulgaricus and Streptococcus thermophillus, in ml 0.25 mol.l−1 NaOH solution).
Used milk analytical methods
Chemical and physical methods and also indirect instrumental methods
The MFPs were measured by the two analytical methods. The fi rst was carried out with MilkoScan 6000 system (Foss Electric, Denmark). This was ad-justed according to the reference cryoscopic method results in regular intervals. It means an alternative measurement of the milk freezing point equivalent. The other measurement procedure was performed by the own cryoscopic method, which was the in-strument Cryo-Star automatic Funke-Gerber (Ger-many). The mentioned procedure was reali zed with that part of the analysed MSs that showed suspi-cious values by the fi rst measurement method. The selected measurement mode was reference Plateau Search in this case. The used instrument was un-der regular calibration by the standard NaCl solu-tions and regularly took part in the national analyt-ical profi ciency testing with successful results. The work was performed according to CSN 57 0538. The incidental interference eff ects were monitored. The other investigated MQIs, such as the F, L, CP, CAS, DM, SNF, U, FFA, were measured by the instrument MilkoScan 6000 (Foss Electric, Denmark; MIR-FT mid infra red spectrophotometric apparatus with mathematical evaluation of the whole IR
spec-trum by means of Fourier’s transformations), which was regularly calibrated according to the refe rence method results (standard CSN 57 0536, by Gerber’s method for fat content, Kjeldahl’s method for crude protein content and polarimetric and gravimetric methods for lactose and SNF contents, according to the standard CSN 57 0530; for U and FFA according to the direct ureolytic, photometrical and titration method results). The SCC was determined by the Fossomatic instrument (Foss Electric, Denmark) ac-cording to the standard CSN EN ISO 13366-3. Both the previously mentioned instruments took part in the relevant national profi ciency testing with regu-larly good results. The TMBC was determined by the Bactoscan 8000 instrument (Foss Electric, Den-mark) under similar conditions as with the previ-ous apparatus. The Bactoscan was continuprevi-ously cal-ibrated according to results of the plate cultivation for TMBC. The colonies of mesophilic bacteria spe-cies were counted a er their growth for 72 h. of in-cubation at 30 °C (CSN 57 0101).
Microbiological cultivation methods The residues of inhibitory substances were inves-tigated by the reaction of the Delvo-Test method, which is performed on the basis of the growth of test microbial strain Bacillus stearothermophilus var.
calido lactis. The other microbiological MQIs (CSN 57 0101, CSN ISO 6730, CSN ISO 4832) were also investigated in an accredited testing laboratory. All these MQIs are formulated in CFU.ml−1: TRBC, PBC,
CBC. The GTK-M Agar (Milcom Tábor) was used as a cultivation medium for PBC and TRBC determina-tion. The VRLB Agar (Milcom Tábor) was used for CBC cultivation. The temperature/time combina-tions of the microbiological cultivation condicombina-tions were 6.5 °C/10 days for PBC, 30 °C/72 hours a er previous MS inactivation by heating at 85 °C for 10 min. for TRBC and 36 °C/24 h. for CBC.
Performed statistical procedures
(vali-dated, but no standardized, NST). The data fi les II (validated and standardized, ST) were obtained due to the limitation of MQIs values by valid standard limits (CSN 57 0529), it means due to the standard-ization (STN). The statistical evaluation of the data fi les was performed separately for the individual cal-endar months because of the generally valid model of the month payment system for raw milk. The main statistical characteristics, such as the arithmeti-cal (x) and geometriarithmeti-cal mean (xg), standard deviation (sx) and variation coeffi cient (vx), were calculated for the month data fi les. If necessary, the MQIs (SCC and microbiological indicators in this case) data were logarithmically transformed (log10) before the evaluation of the main statistical characteri stics and their mutual relationships because of no presump-tion of the normal data FD (Ali and Shook, 1980; Shook, 1982; Reneau, 1986; Meloun and Mili tký, 1994; Kupka, 1997; Hanuš et al., 2001). Box-Cox (BC) transformation (TRN) was tested as well. The FD normality of the values of the MQIs data fi les was tested in terms of their normality by the Q and Q-Q graphs in the framework of the exploratory analysis (Meloun and Militký, 1994; Kupka, 1997). The third and fourth central statistical moments of the MQIs data fi les, it means the obliqueness (a3) and
acute-ness (excess, a4) were tested. The synthetic SQSM in-dicator was calculated on the basis of the own pre-vious and here performed research according to following formulas: DX = (IND − x)/sx, where: IND is individual value of MQI of supplier, x is month arithmetical average of MQI of all milk suppliers and sx its standard deviation; SQSM is the average: sum of right oriented (according to RMQ growth) DXs of MQIs of identical raw milk delivery divided by the relevant number of MQIs. The eight chosen most frequent and important MQIs were included as combination into SQSM calculation: F, CP, SNF, MFP, log SCC, log TMBC, log CBC (last three as transformed MQIs, TRN), RIS. The weights of the used MQIs were same, it means no preference for
some of the MQIs. FD of month fi les of SQSM indi-cator (2003) was investigated by exploratory analysis as well. In general a lot of statistical tests were per-formed. It is not possible to demonstrate all the re-sults by fi gures here. All year months were used for a demonstration (tables and fi gures) of the obtained results only in the most important MQIs and in the cases of most important phenomenons.
RESULTS AND DISCUSSION
General result description of the raw milk quality
As mentioned above, the RMQ was improved dur-ing the reference period. The negligible deviations between arithmetical means and medians of month data fi les of compositional MQIs and indispensable in hygienic MQIs were found in the previous paper (Janů et al., 2007). The logarithmic and BC data trans-formations decreased these deviations markedly es-pecially in health and hygienic MQIs. An explor-atory analysis of one-dimensional data fi les of MQIs was shown as necessary.
Exploratory analysis according to individual MQIs
SNF: month tests a3 and a4 mostly diff ered from standard normal FD (P < 0.05), but the deviations were practically negligible, a4 values were o en near
to 3 (Tab. I), therefore TRN is not necessary; STN (II) mostly turned over the a3 from righthand to le -hand asymmetry (A); the month FD of data fi les are similar between years 1994 and 2003. CP: the rate of a3 FD normal fi les increased during reference period
(1994–2003); deviations from normality (N; P < 0.05) were negligible (Tab. I); the infl uence of STN (II) was small; TRN is not necessary. F: all fi les (1994 and 2003, Tab. I, Fig. 1 1−12, I and II) diff ered from nor-mal FD (P < 0.05); changes between years were snor-mall;
I: The normality evaluation of raw milk data fi les
Fat, Set I, 2003 Fat, Set I, 1994
normality normality
month a3 a4 a3 a4 month a3 a4 a3 a4
1 0.26 5.66 no no 1 −1.14 3.90 no no
2 0.26 5.5 no no 2 −0.84 2.12 no no
3 0.34 5.03 no no 3 0.27 4.45 no no
4 0.48 4.79 no no 4 0.21 4.73 no no
5 0.35 5.1 no no 5 0.26 4.71 no no
6 0.21 5.64 no no 6 0.31 4.51 no no
7 0.23 4.33 no no 7 0.17 4.57 no no
8 0.16 4.66 no no 8 0.27 5.06 no no
9 0.29 4.82 no no 9 0.19 4.77 no no
10 0.30 5.28 no no 10 0.14 4.52 no no
11 0.40 5.22 no no 11 0.17 4.41 no no
CP, Set I, 2003 CP, Set I, 1994
normality normality
month a3 a4 a3 a4 month a3 a4 a3 a4
1 0.00 3.67 yes no 1 0.33 3.85 no no
2 −0.09 3.75 no no 2 0.43 3.94 no no
3 −0.06 3.76 no no 3 0.44 4.03 no no
4 −0.05 3.89 no no 4 0.42 4.09 no no
5 −0.11 3.99 no no 5 0.15 4.16 no no
6 −0.02 3.79 no no 6 0.08 4.07 no no
7 0.06 3.60 no no 7 0.02 3.90 yes no
8 0.12 3.67 no no 8 0.07 3.75 no no
9 0.10 3.74 no no 9 0.09 3.88 no no
10 0.07 3.73 no no 10 0.14 3.85 no no
11 0.06 3.75 yes no 11 0.24 4.11 no no
12 0.07 3.94 no no 12 0.38 4.03 no no
Lactose, Set I, 2003 Lactose, Set I, 1994
normality normality
month a3 a4 a3 a4 month a3 a4 a3 a4
1 −0.77 4.70 no no 1 −0.43 4.05 no no
2 −0.69 4.53 no no 2 −0.53 4.60 no no
3 −0.69 4.43 no no 3 −0.57 4.31 no no
4 −0.71 4.51 no no 4 −0.61 4.07 no no
5 −0.63 4.32 no no 5 −0.44 4.36 no no
6 −0.52 4.62 no no 6 −0.51 4.59 no no
7 −0.63 4.72 no no 7 −0.37 4.17 no no
8 −0.68 4.65 no no 8 −0.44 4.25 no no
9 −0.76 4.57 no no 9 −0.48 4.27 no no
10 −1.04 5.49 no no 10 −0.40 4.16 no no
11 −0.84 4.85 no no 11 −0.53 4.48 no no
12 −0.52 3.79 no no 12 −0.62 4.44 no no
SNF, Set I, 2003 SNF, Set I, 1994
normality normality
month a3 a4 a3 a4 month a3 a4 a3 a4
1 −0.33 3.81 no no 1 −0.99 3.69 no no
2 −0.38 3.93 no no 2 0.05 3.87 yes no
3 −0.36 3.87 no no 3 −.005 3.70 yes no
4 −0.42 3.78 no no 4 −0.07 3.88 no no
5 −0.28 3.86 no no 5 −0.17 4.02 no no
6 −0.22 3.60 no no 6 −0.23 3.82 no no
7 −0.20 3.61 no no 7 −0.26 3.58 no no
8 −0.23 3.36 no no 8 −0.19 3.61 no no
9 −0.28 3.76 no no 9 −0.21 3.68 no no
10 −0.30 3.78 no no 10 −0.12 3.62 no no
11 −0.23 3.66 no no 11 −0.17 3.72 no no
MFP, Set I, 2003 MFP, Set I, 1994
normality normality
month a3 a4 a3 a4 month a3 a4 a3 a4
1 −0.55 5.97 no no 1 0.43 4.25 no no
2 −0.35 5.50 no no 2 −0.55 4.16 no no
3 −0.36 5.97 no no 3 −0.74 4.96 no no
4 −0.41 5.97 no no 4 −0.27 4.22 no no
5 −0.36 6.11 no no 5 −0.46 4..68 no no
6 0.01 7.84 yes no 6 −0.41 4.29 no no
7 −0.03 7.46 yes no 7 −0.51 4.41 no no
8 0.18 6.60 no no 8 −0.51 4.24 no no
9 0.04 6.59 yes no 9 −0.51 4.51 no no
10 −0.27 5.68 no no 10 −0.45 4.32 no no
11 −0.39 7.14 no no 11 −0.42 4.62 no no
12 −0.36 6.73 no no 12 −0.54 4.34 no no
Urea, Set I, 2003 Casein, Set I, 2003
normality normality
month a3 a4 a3 a4 month a3 a4 a3 a4
1 0.09 2.18 no no 1 −0.06 3.69 yes no
2 −0.01 2.21 yes no 2 −0.12 3.71 no no
3 0.34 3.06 no yes 3 −0.09 3.77 no no
4 0.01 2.24 yes no 4 −0.14 3.83 no no
5 0.06 2.21 yes no 5 −0.09 4.00 no no
6 0.04 2.29 yes no 6 −0.03 3.79 yes no
7 0.02 2.33 yes no 7 0.06 3.59 yes no
8 −0.01 2.31 yes no 8 0.08 3.60 no no
9 0.00 2.27 yes no 9 −0.27 3.47 no no
10 −0.03 2.26 yes no 10 0.03 3.73 yes no
11 0.03 2.13 yes no 11 −0.01 3.82 yes no
12 0.25 2.51 no no 12 −0.75 3.99 no no
SCC, Set II, 2003 SCC, Set II, 1994
normality normality
month a3 a4 a3 a4 month a3 a4 a3 a4
1 0.18 2.34 no no 1 0.18 2.18 no no
2 0.05 2.27 yes no 2 0.15 2.17 no no
3 0.06 2.24 yes no 3 0.16 2.2 no no
4 −0.02 2.27 yes no 4 0.14 2.16 no no
5 −0.02 2.14 yes no 5 0.09 2.12 no no
6 −0.21 2.24 no no 6 0.001 2.12 yes no
7 0.01 2.05 yes no 7 −0.13 2.09 no no
8 −0.27 2.21 no no 8 −0.12 2.06 no no
9 −0.14 2.22 no no 9 0.03 2.16 yes no
10 −0.03 2.35 no no 10 0.05 2.16 yes no
11 −0.01 2.37 yes no 11 −0.05 2.19 yes no
SCC, Set I, 2003 SCC, Set I, 1994
normality normality
month a3 a4 a3 a4 month a3 a4 a3 a4
1 2.17 13.91 no no 1 2.11 11.65 no no
2 2.15 13.06 no no 2 2.22 11.95 no no
3 1.61 9.12 no no 3 2.13 12.02 no no
4 1.75 10.33 no no 4 2.01 11.11 no no
5 3.49 36.32 no no 5 2.23 12.96 no no
6 1.89 10.33 no no 6 1.89 10.31 no no
7 1.9 10.86 no no 7 1.65 8.19 no no
8 1.71 9.76 no no 8 1.70 8.46 no no
9 2.07 12.73 no no 9 1.97 10.39 no no
10 2.3 14.3 no no 10 2.19 12.23 no no
11 2.21 12.67 no no 11 2.11 11.58 no no
12 2.29 14.63 no no 12 1.81 5.42 no no
TMBC, Set II, 2003 TMBC, Set II, 1994
normality normality
month a3 a4 a3 a4 month a3 a4 a3 a4
1 1.97 6.95 no no 1 0.46 2.07 no no
2 2.02 6.96 no no 2 0.45 2.34 no no
3 2.01 6.77 no no 3 0.28 2.06 no no
4 1.96 6.53 no no 4 0.28 2.00 no no
5 1.46 4.38 no no 5 0.12 1.99 no no
6 1.26 3.70 no no 6 0.26 1.97 no no
7 1.63 5.20 no no 7 0.06 1.96 yes no
8 1.52 4.61 no no 8 0.28 1.99 no no
9 1.68 5.31 no no 9 0.24 1.98 no no
10 1.96 6.79 no no 10 0.24 2.02 no no
11 1.46 4.47 no no 11 0.19 1.98 no no
12 1.68 5.41 no no 12 0.26 2.02 no no
TMBC, Set I, 2003 TMBC, Set I, 1994
normality normality
month a3 a4 a3 a4 month a3 a4 a3 a4
1 14.55 245.70 no no 1 7.53 71.99 no no
2 13.86 239.17 no no 2 7.07 60.52 no no
3 13.39 221.63 no no 3 6.65 50.70 no no
4 13.55 227.96 no no 4 7.27 63.44 no no
5 11.38 160.91 no no 5 5.57 36.69 no no
6 11.65 166.19 no no 6 6.32 48.08 no no
7 11.91 174.91 no no 7 5.27 33.01 no no
8 12.56 193.87 no no 8 6.51 51.18 no no
9 13.39 213.02 no no 9 6.97 57.59 no no
10 14.64 256.34 no no 10 8.22 81.94 no no
11 12.39 189.35 no no 11 8.17 82.24 no no
STN led to the longer distance from N; the fi les were gently le -hand as a rule; TRN is not necessary. L: all fi les with right-hand A diff ered from normal FD (Tab. I; P < 0.05), however, deviations were negli-gible; STN was not carried out; 2003 fi les (I) were more oblique; TRN is not necessary. CAS: all fi les
2003 (I) diff ered from normal FD (P < 0.05) in a4 but
some of them were normal in a3; diff erences were minimal with irregularities about right and le -hand A (Tab. I; Fig. 1). MFP: all fi les 1994 (I and II) and 2003 (II) were diff erent from N (Tab. I; P < 0.05),
PBC, Set I, 2003 PBC, Set I, 1994
normality normality
month a3 a4 a3 a4 month a3 a4 a3 a4
1 5.14 35.17 no no 1 7.06 77.17 no no
2 10.38 122.22 no no 2 5.55 44.08 no no
3 2.18 11.46 no no 3 6.26 56.75 no no
4 8.59 90.11 no no 4 10.64 157.98 no no
5 5.5 37.67 no no 5 6.86 7.33 no no
6 6.83 53.73 no no 6 7.21 73.88 no no
7 5.59 43.94 no no 7 5.48 40.49 no no
8 4.99 29.49 no no 8 7.34 79.02 no no
9 6.6 55.21 no no 9 6.39 59.39 no no
10 10.47 117.38 no no 10 7.53 79.60 no no
11 1.97 6.25 no no 11 8.26 102.55 no no
12 4.95 31.6 no no 12 14.51 310.14 no no
F fat (g.100ml−1; %); L lactose (%); SNF solids non fat (%); DM dry matter (%); CP crude protein (%); CAS casein (%); WP whey protein (%); MFP milk freezing point (°C or m°C × (−1)); SCC somatic cell count (ths.ml−1); F/CP ratio between fat and crude protein; U urea (mmol.l−1); SHtitratable acidity (in ml 0.25 mol.l−1 NaOH solution); FFA milk fat free fatty acids (mmol.100g−1); TMBC total mesophilic bacteria count (ths.CFU.ml−1); CBC coli bacteria count (CFU.ml−1); TRBC thermo-resistant bacteria count (CFU.ml−1); PBC psychrotrophic bacteria count (CFU.ml−1); MFA milk fermentation ability (in ml 0.25 mol.l−1 NaOH solution).
Q graph - Fat, August 2003, Set I
-6 -4 -2 0 2 4 6
0 0.2 0.4 0.6 0.8 1.0 1.2
Pi
ui
real data theoretical curve
Q-Q graph - Fat, August 2003, Set I
-6 -4 -2 0 2 4 6
-4 -3 -2 -1 0 1 2 3 4
ĭ-1 (Pi)
ui
real data theoretical line
Q graph - Casein, November 2003, Set I
-5 -4 -3 -2 -10 1 2 3 4 5
0 0.2 0.4 0.6 0.8 1.0 1.2
Pi
ui
real data theoretical curve
Q-Q graph - Casein, November 2003, Set I
-5 -4 -3 -2 -1 0 1 2 3 4 5
-4 -3 -2 -1 0 1 2 3 4
ĭ-1 (Pi)
ui
Q graph SCC, November 2003, Set I
-4 -2 0 2 4 6 8 10
0 0.2 0.4 0.6 0.8 1.0 1.2
Pi
ui
real data theoretical curve
Q-Q graph SCC, November 2003, Set I
-4 -2 0 2 4 6 8 10
-4 -3 -2 -1 0 1 2 3 4
ĭ-1 (Pi)
ui
real data theoretical line
Q graph SCC, November 2003, Set II
-4 -3 -2 -1 0 1 2 3 4
0 0.2 0.4 0.6 0.8 1.0 1.2
Pi
ui
real data theoretical curve
Q-Q graph SCC, November 2003, Set II
-4 -3 -2 -1 0 1 2 3 4
-4 -3 -2 -1 0 1 2 3 4
ĭ-1 (Pi)
ui
real data theoretical line
Q graph TMBC, January 2003, Set I
-5 0 5 10 15 20 25
0 0.2 0.4 0.6 0.8 1.0 1.2
Pi
ui
real data theoretical curve
Q-Q graph TMBC, January 2003, Set I
-5 0 5 10 15 20 25
-4 -3 -2 -1 0 1 2 3 4
ĭ-1 (Pi)
ui
real data theoretical line
Q graph - Urea, June 2003, Set I
-4 -3 -2 -1 0 1 2 3 4
0 0.2 0.4 0.6 0.8 1.0 1.2
Pi
ui
real data theoretical curve
Q - Q graph - Urea, June 2003, Set I
-4 -3 -2 -1 0 1 2 3 4
-4 -3 -2 -1 0 1 2 3 4
ĭ-1 (Pi)
ui
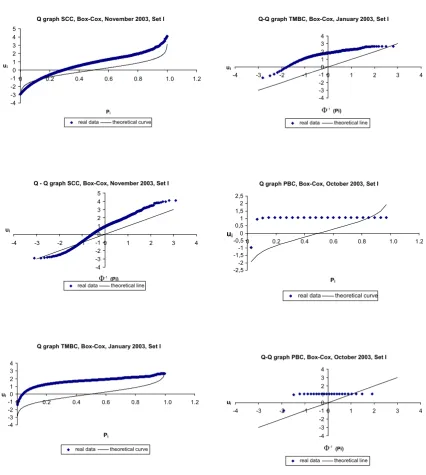
only some of month fi les 2003 (I) were normal in a3 (P > 0.05); a4 was higher in 2003 in comparison with 1994, which could have been caused by increasing of the technological discipline in raw milk produc-tion; STN turned mostly over the a3 from slightly right-hand to slightly le -hand A; TRN is not nec-essary. SCC: all nonstandard fi les (Tab. I; Fig. 1; 1994 and 2003, 1−12, I) diff ered markedly from normal FD in a3 with le -hand A and in a4 as well; STN (II) led to
better N and slightly right-hand A and a4 was
mark-edly reduced in both years; log TRN (Tab. II; Fig. 2) led to slightly right-hand A, the deviations from nor-mal FD were signifi cant, but snor-maller in compari-son with not transformed fi les, therefore TRNs are neces sary. TMBC: month fi les (Tab. I; Fig. 1; 1994 and 2003) I were markedly diff erent from N (P < 0.05) with le -hand a3 A; STN led near to N, mostly in 1994; log TRN (Tab. II; Fig. 2) led near to N, in partic-ular for a4, although the fi les still diff ered from N (P
< 0.05) mostly with slightly le -hand A, only month
Q graph FFA, December 2003, Set II
-4 -3 -2 -1 0 1 2 3 4
0 0.2 0.4 0.6 0.8 1.0 1.2
Pi
ui
real data theoretical curve
Q-Q graph FFA, December 2003, Set II
-4 -3 -2 -1 0 1 2 3 4
-4 -3 -2 -1 0 1 2 3 4
ĭ-1 (Pi)
ui
real data theoretical line
Q graph PBC, October 2003, Set I
-4 -2 0 2 4 6 8 10 12
0 0.2 0.4 0.6 0.8 1.0 1.2
Pi
ui
real data theoretical curve
Q-Q graph PBC, October 2003, Set I
-5 0 5 10 15
-4 -3 -2 -1 0 1 2 3 4
ĭ-1 (Pi)
ui
real data theoretical line 1: Q and Q-Q graphs of fat, casein, SCC, TMBC, urea, FFA and PBC data files
II: The normality evaluation of logarithmic transformed data
log SCC, Set II, 2003 log SCC, Set II, 1994
normality normality
month a3 a4 a3 a4 month a3 a4 a3 a4
1 −0.83 3.34 no no 1 −0.77 3.01 no yes
2 −0.96 0.63 no no 2 −0.80 3.07 no yes
3 −0.93 3.58 no no 3 −0.79 3.09 no yes
4 −1.00 3.77 no no 4 −0.79 3.04 no yes
5 −0.95 3.56 no no 5 −0.87 3.29 no no
6 −1.20 4.23 no no 6 −0.92 3.32 no no
7 −0.90 3.35 no no 7 −1.08 3.72 no no
8 −1.24 4.30 no no 8 −1.03 3.53 no no
9 −1.10 4.04 no no 9 −0.94 3.50 no no
10 −1.07 4.03 no no 10 −0.93 3.50 no no
11 −1.07 4.14 no no 11 −1.01 3.70 no no
log SCC, Set I, 2003 log SCC, Set I, 1994
normality normality
month a3 a4 a3 a4 month a3 a4 a3 a4
1 −0.37 3.45 no no 1 −0.30 3.14 no no
2 −0.44 3.65 no no 2 −0.29 3.24 no no
3 −0.49 3.51 no no 3 −0.31 3.20 no no
4 −0.50 3.65 no no 4 −0.34 3.15 no no
5 −0.38 3.68 no no 5 −0.33 3.35 no no
6 −0.55 3.89 no no 6 −0.41 3.29 no no
7 −0.41 3.31 no no 7 −0.51 3.45 no no
8 −0.64 3.93 no no 8 −0.49 3.55 no no
9 −0.47 3.81 no no 9 −0.37 3.38 no no
10 −0.46 3.99 no no 10 −0.34 3.46 no no
11 −0.40 3.97 no no 11 −0.38 3.59 no no
12 −0.47 3.90 no no 12 0.25 2.98 no yes
log TMBC, Set II, 2003 log TMBC, Set II, 1994
normality normality
month a3 a4 a3 a4 month a3 a4 a3 a4
1 0.30 2.27 no no 1 −0.35 2.31 no no
2 0.54 2.27 no no 2 −0.63 2.38 no no
3 0.47 2.22 no no 3 −0.79 2.87 no yes
4 0.51 2.22 no no 4 −0.73 2.82 no no
5 0.11 2.11 no no 5 −0.93 3.47 no no
6 −0.03 2.15 yes no 6 −0.73 2.89 no yes
7 0.20 2.10 no no 7 −0.99 3.60 no no
8 0.16 2.11 no no 8 −0.72 2.80 no no
9 0.24 2.12 no no 9 −0.77 2.98 no yes
10 0.36 2.23 no no 10 −0.76 2.99 no no
11 0.08 2.18 no no 11 −0.81 3.11 no yes
12 0.18 2.20 no no 12 −0.75 3.03 no yes
log TMBC, Set I, 2003 log TMBC, Set I, 1994
normality normality
month a3 a4 a3 a4 month a3 a4 a3 a4
1 1.03 5.05 no no 1 0.71 3.45 no no
2 1.14 4.64 no no 2 0.57 3.66 yes no
3 1.07 4.39 no no 3 0.50 3.72 yes no
4 1.05 4.15 no no 4 0.61 4.04 no no
5 0.76 3.81 no no 5 0.76 4.24 no no
6 0.65 3.70 no no 6 0.65 3.96 no no
7 0.87 3.99 no no 7 0.71 4.06 no no
8 0.79 3.86 no no 8 0.65 3.94 no no
9 0.92 4.31 no no 9 0.68 4.25 no no
10 1.05 4.76 no no 10 0.64 4.27 no no
11 0.79 4.12 no no 11 0.64 4.28 no no
fi les 1994 (II) showed right-hand A; TRNs are neces-sary. PBC: all fi les I in both years (Tab. I; Fig. 1) dif-fered markedly from normal FD (P < 0.001) in a3 with
le -hand A and in a4 as well; month a3 and a4 values varied very strongly; STN (II) still led to N approach with le -hand A; log TRN (Tab. II; Fig. 2) caused that all month fi les I both years had been markedly near to the N in comparison with the original data, but
log PBC, Set I, 2003 log PBC, Set I, 1994
normality normality
month a3 a4 a3 a4 month a3 a4 a3 a4
1 1.82 5.51 no no 1 −0.24 1.93 no no
2 0.64 2.55 no yes 2 −0.19 1.99 no no
3 0.93 2.77 no yes 3 −0.27 2.08 no no
4 0.90 2.61 no yes 4 −0.12 1.99 yes no
5 1.23 3.77 no yes 5 −0.21 1.98 no no
6 0.90 3.48 no yes 6 0.03 1.87 no no
7 0.80 2.57 no yes 7 −0.35 2.07 no no
8 0.45 1.94 no no 8 −0.22 2.02 no no
9 1.28 3.40 no yes 9 −0.24 1.93 no no
10 1.19 3.29 no yes 10 −0.29 2.27 no no
11 0.60 2.03 no yes 11 −0.30 2.37 no no
12 0.58 2.12 no no 12 −0.25 2.19 no no
Q-Q graph log SCC, November 2003, Set I
-4 -3 -2 -1 0 1 2 3 4
-4 -3 -2 -1 0 1 2 3 4
ĭ-1 (Pi)
ui
real data theoretical line
Q graph log TMBC, January 2003, Set I
-4 -2 0 2 4 6
0 0.2 0.4 0.6 0.8 1.0 1.2
Pi
ui
real data theoretical curve
Q-Q graph log TMBC, January 2003,Set I
-4 -2 0 2 4 6
-4 -3 -2 -1 0 1 2 3 4
ĭ-1
(Pi) ui
real data theoretical line
Q graph log PBC, October 2003, Set I
-3 -2 -1 0 1 2 3 4 5
0 0.2 0.4 0.6 0.8 1.0 1.2
Pi
ui
real data theoretical curve
Q-Q graph log PBC, October 2003, set I
-4 -3 -2 -1 0 1 2 3 4 5
-4 -3 -2 -1 0 1 2 3 4
ĭ-1 (Pi) ui
real data theoretical line
still with signifi cant diff erences; STN (II) at TRN led to further approach to the N; TRNs are necessary.
CBC: all fi les (1994 and 2003, 1−12, I) with excep-tion one in a4 were diff erent from normal FD (from P < 0.05 up to P < 0.001); STN showed approach to N with mostly right-hand A in 1994 and le -hand A in 2003; log TRN led to approach to N in all fi les (I and II), but the diff ere nces were still signifi cant (P < 0.05), but practically negligible, I and II fi les 1994 were mostly right-hand and 2003 le -hand; TRNs are necessary. TRBC: almost all fi les (1994 and 2003, 1−12, I and II) with exception of some a4 the values deviated from N (P < 0.05 and P < 0.001); STN led to approach to N; log TRN led to marked approach to N (still P < 0.05) in comparison with the original data in all fi les as well; TRNs are necessary.
U: month fi les (Tab. I; Fig. 1; 2003, I) did mostly not deviate (P > 0.05) from normal FD in a3; most devia-tions were in a4 (P < 0.05); TRNs are not needed. FFA: two month fi les (Fig. 1; 2003, I) were diff erent from
N (P < 0.05) with le -hand A of a3; STN showed
ap-proach to N; TRNs could be suitab le. SH: help fi le I (n = 76) was not diff erent from N (P > 0.05); STN led to diff erence from normal FD and turned over le -hand to right-hand A; this indicator is used for quali ty payment only occasional ly. MFA: assisted fi le I (n = 76) was diff erent from N (P < 0.05); STN showed N (P > 0.05) and turned over a3 from right-hand to le -right-hand A; despite this fact the TRNs are not necessary; this indicator is used for quality pay-ment only occasionally.
General conclusion about exploratory analysis
The exploratory analysis was performed in data MQIs (fi les I and II, 1994 and 2003). The oblique-ness (a3) and acuteness (a4) values of the data fi les of MQIs including their quantil-quantile graphs were interpreted. The compositional MQIs had usually the character of data FD, which was quite near to the N (a3 = 0 and a4 = 3). However, these small deviations III: The normality evaluation of data fi les a er Box–Cox transformation
SCC, Set I, 2003, a er Box-Cox transformation TMBC, Set I, 2003, a er Box-Cox transformation
normality Box-Cox normality Box-Cox
month a3 a4 a3 a4 para. month a3 a4 a3 a4 para.
1 0.0015 3.54 yes no 0.19 1 −0.0003 2.10 yes no −0.402
2 −0.0004 3.73 yes no 0.214 2 −0.0008 1.65 yes no −0.628
3 0.0003 3.45 yes no 0.27 3 −0.0004 1.72 yes no −0.548
4 0.0002 3.61 yes no 0.261 4 −0.0007 1.68 yes no −0.576
5 0.0006 3.53 yes no 0.233 5 0.0002 2.28 yes no −0.285
6 0.0003 3.78 yes no 0.255 6 −0.0003 2.50 yes no −0.224
7 0.00001 3.24 yes no 0.22 7 0.0008 2.13 yes no −0.345
8 0.000008 3.75 yes no 0.3085 8 0.0005 2.23 yes no −0.305
9 0.0002 3.81 yes no 0.227 9 −0.0004 2.10 yes no −0.371
10 −0.0004 4.07 yes no 0.208 10 −0.0003 1.94 yes no −0.456
11 0.0002 3.96 yes no 0.179 11 0.0001 2.44 yes no −0.276
12 0.00004 4.02 yes no 0.2175 12 −0.0008 2.28 yes no −0.324
PBC, Set I, 2003, a er Box-Cox transformation
normal. Box-Cox
month a3 a4 a3 a4 para.
1 cannot cannot – – cannot
2 −0.0070 1.61 yes no −0.60
3 0.0030 1.26 yes no −1.10
4 −0.0100 1.29 yes no −1.00
5 0.0750 1.00 yes no −4.00
6 −0.0450 1.75 yes no −0.70
7 0.0690 1.27 yes no −1.00
8 −0.0190 1.52 yes no −0.90
9 cannot cannot – – cannot
10 0.0600 0.99 yes no −4.30
11 −0.0900 1.22 yes no −1.00
12 −0.0067 1.66 yes no −0.50
from N were statistically signifi cant (P < 0.05) be-cause of the high numbers of cases in the MQI data fi les. Of course, in spite of this signifi cance the prac-tical importance of deviations was negligible. On the contrary, the health and hygienic MQIs deviated mostly from mentioned character very visibly (Tab. I; Fig. 1), according to expectation. Log data TRN ap-proached the FD towards the N (Tab. II; Fig. 2) in these fi les of MQIs usually in a satisfactory way. BC transformation enabled the best approach of fi les of chosen MQIs (SCC, TMBC and PBC) to the N, es-pecially in terms of more important obliqueness of data fi les (a3 = 0, Tab. III; Fig. 3). BC TRN diff ers from logarithmic TRN. Log TRN depends on relevant ba-sis. BC transformation needs a change of the control term according to character of the concrete data fi le.
It is more diffi cult for routine using this otherwise statistically eff ective means in the prepared evalua-tion algorithm. In general, the exploratory analysis results distributed the investigated MQIs into two groups in terms of necessity of their data TRNs in-cluding of type of TRN or their total inutility. It is important knowledge in terms of creation of the evaluation algorithm rules for work with the MQIs data at their synthesis into SQSM.
Preliminary SQSM indicator derivation and investigation
The concrete SQSM values varied from −2.33 up to 2.61 in diff erent months (Tab. IV; 2003). The theo retically probable range is supposed from −3.0 up to 3.0 approximately in the mentioned
calcula-Q graph SCC, Box-Cox, November 2003, Set I
-4 -3 -2 -1 0 1 2 3 4 5
0 0.2 0.4 0.6 0.8 1.0 1.2
Pi
ui
real data theoretical curve
Q - Q graph SCC, Box-Cox, November 2003, Set I
-4 -3 -2 -1 0 1 2 3 4 5
-4 -3 -2 -1 0 1 2 3 4
ĭ-1 (Pi)
ui
real data theoretical line
Q graph TMBC, Box-Cox, January 2003, Set I
-4 -3 -2 -1 0 1 2 3 4
0 0.2 0.4 0.6 0.8 1.0 1.2
Pi
ui
real data theoretical curve
Q-Q graph TMBC, Box-Cox, January 2003, Set I
-4 -3 -2 -1 0 1 2 3 4
-4 -3 -2 -1 0 1 2 3 4
ĭ-1 (Pi)
ui
real data theoretical line
Q graph PBC, Box-Cox, October 2003, Set I
-2,5 -2 -1,5 -1 -0,5 0 0,5 1 1,5 2 2,5
0 0.2 0.4 0.6 0.8 1.0 1.2
Pi ui
real data theoretical curve
Q-Q graph PBC, Box-Cox, October 2003, Set I
-4 -3 -2 -1 0 1 2 3 4
-4 -3 -2 -1 0 1 2 3 4
ĭ-1 (Pi)
ui
tion processing. In the model the log TRN was suit-able for some real data of MQIs but BC TRN was not neces sary. The SQSM arithmetical averages, whose expected value is zero, varied from −8.6×10⁻¹⁵ up
to 2.0×10⁻¹⁴. Similarly, the median values varied
from 0 up to 0.0365, near the zero (Tab. IV). The month obliqueness values (a3), also expected as zero values, varied from −0.37 up to 0.19 (Tab. IV). 33.3% of obliqueness cases were speculated about as
nor-mal FD (Tab. IV; P > 0.05). The acuteness values (a4), which were expected as equal to 3.0, varied from 2.21 up to 4.12 (Tab. IV). 8.3% of acuteness values were speculated about as normal FD (Tab. IV; P > 0.05). Of course, the obliqueness as symmetry measure is more important in terms of purpose of work hypothesis. The derived data fi les of SQSM values show N of their FD quite well. Despite the occur rence of signifi cant diff erences from normal IV: The evaluation of SQSM indicator frequency distribution
month x sx m max. min. a3 s(a3) SN a4 s(a4) N
1 1.3×10⁻¹⁵ 0.486 0.0206 1.76 −1.88 −0.23 0.053 no 3.60 0.106 no 2 −3.8×10⁻¹⁶ 0.495 0.0311 1.74 −2.32 −0.37 0.048 no 4.12 0.096 no 3 −8.6×10⁻¹⁵ 0.507 0.0240 2.22 −2.11 −0.18 0.053 no 3.65 0.105 no 4 3.7×10⁻¹⁵ 0.501 0.0365 1.74 −1.93 0.17 0.050 no 2.21 0.099 no 5 6.2×10⁻¹⁶ 0.495 0.0062 1.75 −2.33 0.19 0.050 no 2.36 0.101 no 6 −9.8×10⁻¹⁶ 0.485 0.0313 1.71 −2.00 0.10 0.051 yes 2.91 0.101 yes 7 5.3×10⁻¹⁵ 0.475 0.0198 1.77 −1.93 −0.28 0.059 no 3.84 0.118 no 8 −2.5×10⁻¹⁵ 0.460 0.0000 1.87 −1.49 0.03 0.061 yes 3.40 0.123 no 9 2.0×10⁻¹⁴ 0.505 0.0282 1.94 −1.98 −0.10 0.051 yes 3.66 0.102 no 10 −7.2×10⁻¹⁵ 0.494 0.0144 1.85 −1.90 −0.17 0.052 no 3.86 0.105 no 11 −3.3×10⁻¹⁵ 0.494 0.0109 2.61 −1.74 −0.05 0.054 yes 3.86 0.107 no 12 1.1×10⁻¹⁴ 0.495 0.0140 2.07 −1.85 −0.11 0.054 no 4.04 0.108 no x = arithmetical mean; sx = standard deviation; m = median; max. = maximum; min. = minimum; a3 = obliqueness coeffi -cient; s(a3) = stand. dev. of a3; a4 = acuteness coeffi cient; s(a4) = stand. dev. of a4; SN = a3 symmetry normality; N = a4 normal-ity; no = P ≤ 0.05; yes = P ≥ 0.05
Graph of data distribution, SQSM, June 2003, Set I
0 5 10 15 20 25 30
-3 -2 -1 0 1 2
SQSM frequency
Q graph, SQSM, June 2003, Set I
-5 -4 -3 -2 -1 0 1 2 3 4
0 0.2 0.4 0.6 0.8 1.0 1.2
Pi
ui
real data theoretical curve
Q-Q graph, SQSM, June 2003, Set I
-5 -4 -3 -2 -1 0 1 2 3 4
-4 -2 0 2 4
ĭ-1 (Pi)
ui
real data theoretical line
FD (because of a high number of cases in relevant data fi les) these deviations from N could be seen as no important for practical use purposes. The real FD curve (Gauss curve) and Q and Q–Q graphs of „nor-mal” FD of fi le of SQSM values (2003 June; Tab. IV) are shown in Fig. 4. The SQSM data fi le, which most deviates from N (2003 February; Tab. IV), is shown in Fig. 5. It could be possible to assign the milk purchase prices to the introduced SQSM values. Probab ly, the mentioned process could balance the premiums for milk deliveries by penalties towards the equivalence.
CONCLUSION
The basic statistical evaluation of the raw cow MQIs was carried out with the data fi les 1994 and 2003 (Janů et al., 2007). It was performed for the pos-sibility to write up the changes and infl uences on RMQ during the mentioned reference period. There was stated the general quality improvement, which was caused by the application of RMQ discrimina-tion limits, where some of them were made more restrictive, in the offi cial payment policy. This pa-per is the second step of the mentioned research. The mentioned selected model fi les of the real data, which were processed in consideration of the prac-tical dynamic of the RMQ (basic statistic), were evalua ted by exploratory analysis of the
one-dimen-sional data fi les of the MQIs to explain and regu-late the FD of RMQ values. The goal was to obtain the relevant knowledge for fi nal proposal of evalu-ation algorithm for the regular consistent including of quality into price by new synthetic RMQ indica-tor, SQSM. The behaviour of FDs of MQI data fi les and month SQSM data fi les during reference pe-riod was analy sed and described. The useability of the SQSM system for the balancing of raw milk pur-chase price premiums and penalties was prelimi-nary confi rmed. In general it means that the two im-portant steps will be carried out in the next period of the research and development:
1. an improvement of proposal for the construction of the evaluation algorithm for the synthesis of more MQIs into one-dimensional relative RMQ indicator, SQSM;
2. a validation of the functions and the result reli-ability of the proposed evaluation algorithm (for SQSM synthesis) and attestation of possibili ties for the effi cient modifi cations of algorithm on the model fi les of real data.
In the framework of modern trends of preference of quality programmes this is a case of abandonment of basically anachronistic vision about the neces-sity of existence of quality classes for RMQ payment within the bounds of standard quality. SQSM system could be tested in payment system of a seleced dairy plant in the case of its positive approach.
Graph of data distribution, SQSM, February 2003, Set I
0 5 10 15 20 25 30 35 40
-3 -2 -1 0 1 2
SQSM frequency
Q graph, SQSM, February 2003, Set I
-6 -5 -4 -3 -2 -1 0 1 2 3 4
0 0.2 0.4 0.6 0.8 1.0 1.2
Pi
ui
real data theoretical curve
Q-Q graph, SQSM, February 2003, Set I
-6 -5 -4 -3 -2 -1 0 1 2 3 4
-4 -3 -2 -1 0 1 2 3 4
ĭ-1
(Pi)
ui
real data theoretical line
SUMMARY
The raw milk quality (RMQ) is a crucial factor of the milk food chain safety. A consistent link of the RMQ to the farmer price is essential. The aim was to analyse the properties of milk quality indicators (MQIs) and propose a new synthetic relative MQI (SQSM) from among various individual MQIs. SQSM could serve for consistent inclusion each quality change into the price. The paper was focused on exploratory analysis (normality (N) testing of fi les of MQIs). On the basis of the results, the MQIs were divided into two groups without and with necessity of original data transformation (TRN). Log and Box-Cox TRNs were tested in terms of possibilities of the fi les approach to the normal data fre-quency distribution (FD). The compositional MQIs deviated less and health and hygienic MQIs more from normal FD in original data (P < 0.05). The TRNs approached the data fi les to N very markedly in health and hygienic MQIs. The synthesis of various values of MQIs into SQSM was proposed: DX = (IND − x)/sx, where: IND is individual value of MQI of supplier, x is month arithmetical average of MQI of all milk suppliers and sx its standard deviation; SQSM is the average: sum of right oriented (according to RMQ growth) DXs of MQIs of identical raw milk delivery divided by the relevant num-ber of MQIs. The eight chosen most frequent and important MQIs were included as combination into SQSM calculation: fat, crude protein, solids non fat, milk freezing point, log somatic cell count, log to-tal mesophilic bacteria count, log coli bacteria count (last three as transformed MQIs, TRN), residual inhibitory substances. SQSM values were derived from model fi le of real data about MQIs and vali-dated for use at farmer milk price modifi cations by the normality FD test. 33.3% of month SQSM fi les were normal (P > 0.05), the other were very close to the N with negligible deviations. The useability of the SQSM system for the balancing of raw milk purchase price premiums and penalties was tenta-tively confi rmed.
Supported by the research projects NAZV QF 4003, INGO LA 09030 and MSM 2678846201 and by activities of National Reference Laboratory for Raw Milk in Rapotín as well.
REFERENCE
ALI, A. K. A., SHOOK, G. E., 1980: An optimum transformation for somatic cells concentration in milk. J. Dairy Sci., 63, 487–490.
BAUMGARTNER, C. und Expertengruppe für Qualitätssicherung und Qualitätsmanagement 2000: Qualitäts 2000. Leitfaden für den Betrieb von Routine – Untersuchungsgeräten in Rohmilch – Prüfungslaboratorien, 1. Ausgabe, Oktober, 32. BAUMGARTNER, C., SCHUSTER, J., 2005: Circular
of AFEMA n. 13, November, 5.
BOSSUYT, R., 2003: Bezahlung des Milchpreises nach Qualität deren Gründe und Methoden in Belgien. AFEMA Tagung, Mosonmagyaróvár, Mai. CEMPÍRKOVÁ, R., 2002: Psychrotrophic vs. total
bacterial counts in bulk milk samples. Vet. Med.– Czech, 47, 8, 227–233.
CEMPÍRKOVÁ, R., 2007: Contamination of cow’s raw milk by psychrotrophic and mesophilic mi-crofl ora in relation to selected factors. Czech J. Anim. Sci., 52, 11, 387–393.
CEMPÍRKOVÁ, R., 2001: The technology of dairy cows breeding in relation to the hygienic quality of milk. (In Czech) Collection of Scientifi c Papers Faculty of Agriculture in České Budějovice, Series for Animal Sciences, 18, 1, 33–46.
CEMPÍRKOVÁ, R., THÉR, R., 2000: The eff ect of liv-ing conditions on selected indexes of raw cow’s milk. (In Czech) Collection of Scientifi c Papers Faculty of Agriculture in České Budějovice, Series for Animal Sciences, 17, 1, 55–71.
CSN 57 0529, 1993: Raw cow milk for dairy factory treatment and processing. CNI Prague.
CSN ISO 6730, 1996: Milk – Enumeration of colony-forming units of psychrotrophic microorganisms – Colony-count technique at 6.5 °C. CNI Prague. CSN ISO 4832, 1995: Mikrobiology – General
guid-ance for the enumeration of coliforms – Colony count techniques. CNI Prague.
CSN 57 0101, 1964: Microbiological analyse of milk and milk products. Determination of sporulated aerobic bacteria 30 °C/72 hours. CNI Prague. CSN 57 0538, 1998: Determination of freezing point
in milk, cryoscope method. CNI Prague.
CSN 57 0536, 1999: Determination of milk composi-tion by mid–IR analyzer. CNI Prague.
CSN 57 0530, 1972: Methods for testing of milk and milk products. CNI Prague.
CSN EN ISO 13366–3, 1998: Milk – Enumeration of somatic cells – Part 3: Fluoro-opto-electronic method. CNI Prague.
DENEKE, J., FEHLINGS, K., RABOLD, K., AKSEN, T., BAUMGARTNER, C., 2004: Milk hygiene and udder health problems: Results of a survey of 5000 dairy farms. Copyright 2000–2004 MilkProduc-tion.com.
DAIRY CREST, 2002: Dairy Crest Ltd.; Milk Supply Agreement Flat Payment. July, UK.
EEC 92/46, COUNCIL DIRECTIVE, 1992: Milk and milk product quality. Offi cial Journal, L 268, 14/9/1992, 1–32.
HANUŠ, O., 2000: Scheme of an algorithm for so -ware objective determination of milk quality and its permanent relation to moneyness – SyntQLact – a specifi c approach to improvement of quali-tative parameters and realization of consumers’ safety prevention principles. (In Czech) Proceed-ings VÚCHS Rapotín, November, 136−142.
HANUŠ, O., BJELKA, M., GENČUROVÁ, V., JEDELSKÁ, R., KOPECKÝ, J., 2003: The relation-ships of the average sizes of the dairy cow herds and some qualitative-hygienic milk parameters. (In Czech) Výzkum v chovu skotu, XLV, 163, 3, 1−12.
HANUŠ, O., BJELKA, M., TICHÁČEK, A., JEDEL-SKÁ, R., KOPECKÝ, J., 2001: Substantiation and usefulness of transformations in data sets of ana-lyzed milk parameters. (In Czech) Chov a šlechtění skotu pro konkurenceschopnou výrobu. Proceed-ings VÚCHS Rapotín, September, 122−137.
HANUŠ, O., FRELICH, J., VYLETĚLOVÁ, M., ROUBAL, P., VORLÍČEK, Z., JEDELSKÁ, R., 2004 a: Technologically diffi cult, pathogenic and food risky bacterial contamination of raw milk and other materials from dairy cow herds. Czech J. Anim. Sci., 49, 11, 489–499.
HANUŠ, O., HLÁSNÝ, J., GENČUROVÁ, V., BJELKA, M., 2004 b: Milk, versatile important foodstuff . Physiology of rise, taking care of pro-duction and value for human. (In Czech) Suppl., Osteological bulletin, 9, 4, 3−15.
HANUŠ, O., JANŮ, L., VYLETĚLOVÁ, M., MACEK, A., 2007: A validation of algorithm practicability of the relative synthetic raw milk quality indica-tor (SQSM) for consistent modifi cation of farmer price. (In Czech) Acta univ. agric. et silvic. Mendel. Brun., LV, 5, 71–82.
JANŮ, L., HANUŠ, O., BAUMGARTNER, C., MACEK, A., JEDELSKÁ, R., 2007: The analy-sis of state, dynamics and properties of raw cow milk quality indicators in the Czech Republic. (In Czech) Acta fytotechnica et zootechnica, 10, 3, ISSN 1335–258X, 2007, 74–85.
JANŮ, L., HANUŠ, O., MACEK, A., GENČUROVÁ, V., 2005: The importance, systems and next pos-sibilities of consistent raw milk payment accord-ing to quality. (In Czech) Výzkum v chovu skotu, XLVII, 171, 3, 22–31.
KUPKA, K., 1997: Statistical quality management. Statistické řízení jakosti.
KVAPILÍK, J., 2005 a: The milk purchase prices and protein and fat content. (In Czech) Zpravo-daj Svazu chovatelů a plemenné knihy Českého strakatého skotu, 2, 16−18.
KVAPILÍK, J., 1997: Milk and purchase treaties. (In Czech) Náš Chov, 1, 12−14.
KVAPILÍK, J., 2004: Milk purchase prices in the Euro pean dairy companies. (In Czech) Proceedings VÚCHS Rapotín, Aktuální problémy řízení v cho vu skotu, 119−131.
KVAPILÍK, J., 2005 b: Milk production and reform of the Common Agricultural Policy. (In Czech) Con-ference proceedings Den mléka, ČZU Praha, ISBN 80-213-1327-7, 10−15.
KVAPILÍK, J., STŘELEČEK, F., 2003: Cattle and sheep quotas negotiated between the Czech Republic and the EU. Czech J. Anim. Sci., 48, 11, 487–498.
MELOUN, M., MILITKÝ, J., 1994: Statistical evalua-tion of experimental data. (In Czech).
REGULATION (EC) No. 853/2004.
RENEAU, J. K., 1986: Eff ective use of dairy herd im-provement somatic cell counts in mastitis control. J. Dairy Sci., 69, 1708−1720.
SHOOK, G. E., 1982: Approaches to summarizing somatic cell count which improve interpretability. Nat. Mast. Council, Louisville, Kentucky, 1−17. TITCHENER, A., 1998: The building of national
policy of quality – National Quality Programme (NQP). Budování národní politiky jakosti – Národní program jakosti (NQP), RESOURCE London, Prague, March, 66.
VYLETĚLOVÁ, M., BENDA, P., HANUŠ, O., KOPUNECZ, P., 1999: Determination of total psy-chrotrophic microorganisms in bulk milk samples and their relationship to total count of mikroor-ganisms. (In Czech) Czech J. Food Sci., 17, 6, 216– 222.
VYLETĚLOVÁ, M., FICNAR, J., HANUŠ, O., 2000: Eff ects of lipolytic enzymes Pseudomonas fl uorescens
on liberation of fatty acids from milk fat. (In Czech) Czech J. Food Sci., 18, 5, 175−182.
VYLETĚLOVÁ, M., HANUŠ, O., PÁČOVÁ, Z., ROUBAL, P., KOPUNECZ, P., 2001: Frequency of Bacillus bacteria in raw’s milk and its relation to other hygienic parameters. (In Czech) Czech J. Anim. Sci., 46, 3, 260–267.
WET DE, H., 1998: Milk payment systems in the member countries of Int. Dairy Fed., IDF Bulletin, 331.
Address