https://doi.org/10.5194/tc-11-3011-2017
© Author(s) 2017. This work is distributed under the Creative Commons Attribution 4.0 License.
The significance of vertical moisture diffusion on drifting snow
sublimation near snow surface
Ning Huang1,2and Guanglei Shi1
1Key Laboratory of Mechanics on Disaster and Environment in Western China, Lanzhou University, Lanzhou, 730000, China 2School of Mechanical Engineering, Lanzhou Jiaotong University, Lanzhou, 730000, China
Correspondence:Guanglei Shi ([email protected]) Received: 22 June 2017 – Discussion started: 12 July 2017
Revised: 4 October 2017 – Accepted: 2 November 2017 – Published: 20 December 2017
Abstract.Sublimation of blowing snow is an important pa-rameter not only for the study of polar ice sheets and glaciers, but also for maintaining the ecology of arid and semi-arid lands. However, sublimation of near-surface blowing snow has often been ignored in previous studies. To study tion of near-surface blowing snow, we established a sublima-tion of blowing snow model containing both a vertical mois-ture diffusion equation and a heat balance equation. The re-sults showed that although sublimation of near-surface blow-ing snow was strongly reduced by a negative feedback effect, due to vertical moisture diffusion, the relative humidity near the surface does not reach 100 %. Therefore, the sublimation of near-surface blowing snow does not stop. In addition, the sublimation rate near the surface is 3–4 orders of magnitude higher than that at 10 m above the surface and the mass of snow sublimation near the surface accounts for more than half of the total snow sublimation when the friction wind ve-locity is less than about 0.55 m s−1. Therefore, the sublima-tion of near-surface blowing snow should not be neglected.
1 Introduction
Blowing snow is the main source of polar ice sheets and mountain glaciers in snowy areas at high latitudes in the Northern Hemisphere (such as the north of Canada, Green-land, etc.), and these have profound influence on the global hydrologic cycle, climate change and the ecological system. Extensive studies have shown that sublimation of blowing snow is an important method affecting snow distribution, es-pecially in the polar ice sheets, highland mountains and high-latitude areas in the Northern Hemisphere. The mass of
sub-limated blowing snow has been found to be equal to 18.3 % of annual precipitation in coastal Antarctica (Pomeroy and Jone, 1995), 22 % of winter precipitation in Arctic Alaska (Liston and Sturm, 2004), 17–19 % of annual precipitation in the Rocky Mountains, Canada (MacDonald et al., 2010), and 24 % of annual precipitation in the western Chinese moun-tains (Zhou et al., 2014). In addition, the fluxes of sublimated snow during blowing snow returned 10±50 % of seasonal snowfall to the atmosphere in North American prairie and Arctic environments (Pomeroy and Essery, 1999). These re-sults indicate that sublimation of blowing snow is very im-portant for the study of global and polar hydrological sys-tems.
Some scientists (Pomeroy and Essery, 1999; Cullen et al., 2007; Marks et al., 2008; Reba et al., 2012) used eddy covari-ance to directly measure sublimation of blowing snow. How-ever, since this method can only obtain information from a few points, it is difficult to use it to predict overall sublima-tion in snowy areas (Pomeroy and Essery, 1999; Cullen et al., 2007; Marks et al., 2008; Reba et al., 2012). Therefore, the study of sublimation of snow using a numerical model is desirable.
of snow particles near the surface would result in a rapid air temperature decrease and humidity increase. Therefore, the humidity near surface would quickly reach saturation, lead-ing to sublimation ceaslead-ing in the layer with saturated humid-ity. As a result, the sublimation of snow particles near surface would be negligible in fully developed drifting snow (Déry et al., 1998; Bintanja, 2001; Mann et al., 2000). However, some researchers (Schmidt, 1982; Groot Zwaadtink et al., 2011) found that humidity near the surface did not reach saturation in drifting snow in the field or in wind tunnel experiments and believed that this was caused by water transport (con-vection and diffusion). Déry and Yau (1999) fixed the relative humidity at 95 % instead of 100 % at the surface when sim-ulating blowing snow sublimation and found that the time-integrated values of sublimation increased by 14 % at 95 % relative humidity compared with that at 100 % relative hu-midity. So they believed that the humidity near the surface is very important for the simulation of blowing snow subli-mation. Huang et al. (2016) calculated the snow sublimation in the saltation layer by taking into consideration the effect of horizontal moisture convection on the non-homogeneous snow cover. Their results showed that sublimation of blow-ing snow in the saltation layer could not be neglected in the presence of horizontal moisture convection. But they did not discuss the sublimation near surface in areas such as polar ice sheets, snow-covered grassland, etc., where the snow cover is very large and the water convection is very weak. Therefore, studies on snow sublimation in these regions are of great in-terest for the understanding of global hydrological systems and ecosystems.
In previous blowing snow sublimation models, a diffusion equation was often used to describe the movement of snow particles. Although the equation is good at describing the movement of small particles well, it is less good at describ-ing the movement of large snow particles, which are mainly distributed in the near-surface area (Déry et al., 1998; Xiao et al., 2000; Vionnet et al. 2014). Huang et al. (2016) used the Lagrangian particle tracing method to describe the movement of near-surface snow particles, and for the first time calcu-lated the sublimation of saltating particles in the near-surface region with non-uniform snow cover. But this model did not take into consideration the turbulent suspension of snow par-ticles. Furthermore, none of the above existing models took into consideration the effects of vertical moisture diffusion on the sublimation.
In this study, a drifting snow model was first established to describe the movement of snow particles of both saltat-ing snow particles near surface and suspended snow particles in the higher region. Then, a sublimation model of blow-ing snow was built in combination with the driftblow-ing snow model, a vertical moisture diffusion equation and a heat bal-ance equation. Next, sublimation of blowing snow at three different wind speeds was calculated and the temporal evo-lution and vertical profiles of temperature, relative humidity, mass concentration of snow particles and snow sublimation
rate were analysed in detail. Finally, the proportions of the sublimation mass of snow particles near surface to the total sublimation mass were also given.
2 Methods
2.1 Basic flow equations
The horizontal wind field satisfies the Navier–Stokes equa-tion at the atmospheric boundary layer (Nemoto and Nishimura, 2004):
∂ ∂z
ρaκ2z2
du dz du dz
+F =0, (1)
whereκ is the von Karman constant,ρa is air density,uis the horizontal wind speed andF is the reaction force of the snow particles on the flow field.
2.2 Snow particle motion equations
The snow particles jumping from the bed are divided into saltating and suspended particles when calculating snow par-ticle movement. These two types of parpar-ticles are distin-guished based on the particle size and flow field conditions. Then the saltating particles are calculated by a Lagrange par-ticle tracing method, and the suspended parpar-ticles are calcu-lated by diffusion equation.
2.2.1 Judging criteria of saltating and suspended particles
The judging criteria of saltating and suspended particles are as follows (Scott, 1995):
ws/(ku∗) >1,saltation particle
ws/(ku∗)≤1,suspension particle, (2) whereu∗is the friction velocity andwsis the final sedimen-tation velocity of the particles, which can be calculated by the following equations (Carrier, 1953):
ws= −
A D+ s A D 2
+BD, (3)
A=6.203υa,
B=5.516ρp 8ρa
g,
whereDis the diameter of snow particle,υais air viscosity coefficient,ρpis the density of snow particles, andgis the acceleration due to gravity.
2.2.2 Basic equations of saltating particles
The motion equations of the saltating particles are as follows (Huang et al., 2011):
mdUp
dt =FD
U
a−Up
Vr
mdVp
dt = −G+FB+FD
V
a−Vp
Vr
, (5)
dxp
dt =Up, (6)
dyp
dt =Vp, (7)
where m is the mass of snow particle, G is the gravity of snow particle, Ua and Va are the horizontal and verti-cal velocity of air respectively, Up andVpare the horizon-tal and vertical velocities of snow particle respectively,Vr=
q
(Up−Ua)2+(Vp−Va)2 is the movement relative veloc-ity of the snow particles in the flow field, FB andFD are the buoyancy and traction forces of snow particles respec-tively, andxpandypare the horizontal and vertical positions of snow particles.
The splash function fitted by Sugiura and Maeno (2000) according to the observations of the low-temperature wind tunnel experiment was chosen:
Sv(ev)= 1
baG (a)e a−1 v exp
−ev b
, (8)
Sh(eh)= 1 √
2π σ2exp
"
−(eh−µ) 2 2σ2
#
, (9)
Se(ne)=mCnep
ne(1−p)m−ne, (10)
whereSv(ev),Sh(eh)andSe(ne)are the probability distri-bution functions of the vertical restitution coefficientev, hor-izontal restitution coefficient eh and the number of grains ejectedne, respectively.
2.2.3 Basic equations of suspended particles
The movement of suspended particles is described by the following vertical diffusion equation according to horizontal uniformity condition (Déry and Yau, 1999):
∂q ∂t = ∂ ∂y Ks ∂q ∂y +wsq
+S, (11)
where q is the snow particle mass concentration, Ks is the vertical diffusion coefficient, S is the volume sublima-tion rate of snow particles and Ks=δκu∗z,δ is as follows (Csanady, 1963):
δ= 1
r
1+β2f2 w2
a
, (12)
whereβis the proportionality constant,w0is the vertical tur-bulent fluid velocity, and we setβ=1 andw02=u2
∗.
2.2.4 Aerodynamic entrainment
The aerodynamic entrainment equation of Shao and Li (1999) is chosen:
Na=V u∗
1−u 2 ∗t
u2 ∗
D−3, (13)
whereNa is the number of snow particles taking off due to aerodynamic entrainment,ζis a non-dimensional coefficient, approximately equal to 1×10⁻³,u∗ is the friction velocity andu∗t is the threshold friction velocity.
2.3 Sublimation formula
The sublimation formula is as follows (Thorpe and Mason, 1966):
dm
dt =
π D(RH−1)
Ls
KN uTa
Ls
RvTa−1
+ RvTa
ShKles
, (14)
where RH is the relative air humidity, Ta is air tem-perature, Ls is the latent heat of sublimation (equal to 2.84×10⁶J kg−1),Ka is the air thermal conductivity,Rvis the gas constant of water vapour (equal to 461.5 J kg−1K−1),
Klis the molecular diffusion of water vapour of atmosphere,
esis the saturated vapour pressure relative to the ice surface.
N uandShare the Nusselt and Sherwood numbers, respec-tively (Thorpe and Mason, 1966; Lee, 1975):
N u=Sh=
1.79+0.606Re0.5 0.7< Re≤10 1.88+0.580Re0.5 10< Re <200,
(15) whereRe=DVυ r
a is the Reynolds number.
2.4 Heat and humidity equations
The air heat and humidity equations are as follows (Déry and Yau, 1999; Bintanja, 2000):
∂θ ∂t = ∂ ∂z Kθ ∂θ ∂z
− LsS ρfC
, (16)
Kθ =κu∗z+KT, (17)
∂hu ∂t = ∂ ∂z Kq ∂hu ∂z + S ρf , (18)
Kh=κu∗z+KV, (19)
2.5 Initial and boundary conditions
The initial potential temperatureθ0=263.15 K, and the ini-tial absolute temperature is
T0=θ0
p
p0
0.286
, (20)
wherepis atmospheric pressure and its initial value is
p=p0exp
− yg Rdθ0
, (21)
wherep0=1000 hpa,Rd=287 J Kg−1K−1is the gas con-stant for dry air.
The initial relative humidity profile is
RH=1−Rsln(z/z0), (22)
where z0 is the surface roughness, and its value is 3× 10⁻⁵m at snow bed (Nemoto and Nishimura, 2001), and
Rs=1.9974×10⁻².
The conversion relationship of relative humidity and spe-cific humidity is
q=0.622· es p−es
·RH, (23)
wherees=610.78 exp21.87(T−273.16)(T−7.66). The calculation area is set to 1 m in length, 10 m in height and 0.01 m in width. The time step is 10−5s for saltating particles, 10−2s for suspended particles and 10−3s for wind, and the calculation time is 1500 s. The motion of saltating particles is only calculated for 10 s in consideration of prac-tical simplicity, since saltating particles will stabilize within a few seconds. The data of saltating particles in the air and the jumping particles from bed are then replaced by the data averaged in 10 s. The threshold friction velocity is 0.21 m s−1 (Nemoto and Nishimura, 2001).
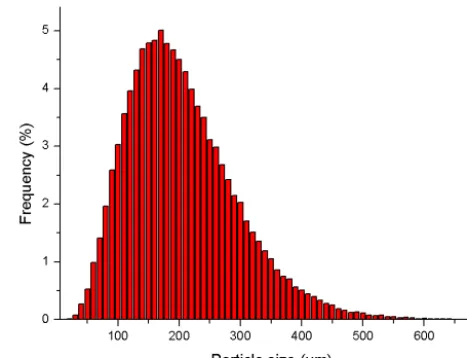
The size distribution of snow particles used in this paper fits the results of Schmidt’s (1982) field observations (Fig. 1). 2.6 Calculation process
The calculation process of our model is as follows.
We set a logarithmic wind field as the initial wind field, and give the first take-off particle a random particle sizeD
and a vertical velocity of √
2GD.
All the snow particles in the air are divided into saltat-ing particles and suspended particles accordsaltat-ing to Eqs. (2) and (3). The movement of saltating particles is calculated according to Eqs. (4)–(7) and the movement of suspended particles is calculated with Eqs. (11) and (12).
If the snow particles fall on the bed, they will rebound and eject other particles which are on the bed. This process is calculated with Eqs. (8) and (9).
If the bed shear stress is greater than the threshold value, particles are entrained from their random positions on the
Figure 1.Particle size distribution used in this paper, which fits the results of Schmidt’s (1982) field observations.
Table 1.Comparison ofDthandD99%.
u∗=0.35 m s−1 u∗=0.41 m s−1 u∗=0.54 m s−1
Dth 80.55 µm 87.84 µm 102.61 µm
D99% ≤80 µm ≤90 µm ≤110 µm
snow surface at vertical speed √
2GD and the number of aerodynamically entrained snow particles can be calculated by Eq. (13).
The reaction force of the snow particles on the flow field is calculated by Eqs. (4) and (5) due to Newton’s third law, and then the new flow field is calculated by Eq. (1).
The air temperature and humidity are calculated by Eqs. (16)–(19).
The sublimation of snow particles is calculated by Eqs. (14) and (15).
Steps (2)–(7) are recycled until the end of the simulation.
3 Results and discussion
In order to verify the judging criteria in Eq. (2), we divided the particles into sets varied by 10 µm (1–600 µm), and used Eq. (16) to simulate all the jumping particles. Then we ac-cumulated the mass of snow particles in the air from small to large particles until the mass was equal to 99.9 % of the total mass of snow particles in the air, recorded the particle diameterD99% and compared it with the threshold particle diameterDthcalculated by Eq. (2). The results are shown in Table 1.
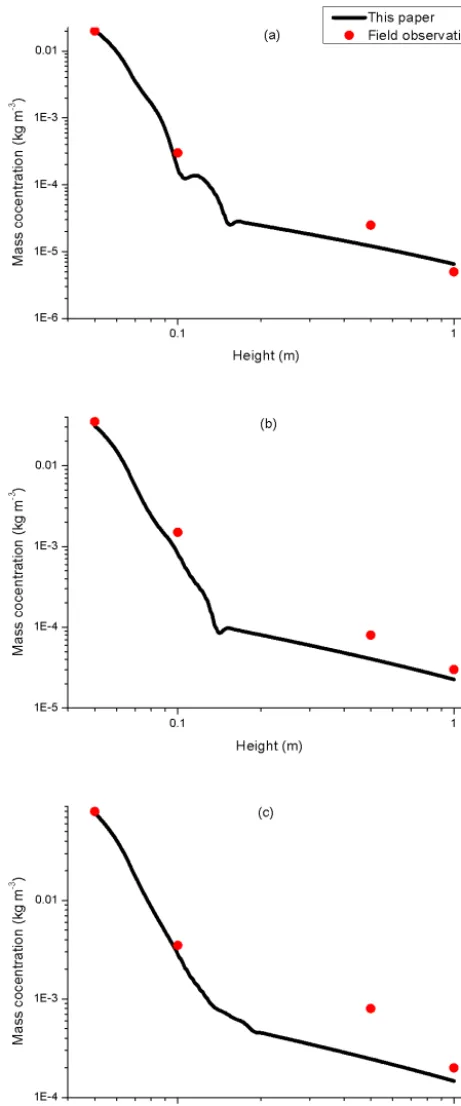
Figure 2. Comparison of mass concentration for this paper and field observation (a) u∗=0.35 m s−1; T =268.65 K; (b) u∗= 0.41 m s−1; T =268.65 K; (c) u∗=0.54 m s−1; T=268.65 K). The results of red dot are from near Saskatoon, Canada in 26 Jan-uary 1987.
In order to verify the reliability of the blowing snow model in this paper, we compared our mass concentration results with those of the field observations (Fig. 2). The red dots in Fig. 2 show the field observation results from near Saska-toon, Canada on 26 January 1987 (Pomeroy and Male, 1992) and the black line in Fig. 2 shows our numerical simulation results using the same conditions as in the above field ob-servation results. It is clear from Fig. 2 that our simulation results are basically consistent with those observed in the field, demonstrating the reliability of our simulations. It can be seen from Fig. 2 that there is some discontinuity in our re-sults at a height of about 0.1 m, which is approximately equal to the maximum height of the saltating particles (Fig. 10a), for the presence of snow particles near the height of 0.1 m is rare. Therefore, the randomness of snow particles’ number and their sizes at 0.1 m is relatively large, which leads to the discontinuity of snow mass concentration. This problem is more serious when the wind speed is low, for the lower the wind speed is, the fewer the number of snow particles in the air (See Fig. 2a). The situation is much improved when the wind speed is higher (see Fig. 2c).
We also verify the reliability of our simulation by com-paring our sublimation results with those of the field obser-vations (Fig. 3). The red lines in Fig. 3 are the observation results of Schmidt (1982) in Wyoming, USA, in 1982. The black line represents the simulated results obtained at the same environmental conditions as those of Schmidt. It can be seen that the total sublimation rates calculated using our model (black line) are approximately the same as Schmidt’s results, and the sublimation rate at 0.01 m is 2 orders of mag-nitude larger than that at 0.1 m. These results demonstrate that our results are reliable too.
We further compared our results with corresponding re-sults of other models under the same conditions. The black line in Fig. 4 represents the result of the sublimation rate of suspended particles calculated by our model (u∗= 0.89 m s−1,T =253.15 K). The other four lines are the re-sults calculated by Xiao et al. (2001) using four existing blowing snow sublimation models, in which the sublima-tion of saltating particles near the surface was neglected. It can be seen from Fig. 4 that all the sublimation rates of suspended particles increase with height first, and then start to decrease, reaching a peak at about 0.1 m. Our results are higher than those of Xiao et al. (2001). The sublimation rate of the four models is zero below a height of 0.05 m, which is different from the result of our model and Schmidt (1982) in Fig. 3. This is because the relative humidity below a height of 0.05 m is set to 100 % in the above-mentioned four models, but not in our model.
saltat-Figure 3. Comparison of sublimation rate obtained this paper and by Schmidt (1982)(a)u∗=0.632 m s−1,T =267.45 K;u∗= 1.072 m s−1,T =265.65 K). The results marked by the red line are from the data observed by Schmidt (1982) in Wyoming, USA, in 1982.
ing particles to reach steady state is about 2 s, and it is about 300 s for suspended particles. It can be seen that there are some fluctuations at 2–10 s. This is due to the randomness of particle movement. This also occurred in other models using a Lagrangian particle tracing method (McEwan and Willetts, 1991; Nemoto and Nishinura, 2004).
Figure 6 shows the changes of temperature and humidity with height at initial state and at 1500 s. It is shown that air temperature and relative humidity are changed by sublima-tion of blowing snow particles, and the amplitude of these changes increases with the friction velocity. Greater wind ve-locity will lead to more snow particles in the air, undergoing sublimation, and subsequently more dramatic changes in air temperature and relative humidity.
Figures 7 and 8 show the temporal evolution of temper-ature and relative humidity at various heights. It is clear from in Figs. 7 and 8 that the amplitude changes of tem-perature and relative humidity decrease with height
increas-Figure 4.Comparison of sublimation rate for this paper and four blowing snow models (Xiao et al., 2000). The friction velocity is set to 0.89 m s−1, and the temperature is set to 253.15 K.
ing and sublimation becomes weaker with increasing height while the relative humidity becomes a constant of about 2 s at 0.01 m and about 300 s at 10 m, consistent with the cor-responding values for suspended snow particles. This is be-cause the main portion of snow particles near the surface comprises saltating particles, while that in the upper air is mainly made up of suspended particles (Fig. 10).
Figure 8 also shows that the relative humidity near the sur-face with three friction velocities does not reach saturation when the blowing snow particles saturate, indicating that the snow sublimation does not stop. Moreover, the vertical dif-fusion of water vapour can effectively reduce the negative feedback effect.
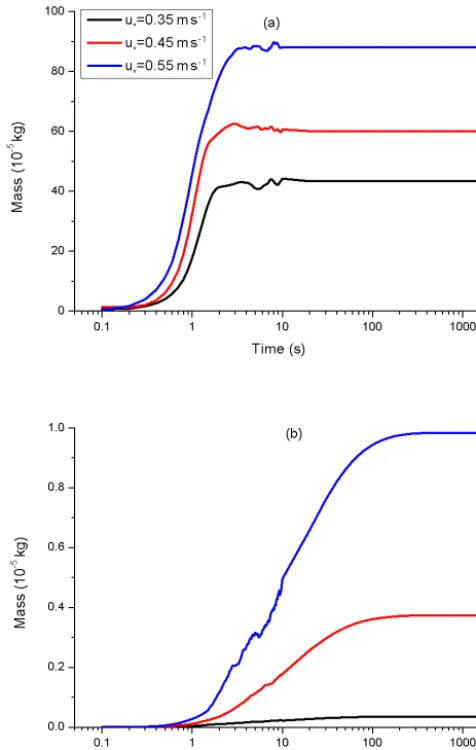
It can be seen from Fig. 9a that the sublimation rate of saltating particles shows a trend of first increasing then de-creasing with time. Its peaks at 2 s and gradually decreases and reaches a steady state at about 300 s. The negative feed-back effect on saltating particles is very obvious and the time to reach a steady state is about 300 s. The mass of saltat-ing particles increases with time dursaltat-ing the first 2 s, with a greater amplitude than that of relative humidity, and the saltation sublimation rate increases with time. However, the mass of saltating particles basically stays unchanged after 2 s, while the relative humidity near the surface gradually in-creases. Therefore, the sublimation rate decreases with time. The relative humidity near the surface also reaches steady state after 300 s, resulting in stability of the sublimation rate. The saltating particles are distributed mainly near the surface, where the amplitude change of relative humidity is strong, re-sulting in a strong negative feedback effect on saltating par-ticles.
Figure 5.Temporal evolution of mass of(a)saltating particles and (b)suspended particles.
at about 300 s. The negative feedback effect on suspended particles is not obvious. The mass of suspended particles in-creases with time during the first 300 s with an amplitude larger than that of the relative humidity. So the suspended sublimation rate increases with time. Then the mass of sus-pended particles and relative humidity both reach their steady states, leading to the sublimation rate of suspended particles becoming constant. Since the suspended particles are mainly distributed in the upper air where the amplitude change of relative humidity is weak, therefore the negative feedback ef-fect on suspended particles is also weak.
Although the effect of negative feedback on saltating par-ticles is stronger than that on suspended parpar-ticles, the subli-mation rate of saltating particles is still greater than that of suspended particles, indicating that the sublimation of saltat-ing particles is very strong even under the effect of negative feedback.
Figure 6.Vertical profiles of temperature and relative humidity.
Figure 7.Temporal evolution of temperature for various heights.
Figure 8. Temporal evolution of relative humidity for various heights.
Figure 9.Temporal evolution of saltation and suspension sublima-tion rates:(a)saltating particles;(b)suspended particles.
at height below 0.1 m, which is consistent with the previous experimental results (Takeuchi, 1980).
Figure 10.Vertical profiles of mass concentration for saltation and suspension:(a)saltating particles,(b)suspended particles.
Figure 11 shows that sublimation rates increase with fric-tion velocity. The sublimafric-tion rates of saltating and sus-pended particles show a decreasing trend after increasing and reaching a peak at about 0.01 m for saltating particles, and about 0.1 m for suspended particles. This is because the mass concentration and relative humidity of snow particles decrease with height, while temperature increases. However, the mass concentration of saltating particles changes more strongly than that of suspended particles with height. There-fore, the sublimation rate of saltating particles reaches a peak at lower height.
Figure 11.Vertical profiles of sublimation rate for saltation and sus-pension:(a)saltating particles;(b)suspended particles.
Table 2. Sublimation rate at 1500 s for snow particles at various heights.
u∗=0.35a u∗=0.45 u∗=0.55
h=0.01b 3.71 E-04c 4.05 E-04 4.21 E-04 h=0.05 1.22 E-05 2.31 E-05 3.18 E-05 h=0.1 6.11 E-07 3.08 E-06 5.37 E-06 h=1 1.68 E-07 1.12 E-06 2.29 E-06 h=5 2.93 E-08 2.88 E-07 7.52 E-07 h=10 8.44 E-09 1.09 E-07 3.31 E-07
afriction velocity (m s−1);bheight (m);csublimation rate
(kg m−3s−1)
not saturated, the sublimation rate near surface is much faster than that in other regions.
The snow sublimation near surface was ignored in most previous studies (Déry et al., 1998; Xiao et al. 2000; Vion-net et al., 2014). That is, to define a wind-velocity-related height below which saltating particles move, saltating parti-cles are moved due to wind velocity below a certain height. Assuming that moisture below the height is saturated, there-fore the snow sublimation would not be counted in the region
Figure 12.The ratio of sublimation mass below three heights to the total. Sublimation mass below a certain height is the sublimation mass that was ignored by other models (Déry et al., 1998; Pomeroy and Male, 1992, and Xiao et al., 2000).
(Déry et al., 1998; Xiao et al., 2000; Vionnet et al., 2014). The heights at three wind velocities proposed by Déry et al. (1998), Pomeroy and Male (1992), and Xiao et al. (2000) are given in Table 3 (the heights of Vionnet et al. (2014) were the same as those of Pomeroy and Male, 1992). Figure 12 shows the actual ratio of our simulated sublimation mass be-low the three heights to the total. It is clear that all the subli-mation masses below the three heights account for more than half of the total sublimation mass. This is because the main part of snow particles is composed of saltating particles (Mel-lor, 1965), which are mainly distributed in the near-surface region. Although sublimation near the surface leads to sig-nificant changes in temperature and humidity, which have a strong inhibition effect on sublimation, moisture near the surface does not reach saturation due to the vertical diffusion of water vapour, resulting in continuous snow sublimation. Therefore, the main part of the sublimation mass is subli-mation of saltating particles. Thus, it is not appropriate to neglect blowing snow sublimation near the surface as in pre-vious reported methods (Déry et al., 1998; Xiao et al., 2000; Vionnet et al., 2014). Figure 12 also shows that the propor-tion of the sublimapropor-tion mass near the surface decreases with friction velocity. Because more snow particles can enter into the upper air with increased wind velocity, which will lead to a decrease in the proportion of snow particles near the sur-face, the proportion of the sublimation mass near the surface will decrease as well.
Table 3.The height below which most of the saltating particles were distributed at various friction velocities.
u∗=0.35 m s−1 u∗=0.45 m s−1 u∗=0.55 m s−1
Déry et al. (1998) 0.0196 m 0.0253 m 0.0316 m
Pomeroy and Male (1992) 0.0222 m 0.0306 m 0.0395 m
Xiao et al. (2000) 0.05 m 0.05 m 0.05 m
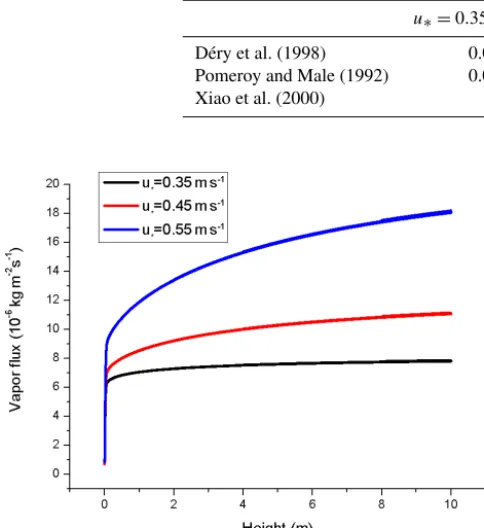
Figure 13.Vertical profiles of vapour flux.
vapour is coming from near-surface regions. It also can be seen from Fig. 13 that vapour flux increases with friction ve-locity, similar to the behaviour for humidity (Fig. 5) and the moisture diffusion coefficient (Eq. 17).
4 Conclusions
We have established a blowing snow sublimation model with consideration of vertical moisture diffusion and heat balance, to study snow sublimation near the surface in large snow-covered areas in this paper. The simulation results show that the blowing snow sublimation decreases air temperature while it increases air humidity. Meanwhile, the snow subli-mation is reduced by the negative feedback effect of tem-perature and humidity, especially in the near-surface region, in agreement with previous researches. However, moisture near the surface is not saturated due to the vertical moisture diffusion, so snow sublimation near the surface is a contin-uous process. The sublimation rate near the surface is even larger than that in the upper air, because the mass concentra-tion of snow particles near the surface is much higher than that in other regions. The sublimation rate at 0.01 m is 2 ders of magnitude greater than that at 0.1 m, and is 3–4 or-ders of magnitude greater than that at 10 m. Furthermore, at low wind speed, the mass of sublimation near the surface accounts for more than half of the total sublimation mass, and cannot be neglected. Most of the air vapour in
blow-ing snow is from the near-surface region. Therefore, blowblow-ing snow sublimation near the surface should be taken seriously in the study of snow sublimation and water vapour transport in the future.
We will continue to develop our model. Two possible im-provements are (1) to extend the model to three dimensions and take into consideration the effects of turbulence on the sublimation of both saltating and suspended particles in the atmospheric turbulent boundary layer, which will lead to a more accurate and realistic model, and (2) to propose a parametric model of the blowing snow sublimation, which will provide parameterized values for the mesoscale climate model of polar ice sheet, alpine glacier, snowy areas at high latitude, and so on.
Data availability. The data can be obtained by contacting the
cor-responding author.
Competing interests. The authors declare that they have no conflict
of interest.
Acknowledgements. This work is supported by the State Key
Programme of the National Natural Science Foundation of China (91325203), the National Key Research and Development Programme of China (2016YFC0500900), and the Innovative Research Groups of the National Natural Science Foundation of China (11121202).
Edited by: Philip Marsh
Reviewed by: Ally Toure and three anonymous referees
References
Bintanja, R.: Snowdrift suspension and atmospheric turbulence, Part I: Theoretical background and model description, Bound.-Lay. Meteorol., 95, 343–368, 2000.
Bintanja, R.: Snowdrift Sublimation in a Katabatic Wind Region of the Antarctic Ice Sheet, J. Appl. Met., 40, 1952–1966, 2001. Carrier, C.: On Slow Viscous Flow, Tech. rep., Office of Naval
Re-search, Contract Nonr-653(00), Brown University, Providence, RI, 1953.
Cullen, N. J., Molg, T., Kaser, G., Steffen, K., Hardy, D. R.: Energy-balance model validation on the top of Kilimanjaro, Tanzania, using eddy covariance data, Ann. Glaciol., 46, 227–233, 2007. Déry, S. J., Taylor, P. A., and Xiao, J.: The thermodynamic effects
of sublimating, blowing snow in the atmospheric boundary layer, Bound.-Lay. Meteorol., 89, 251–283, 1998.
Déry, S. J. and Yau, M. K.: A bulk blowing snow model, Bound.-Lay. Meteorol., 93, 237–251, 1999.
Groot Zwaaftink, C. D., Lowe, H., Mott, R., Bavay, M., and Lehn-ing, M.: Drifting snow sublimation: A high-resolution 3-D model with temperature and moisture feedbacks, J. Geophys. Res.-Atmos., 116, 971–978, 2011.
Huang, N., Sang, J. B., and Han, K.: A numerical simulation of the effects of snow particle shapes on blowing snow development, J. Geophys. Res., 116, 2693–2703, 2011.
Huang, N., Dai, X., and Zhang, J.: The impacts of moisture trans-port on drifting snow sublimation in the saltation layer, At-mos. Chem. Phys., 16, 7523–7529, https://doi.org/10.5194/acp-16-7523-2016, 2016.
Lee, L. W.: Sublimation of Snow in a Turbulent Atmosphere, Ph.D. Thesis, Graduate school of the University of Wyoming, Univer-sity of Wyoming, Laramie, USA, 1975.
Liston, G. E. and Sturm M.: A snow-transport model for complex errain, J. Glaciol., 44, 498–516, 1998
MacDonald, M. K., Pomeroy, J. W., and Pietroniro, A.: On the im-portance of sublimation to an alpine snow mass balance in the Canadian Rocky Mountains, Hydrol. Earth Syst. Sci., 14, 1401– 1415, https://doi.org/10.5194/hess-14-1401-2010, 2010. Mann, G. W., Anderson, P. S., and Mobbs, S. D.: Profile
measure-ments of blowing snow at Halley, Antarctica, J. Geophys. Res.-Atmos., 105, 24491–24508, 2000.
Marks, D., Reba, M. L., Pomeroy, J., Link, T., Winstral, A., Flerchinger, G., and Elder, K.: Comparing simulated and mea-sured sensible and latent heat fluxes over snow under a pine canopy, J. Hydrometeorol., 9, 1506–1522, 2008.
McEwan, I. K. and Willetts, B. B.: Numerical model of the saltation cloud, Acta Mech., Supplement, 1, 53–66, 1991.
Mellor, M.: Optical measurements on snow, CRREL Research Re-port, 169, 1–19, 1965.
Nemoto, M. and Nishimura, K.: Numerical simulation of snow saltation and suspension in a turbulent boundary layer, J. Geo-phys. Res., 109, 1933–1943, 2004.
Pomeroy, J. W. and Essery, R. L. H.: Turbulent fluxes during blow-ing snow: field tests of model sublimation predictions, Hydrol. Proc., 13, 2963–2975, 1999.
Pomeroy, J. W. and Male, D. H.: Steady-state suspension of snow, J. Hydrol., 136, 275–301, 1992.
Pomeroy, J. W. and Jones, H. G.: Wind-Blown Snow, Sublimation, Transport and Changes to Polar Snow, Chemical Exchange Be-tween the Atmosphere and Polar Snow, Springer Berlin Heidel-berg, 453–489, 1996.
Reba, M. L., Pomeroy, J., Marks, D., and Link, T. E.: Estimating surface sublimation losses from snowpacks in a mountain catch-ment using eddy covariance and turbulent transfer calculations, Hydrol. Proc., 26, 3699–3711, 2012.
Schmidt, R. A.: Vertical profiles of wind speed, snow concentration, and humidity in blowing snow, Bound.-Lay. Meteorol., 23, 223– 246, 1982.
Scott, W. D.: Measuring the erosivity of the wind, Catena, 24, 163– 175, 1995.
Shao, Y. and Li, A.: Numerical modeling of saltation in the atmo-spheric surface layer, Bound.-Lay. Meteorol., 91, 199–225, 1999. Sugiura, K. and Maeno, N.: Wind-tunnel measurements of restitu-tion coefficients and ejecrestitu-tion number of snow particles in drifting snow: determination of splash functions, Bound.-Lay. Meteorol., 95, 123–143, 2000.
Takeuchi, M.: Vertical profiles and horizontal increasing of drifting snow transport, J. Glaciol. 26, 481–492, 1980.
Thorpe, A. D. and Mason, B. J.: The evaporation of ice spheres and ice crystals, Br. J. Appl. Phys., 17, 541–548, 1966.
Vionnet, V., Martin, E., Masson, V., Guyomarc’h, G., Naaim-Bouvet, F., Prokop, A., Durand, Y., and Lac, C.: Simulation of wind-induced snow transport and sublimation in alpine ter-rain using a fully coupled snowpack/atmosphere model, The Cryosphere, 8, 395–415, https://doi.org/10.5194/tc-8-395-2014, 2014.
Wever, N., Lehning, M., Clifton, A., Rüedi, J. D., Nishimura, K., and Nemoto, M., Yamaguchi, S., and Sato, A.: Verification of moisture budgets during drifting snow conditions in a cold wind tunnel, Water Resour. Res., 45, 171–183, 2009.
Xiao, J., Bintanja, R., Déry, S. J., Mann, G. W., and Taylor, P. A.: An intercomparison among four models of blowing snow, Bound.-Lay. Meteorol., 97, 109–135, 2000.