www.nonlin-processes-geophys.net/20/35/2013/ doi:10.5194/npg-20-35-2013
© Author(s) 2013. CC Attribution 3.0 License.
Nonlinear Processes
in Geophysics
Physical simulation of resonant wave run-up on a beach
A. Ezersky1, N. Abcha1, and E. Pelinovsky2,3,4
1CNRS, UMR6143 – Morphodynamique Continentale et Cˆoti`ere (M2C), Universit´e Caen Basse, Normandie, 24 rue des Tilleuls, 14000 Caen, France
2Institute of Applied Physics, 46, Ul’janov St., Nizhny Novgorod 603950, Russia 3Nizhny Novgorod State Technical University, Nizhny Novgorod, Russia
4National Research University – Higher School of Economics, Nizhny Novgorod, Russia Correspondence to: E. Pelinovsky ([email protected])
Received: 27 July 2012 – Revised: 23 November 2012 – Accepted: 26 November 2012 – Published: 9 January 2013
Abstract. Nonlinear wave run-up on the beach caused by a harmonic wave maker located at some distance from the shore line is studied experimentally. It is revealed that under certain wave excitation frequencies, a significant increase in run-up amplification is observed. It is found that this ampli-fication is due to the excitation of resonant mode in the re-gion between the shoreline and wave maker. Frequency and magnitude of the maximum amplification are in good corre-lation with the numerical calcucorre-lation results represented in the paper (Stefanakis et al., 2011). These effects are very im-portant for understanding the nature of rogue waves in the coastal zone.
1 Introduction
Recent huge tsunamis demonstrate nonlinear behaviour on the coast leading to strong impact. It was also revealed re-cently that the number of abnormally large and suddenly ap-pearing waves (rogue waves) observed in the coastal zone is sufficiently larger than Gaussian statistics predicts (Nikolk-ina and Didenkulova, 2011, 2012). Analysis of tsunami records showed that reflections due to bottom topography may result in the appearance of resonant mode in the coastal zone, see for instance Neetu et al. (2011). The study of the coastal rogue waves is based on the nonlinear theory of shal-low water (Kharif et al., 2009; Didenkulova and Pelinovsky, 2011; Slunyaev et al., 2011). To characterize the impact of waves on coastal infrastructure, the systematic study of run-up process is undertaken, and a lot of papers summariz-ing the progress in the analytical solutions of the nonlin-ear shallow-water theory have been published by now (see
for instance Carrier and Greenspan, 1958; Pelinovsky, 1982; Synolakis, 1987; Pelinovsky and Mazova, 1992; Carrier et al., 2003; Kˆano˘glu and Synolakis, 2006; Didenkulova et al., 2007; Madsen and Fuhrman, 2008; Kajiura, 1977). Recently, Stefanakis et al. (2011), on the basis of numerical simulations of the nonlinear shallow-water equations, pointed out the ex-istence of resonance effects in the process of the long wave run-up. It should be noted that such resonance effects were predicted in Antuono and Brocchini (2010) in the framework of linear theory.
used for comparison with numerical calculations presented in Stefanakis et al. (2011).
Before the presentation of experimental results, we give briefly some theoretical estimates. The long wave run-up on a plane beach is described by the nonlinear shallow-water equations:
∂u ∂t +u
∂u ∂x+g
∂η
∂x =0 and ∂η
∂t + ∂
∂x(u (h+η))=0
, (1)
whereuis the depth-averaged velocity,h=h(x)is the un-perturbed water depth, η=η(x, t ) is the free surface dis-placement, and g is the acceleration of gravity. For linear variation of water depth,h=xθ (θis the tangent of bottom slope angle, x is horizontal coordinate), solutions of these equations may be found using the hodograph transformation (details can be found in papers Carrier and Greenspan, 1958; Pelinovsky, 1982; Synolakis, 1987; Pelinovsky and Mazova, 1992; Carrier et al., 2003; Kˆano˘glu and Synolakis, 2006; Di-denkulova et al., 2007; Madsen and Fuhrman, 2008; Kajiura, 1977). For instance, if the incident wave far from the shore is a monochromatic wave of frequencyω, the solution is pre-sented in the following form:
η= 1 2g
∂ϕ
∂λ−u 2
, u= 1 σ
∂ϕ ∂σ,
x= 1 2gθ
∂ϕ
∂λ−u 2−σ2
2 !
, t=λ−u gθ ,and ϕ (σ, λ)=2gθ
2
ω RJ0(ωλ/θg)sin(ωλ/θg)
, (2)
where ϕ(σ, λ) is an auxiliary function, σ= 2[g(h+ η)]1/2, andJ
0is the Bessel function of zero order. Generally speaking, wave field in the vicinity of the shoreline (x=0) is not monochromatic, but if the nonlinear effects are ignored, the solution (Eq. 2) is written in the following form: η (x, t )=RJ0
q
4ω2x/gθ
cos(ωt ) . (3) It is a standing wave with knots coinciding with zeros of the Bessel function. The constantRplays the role of the ampli-tude of the water oscillation on “unmoved” shore (x=0). As it can be rigorously shown from Eq. (2),R is the maximal run-up amplitude of the wave on the coast (moving shore-line) (Pelinovsky and Mazova, 1992). Far from the shoreline the wave is always linear because its amplitude is much less than water depth. Using asymptotics of the Bessel functions for large values of arguments, we can select the incident wave with amplitudeAat the distanceLfrom the shoreline and ob-tain the amplification ratio in the following form (Pelinovsky, 1982; Pelinovsky and Mazova, 1992; Madsen and Fuhrman, 2008):
R/A=2 √
πh0ω2/gθ2 1/4
=2πp2L/λ0, (4)
whereλ0is the wavelength on the isobathh0located on dis-tanceLfrom the shore. It is important to point out that the asymptotic (Eq. 4) is valid for large values ofL/λ0and rep-resents nonlinear amplification ration obtained directly from Eq. (2). In the case of small values ofL/λ0, correct selection of incident and reflected waves is possible if the beach of lengthLis matched with flat bottom. In this case the ampli-fication ratio is given by Pelinovsky (1982), Pelinovsky and Mazova (1992), Madsen and Fuhrman (2008), and Keller and Keller (1964):
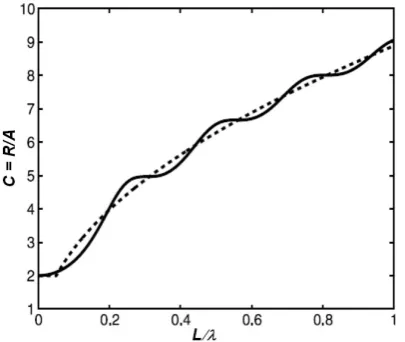
R/A=2/ q
J02(4π L/λ0)+J12(4π L/λ0). (5) Comparison of Eqs. (4) and (5) is given in Fig. 1. As it can be seen, the resonance effects are very small because the “res-onator” (0< x < L) is open from one boundary. For tsunami application, the characteristics of the incident wave very of-ten are unknown. Meanwhile, a lot of buoys are now installed along the coasts (tide-gauge stations and DART buoys), and tsunami records on such buoys can be considered as input for solving the run-up problem. In the simplified geometry of a plane beach, the buoy measures the standing wave (Eqs. 2 or 3), and in the case of small wave amplitude, free surface oscillations are described by:
η (L, t )=acos(ωt ) , and a=RJ0 q
4ω2L/gθ
. (6) The amplification factor computed for the tsunami wave propagated from the buoy to the coast,
C=R/a=J0−1 q
4ω2L/gθ
, (7)
has evident resonant properties and can be very large. Such big values of local amplification factors have been discov-ered in a recent paper (Stefanakis et al., 2011) where the re-sult was obtained by numerical computation. In fact, it is not the resonance caused by a particular frequency of incoming wave but instead a ratio between the run-up and the wave am-plitude measured at a particular distance from the coastline. This amplification of run-up ratio can be very important for prediction of tsunami behaviour based on data of the nearest buoy. Following Stefanakis et al. (2011), we call amplifica-tion of run-up ratio at particular frequencies as resonance. Analytical and numerical results described above are exam-ined below in physical experiment.
Fig. 1. Amplification run-up ratio: dashed line corresponds to the constant beach slope Eq. (4); solid line obtained for inclined beach matched with horizontal bottom Eq. (5).
L=135 m,θ=0.192) and (h0=0.32 m,L=121.5 m,θ= 0.263). Two resistive probes (P1, P2, see Fig. 2) are used to measure a displacement of water surface. The first of them, probe P1, is placed at a fixed distance of 1 cm from the wave maker. The position of a mobile one, P2, is changed using a coordinate system. Probes allow us to investigate the am-plitude of free surface oscillations and phase of oscillation (probe P1 is used as a “clock”) along the flume. Run-up height is determined by processing a movie that is shot by a high-speed camera mounted as shown in Fig. 2. The wave maker allows us to excite a harmonic wave of a given fre-quency and it works in two regimes. The first regime allows controlling the amplitude of wave maker displacement, the second one allows controlling the amplitude of force applied to the wave maker. In both regimes it is not possible to con-trol free surface displacement, as was done in the numerical experiment. That is why to study the run-up amplification, simultaneous measurements of the amplitude of free surface displacement near the wave maker and maximal run-up are carried out for different frequencies of excitation.
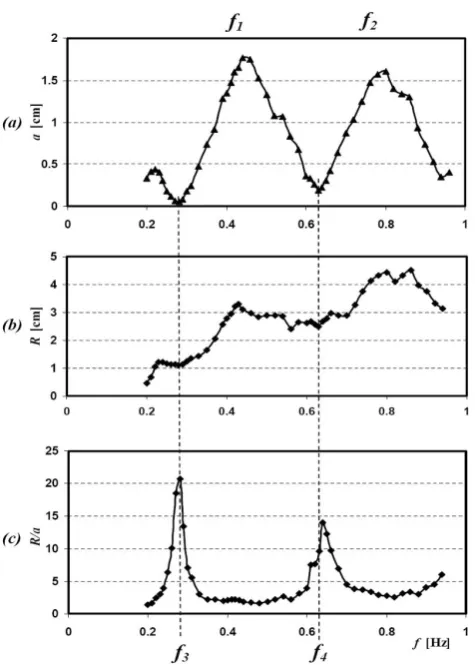
The force control regime was chosen for all experiments. The frequency dependence of the amplitude of free surface displacement near the wave maker (a), maximal run-up (R) and coefficient of run-up amplification are shown in Fig. 3 for the slope of the bottom θ= tan(α) = 0.263. The ampli-tude of force applied to the wave maker was the same for all frequencies. The amplitude of free surface displacement has peaks at frequenciesf1=0.44 Hz andf2=0.78 Hz. They are the resonant frequencies of the system. The maximal run-up does not have sharp peaks, only a small increase of R in the vicinity off1andf2is observed (Fig. 3b). The coeffi-cient of run-up amplification (Fig. 3c) increases very sharply in the vicinity of f3=0.28 Hz and f4=0.64 Hz. It is ev-ident that maximal amplification of run-up is observed for frequencies corresponding to the minimal amplitude a. In
Fig. 2. Schema of experiment: resistive probes (P1, P2), high-speed video camera (2), wave maker (3), inclined bottom (4).
the vicinity of the wave maker, the free surface amplitude is sufficiently small and the signal is very noisy. That is why the coefficient of run-up amplification requires rather deli-cate measurements of free surface displacement: a band-pass filter was used to measure the amplitude of the harmonic cor-responding to wave maker forcing.
It is important to note that the frequency and the coefficient of maximal amplification do not depend on the method of wave excitation. Results presented in Fig. 3 were obtained for the force-controlled regime of the wave maker; the same re-sults for coefficient of run-up amplification were obtained for the displacement controlled regime. It should be noted that if the amplitude of force applied to the wave maker increases, the coefficient of run-up amplification has small changes up to the appearance of wave breaking near the coastline.
Using movie recorded by a high-speed camera, we esti-mate the so-called wave-breaking number “Br” (Denissenko et al., 2011): Br =VgR2, whereV is velocity of fluid particles atx=0. Under our experimental conditions, this number is small enough: Br<0.2.
Amplification coefficientCwas investigated for three bot-tom inclinations. Frequencies of maximal amplification de-pend on angle α. To compare results obtained for differ-ent anglesα, the non-dimensional frequency (F )was intro-duced:F =f/f0,f0=K−1(g/ h0)1/2θ, andK=5.23. Re-sults are presented in Fig. 4. Non-dimensional frequencies of maximal run-up amplificationF1=1 for different anglesα coincide very precisely. The coefficient of maximal ampli-fication, corresponding to the frequencyF1=1, is approx-imately the same for different inclinations:C∼20–25. The second peak of run-up amplification coefficient is observed for frequencyF2= (2.2–2.3)F1. Non-dimensional frequency F2 slightly depends on bottom slope; a small peak is ob-served also for frequencyF3∼3.5F1.
Fig. 3. Frequency dependence of amplitude on free surface dis-placement (resonance curve) (a), maximal run-up (b) and ampli-fication of run-up (ratio of the maximal run-up and the amplitude of surface wave) (c) for slope tanα=0.263.
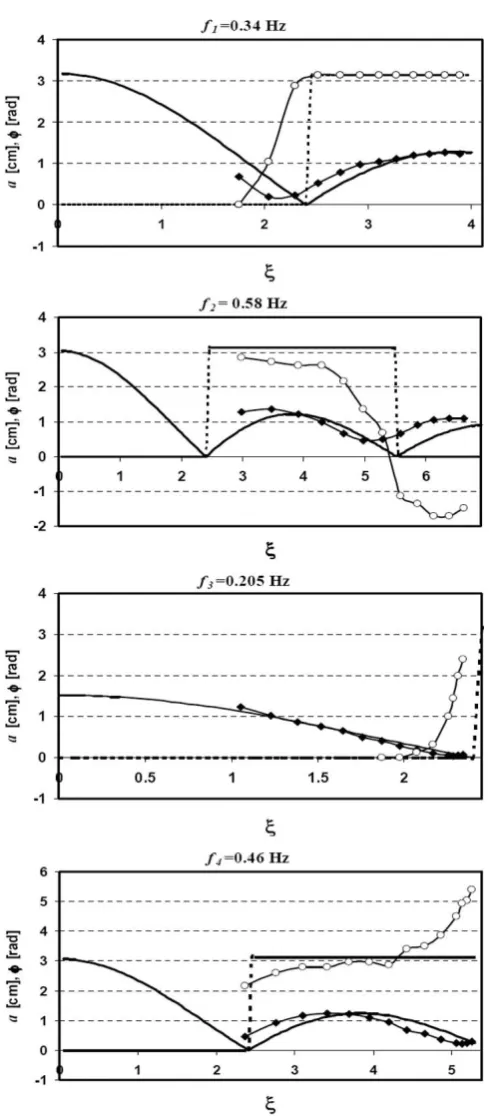
The wave breaking does not prevent precise determination of maximal run-up position. Excepting high frequencies of F >3, the wave front on a sloping beach was one dimen-sional, and maximal run-up did not depend on coordinates along the direction perpendicular to axis x. To study fre-quency dependence of run-up amplification more precisely, the spatial structures of the free surface oscillations occur-ring at frequencies corresponding to the resonant frequen-cies of the system (f1=0.34 Hz,f2=0.58 Hz) and at fre-quencies of maximum run-up amplification (f3=0.205 Hz, f4=0.46 Hz) have been investigated. The results are shown in Fig. 5 for bottom slopeθ=0.168. Amplitude and phase of free surface displacement are shown by diamonds and cir-cles. Experimental data are compared with the analytical so-lution (Eq. 3) for free surface displacementη. Theoretical curves obtained from Eq. (3) are shown in Fig. 5 by thick lines. The amplitudea and the phaseφof free surface har-monic oscillations are shown in Fig. 5. Because the Bessel function changes sign, amplitude is chosen asa=|J0|,φ=0 ifJ0>0 andφ=π if J0<0. One can find in Fig. 5 that in the experiment the amplitude does not go to zero and
Fig. 4. Dependence of run-up amplification on normalized fre-quency for different bottom slopes.
phase changes smoothly for all frequencies. Note that fre-quencies of maximal run-up amplification (f3=0.205 Hz, f4=0.46 Hz) correspond to spatial modes having minimal amplitudes near the wave maker; resonance frequencies (f1 =0.34 Hz,f2=0.58 Hz) have maximum amplitudes of free surface displacement near the wave maker. It should be noted that according to the solution (Eq. 1), frequencies of maximal run-up amplification correspond to the spatial modes with boundary condition η(L, t )=0, and resonant frequencies correspond to mode with boundary condition∂η (L, t ) /∂x= 0. In other words, if one uses the linear solution (Eq. 1), the coefficient of run-up amplification in this approximation would be infinite:a=0 atx=L. In the experiment, the am-plitude is small, but finite. Comparison of curves presented in Fig. 5a,b,c,d shows that differences between the theoret-ical solution and experimental data increase with frequency of excitation. For example, these differences are much more significant forf2than forf3.
Fig. 5. Comparison of the experimental values of amplitude (di-amonds) and phase (circles) with theoretical values of amplitude (thick solid lines) and phase (thick dashed lines) obtained from the Eq. (3),ξ=p4ω2x/gθ,θ=0.168; ends of horizontal axes corre-spond the positions of the wave-maker edge.
their data, it is possible to conclude that frequency of the sec-ond peak is 2.5–2.7 times more than frequency of the first one. In our experiments the frequency of the second peak exceeds the frequency of the first one 2.2–2.3 times. Exper-imental values of frequenciesf3−4practically coincide with frequencies of modes having nodes near the wave maker; nu-merical values (Stefanakis et al., 2011) exceed this frequency by 2.5 % for all bottom inclinations. The reason of such dif-ferences is not clear yet. Nonlinearity, wave dispersion, and viscous dissipation influence the frequency of these peaks, but simple estimations for linear waves in shallow water with zero viscosity provide values which are close to experimen-tal data. Authors Stefanakis et al. (2011) do not mention any dissipation of energy and nonlinear parameter, which they use in numerical simulations. As for the coefficient of run-up amplification, the maximal value that was observed in the experiment isC=20–25, whereas in Stefanakis et al. (2011) this value reachesC=50–60. The difference is apparently due to viscous dissipation, which is essential in our experi-ments. In addition, capillary effects can also affect the run-up if the value of run-run-up R is comparable with the capil-lary lengthRcap=
p
(2γ /ρg)(γ is coefficient of water sur-face tension,ρis water density). This fact was mentioned in Denissenko et al. (2011). For our experiment,Rcap=3 mm, for the most part the run-up measurements give us signif-icantly higher values. Nevertheless, for the maximum am-plification, the run-up is only 4 times more than the capil-lary length. Therefore, the decrease of coefficientCin com-parison with the theoretical value may be partly due to the capillary effect.
2 Conclusions
Acknowledgements. EP has been particularly supported by Pro-gram “Scientific-Pedagogical Personnel of Innovative Russia for 2009–2013” and RFBR grant (11-05-00062).
Edited by: R. Grimshaw
Reviewed by: O. Kimmoun and one anonymous referee
The publication of this article is financed by CNRS-INSU.
References
Antuono, M. and Brocchini, M.: Solving the nonlinear shallow-water equations in physical sense, J. Fluid Mech., 643, 207–232, 2010.
Carrier, G. F. and Greenspan, H. P.: Water waves of finite amplitude on a sloping beach, J. Fluid Mech., 4, 97–109, 1958.
Carrier, G. F., Wu, T. T., and Yeh, H.: Tsunami run-up and draw-down on a plane beach, J. Fluid Mech., 475, 79–99, 2003. Denissenko, P., Didenkulova, I., Pelinovsky, E., and Pearson, J.:
Influence of the nonlinearity on statistical characteristics of long wave runup, Nonlin. Processes Geophys., 18, 967–975, doi:10.5194/npg-18-967-2011, 2011.
Didenkulova, I. and Pelinovsky, E.: Rogue waves in nonlinear hy-perbolic systems (shallow-water framework), Nonlinearity, 24, R1–R18, 2011.
Didenkulova, I., Pelinovsky, E., Soomere, T., and Zahibo, N.: Runup of nonlinear asymmetric waves on a plane beach, in: Tsunami and Nonlinear Waves, edited by: Kundu, A., 175–190, 2007.
Kajiura, K.: Local behavior of tsunamis, in: Waves on Water of Vari-able Depth, edited by: Provism D. and Radok, R., Lecture Notes in Physics, Vol. 64, Springer, Berlin, 72–79, 1977.
Kˆano˘glu, U. and Synolakis, C.: Initial value problem solution of nonlinear shallow-water equations, Phys. Rev. Lett., 97, 148501, doi:10.1103/PhysRevLett.97.148501, 2006.
Keller, J. B. and Keller, H. B.: ONR Research Report Contract No. NONR-3828(00), 1964.
Kharif, Ch., Pelinovsky, E., and Slunyaev, A.: Rogue waves in the ocean, Springer, Berlin, Heidelberg, New York, 2009.
Madsen, P. A. and Fuhrman, D. R.: Run-up of tsunamis and long waves in terms of surf-similarity, Coastal Eng., 55, 209–223, 2008.
Neetu, S., Suresh, I., Shankar, R., Nagarajan, B., Sharma, R., Shenoi, S. S. C., Unnikrishnan, A. S., and Sundar, D.: Trapped waves of the 27 November 1945 Makran tsunami: observations and numerical modelling, Nat. Hazards, 59, 1609–1618, 2011. Nikolkina, I. and Didenkulova, I.: Rogue waves in 2006–2010, Nat.
Hazards Earth Syst. Sci., 11, 2913–2924, doi:10.5194/nhess-11-2913-2011, 2011.
Nikolkina, I. and Didenkulova, I.: Catalogues of rogue waves re-ported in media in 2006–2010, Nat. Hazards, 61, 989–1006, 2012.
Pelinovsky, E.: Nonlinear dynamics of tsunami waves, Institute of Applied Physics, Nizhny Novgorod, 1982 (in Russian). Pelinovsky, E. and Mazova, R.: Exact analytical solutions of
non-linear problems of tsunami wave run-up on slopes with different profiles, Nat. Hazards, 6, 227–249, 1992.
Slunyaev, A., Didenkulova, I., and Pelinovsky, E.: Rogue waters, Contemp. Phys., 52, 571–590, 2011.
Stefanakis, T. S., Dias, F., and Dutykh, D.: Local run-up amplifica-tion by resonant wave interacamplifica-tion, Phys. Rev. Lett., 107, 124502, doi:10.1103/PhysRevLett.107.124502, 2011.