www.pharmascholars.com
9
Original Article
CODEN: IJPNL6
STUDY ON COMPLEXATION OF ASCORBIC ACID DERIVATIVES
WITH
γ
-CYCLODEXTRIN
Yutaka Inoue
1,*, Misa Horage
1, Rina Suzuki
1, Daichi Niiyama
1, Ryota Urano
1, Shigeru Ando
2,
Junko Kikuchi
2, Isamu Murata
1, Ikuo Kanamoto
11
Laboratory of Drug Safety Management, Faculty of Pharmaceutical Science, Josai University,
1-1, Keyakidai, Sakado-shi, Saitama 3500295, Japan
2
Research Laboratory for Development, Shionogi & Co., Ltd.; 3-1-1, Futaba-cho, Toyonaka-shi,
Osaka 5610825, Japan
*Corresponding author e-mail:
[email protected]
Received on: 07-10-2016; Revised on: 29-10-2016; Accepted on: 21-11-2016
ABSTRACT
The aim of this study was to assess the physicochemical properties of a solid dispersion of L-ascorbyl 6-palmitate (ASCP) as poorly water soluble and γ-cyclodextrin (γCD) prepared by co-precipitation or co-grinding by using powder X-ray diffraction (PXRD), differential scanning calorimetry (DSC), Fourier transform infrared spectroscopy (FT-IR), nuclear magnetic resonance (solution state 1H-NMR and solid state 13C-NMR), and solubility test. Physical assessments and measurements indicated that a co-precipitate of ASCP and γCD resulted in inclusion complex formation at a molar ratio of 1:3 and that a ground mixture of ASCP and γCD resulted in inclusion complex formation at a molar ratio of 1:2. A solubility test revealed that the co-precipitate and ground mixture had improved solubility compared to ASCP alone. The co-precipitate had greater solubility than the ground mixture. This result is presumably due to molecular interaction occurring as result of the differences in the molar ratios and differences in the structure of complexes for ASCP and γCD in a solid state.
Keywords: L-ascorbyl 6-palmitate; γ-cyclodextrin; Inclusion complex; Ground mixture; Co-precipitate, Solubility
INTRODUCTION
Ascorbic acid (vitamin C) is a water-soluble vitamin with a lactone ring in its structure. Normally, ascorbic acid cannot be synthesized in the human body, so required amounts must be ingested. A deficiency in ascorbic acid is known to cause scurvy and accelerated senescence [1]. Ascorbic acid is an antioxidant with powerful reducing action. In the body, it eliminates reactive oxygen species and it stimulates the production of collagen, and it is used in various items such as supplements, health products, and cosmetics [2, 3]. However, ascorbic acid does not readily dissolve in an oleaginous base since it is readily soluble in water, and ascorbic acid
readily degrades into dehydroascorbic acid (an oxidized form of ascorbic acid) as a result of light, heat, or pH levels because of ascorbic acid’s low level of stability[4]. Over the past few years, various ascorbic acid derivatives have been synthesized in order to improve the stability of ascorbic acid [5, 6]. One such derivative is L-ascorbyl 6-palmitate (ASCP), which is an ester of palmitic acid (a saturated fatty acid) and ascorbic acid. ASCP is highly fat-soluble and is less sensitive to heat and light. In addition, ASCP retains the antioxidant action of ascorbic acid, so it is used in cosmetics and topical preparations [7]. Moreover, ASCP is known to be a surfactant and it is expected to have applications in the micellization and solubilization of drugs [8].
International Journal of Pharmacy
www.pharmascholars.com
10
Cyclodextrins (CDs) have a cyclic structure withglucopyranose units linked by α1-4glucoside bonds. Depending on the number of glucopyranose units, CDs are classified as α-cyclodextrin (αCD), β-cyclodextrin (βCD) or γ-β-cyclodextrin (γCD). αCD is a CD with 6 linked glucopyranose units, βCD is one with 7 linked units, and γCD is one with 8 linked units. CDs have hydrophilic rims and a hydrophilic opening but a hydrophobic cavity, so CDs in an aqueous solution are known to form inclusion complexes by incorporating various hydrophobic guest molecules via hydrophobic interaction [9]. When γCD complexes an alkyl chain (e.g. polyethylene glycol with an alkyl chain), it reportedly forms a pseudorotaxane structure [10, 11, 12]. Formation of inclusion complexes allows increased solubility and improved stability of a guest substance, improved bioavailability, controlled release, and improved taste [13, 14, 15, 16, 17]. Recently, Cyclochem has succeeded in commercially producing food ingredients by complexing (R)-α-lipoic acid which has low stability with γCD. Co-precipitation and co-grinding are two methods of preparing CD inclusion complexes [18, 19]. Co-precipitation dissolves a host substance with water and a guest substance with an organic solvent and then mixes the two solutions. This method of preparation allows molecules a greater degree of freedom since they are in solution and it encourages the formation of inclusion complexes. However, a sample has to be in solution, so this method takes time and effort and this method is not suitable for samples with a low stability in solution. Koontz et al. described preparing inclusion complexes of βCD and α-Tocopherol and inclusion complexes of γCD and quercetin using co-precipitation [20]. Co-grinding is a method of preparing samples in a solid state by grinding them together using a vibrating rod mill. This simple and quick method uses samples while they are still in powder form, so stability in solution need not be considered and solubilization need not be done. Ogawa et al. reported that co-grinding resulted in inclusion complexes of βCD and fentanyl forming [21]. However, heat arises during co-grinding, so this method is not suitable for samples that are sensitive to heat.
ASCP is an ester of ascorbic acid and palmitic acid (a saturated fatty acid). ASCP is poorly water soluble and less sensitive to light. These properties have hampered development of products containing ASCP, so preparing inclusion complexes of CD and ASCP in order to improve the solubility and stability of ASCP may facilitate future product development. Thus, the current study prepared co-precipitates and ground mixtures of ASCP and γCD, and this study
examined the physicochemical properties of inclusion complexes and the solubility characteristics of ASCP.
MATERIALS AND METHODS
Materials: ASCP (chemical purity, with 6-O-Palmitoyl-L-ascorbic Acid > 95.0%, molecular weight 414.54) was purchased from Tokyo Chemical Industry Co., Ltd. (Tokyo, Japan).γCD was purchased from MicroBiopharm Japan Co., Ltd.(Tokyo, Japan)(Fig.1). All other chemicals and solvents were of analytical grade and were purchased from Wako Pure Chemical Industries, Ltd. (Osaka, Japan).
(a)
(b)
Fig.1 Chemical Structures of (a) ASCP and (b) γCD
Methods
Preparation of the Co-precipitate (CP): ASCP was dissolved in methanol to a concentration of 0.19 M and γCD was dissolved in water to a concentration of 0.094 M. The ASCP/methanol solution (5 mL) was added to the aqueous γCD solution (5 mL). The solution was stirred at 50 °C for 1 hr and then stored for 24 hr at room temperature. The precipitate was washed with methanol, filtered, and then dried for 24 hr at room temperature.
www.pharmascholars.com
11
0.862 g), or 1:3 (weight of ASCP: 0.0963 g andweight of γCD: 0.904 g). Ground mixtures (GM) were prepared by grinding a PM (1.0 g) for 60 min using a vibration rod mill (TI-500ET, CMT Co.) with an alumina cell. Humidified samples were obtained by storing the GMs for 4 weeks at 40 ˚C and RH 82%. Samples were stored in a humidity-controlled atmosphere so that the GMs would retain their crystal structure.
Phase Solubility studies: Phase solubility studies carried out in water according to the method described by Higuchi and Connors. Excess ASCP (5 mg) was added to 10-mL aqueous solutions containing various concentrations of γCD (0–100 mM). Dispersion were obtained using a medium-sized constant-temperature shaking instrument for cultures (BR-42FL, TAITTEC Co., Ltd.) by shaking for 24 hr at 100 rpm (25 ± 5 ˚C). After dispersion filtered through 0.45-μm membrane filters, samples quantified. Determination of ASCP was performed by using high-performance liquid chromatography (Waters e2695, Waters, Japan). Chromatography was performed on a COSMOSIL 5C18-AR-Ⅱ (φ5 μm, 150 mm × 4 mm) kept at 40 ˚C, using a methanol / acetic acid buffer (pH6.5) (85/15) as a mobile phase. The retention time was 9 min, the injection volume was 100 μL, and the absorbance at 266 nm recorded. The solubility was used calculate the stability
constants, K1:1, K1:2 according to the following equation:
K1:1=slope/S0 (1-slope) ・・・(1)
Stot =S0 +K1:1S0 [CD]+K1:1K1:2S0 [CD]
2 ・・・ (2)
Powder X-ray Diffraction (PXRD): The PXRD patterns of the samples were measured using an X-ray diffractometer (MiniFlex II, Rigaku) with Cu Kα radiation, a voltage of 30 kV, a current of 15 mA, a scan range of 3-40˚, and a scan rate of 4˚/min.
Differential Scanning Calorimetry (DSC): The thermal behavior of the samples was recorded using a differential scanning calorimeter (Thermo Plus Evo, Rigaku) with a nitrogen flow rate of 60 mL/min and a heating rate of 1.0 ˚C/min from 50 to 150 ˚C.
Solution state 1H NMR Measurement: The 1H NMR spectra of the samples were measured using an NMR spectrometer (Varian NMR System 400, Agilent) with a dimethyl sulfoxide-d6 (DMSO-d6) solution. The measurement conditions were as follows: a pulse width of 45 degrees, a measurement range of 6410.3 Hz, an acquisition time of 3.500 s, a relaxation time of 1.500 s, a scan time of 21 min, and a temperature of 295 K.
Fourier Transform Infrared (FT-IR)
Spectroscopy: The FT-IR absorption spectra of samples were recorded using a spectrometer (FT-IR-410, JASCO) based on the KBr disk method. Scanning was performed over a range of 400-4000 cm-1 with a resolution of 4 cm-1. The scan time was 16 s. Each sample was dried in a vacuum dryer. Solubility Test: Samples were dispersed in distilled water so that concentration of ASCP would be 5 mg/mL. The suspensions were shaken for 1, 3, 6, and 24 hr at a temperature of 37 ˚C. After suspensions were filtered through 0.45-μm membrane filters, samples were quantified. Determination of ASCP was done using high-performance liquid chromatography (Waters e2695, Waters, Japan). Chromatography was performed on a COSMOSIL 5C18-AR-Ⅱ (φ5 μm, 150 mm × 4 mm) kept at 40 ˚C, using a methanol / acetic acid buffer (pH6.5) (85/15) as a mobile phase. The retention time was 9 min, the injection volume was 100 μL, and the absorbance at 266 nm was recorded.
Solid state 13C NMR and 1H and 13C T1
Measurements: All solid state NMR spectra were obtained on a Varian NMR System 600 MHz NMR spectrometer (Varian NMR Inc., U.S.A) operating at a frequency of 150.8 MHz for 13C. 13C cross-polarization experiments were performed using a Varian 3.2 mm T3 NB double resonance probe spinning at a magic angle spinning rate of 20 kHz. The 13C spectra were measured under the following conditions: a spectral width of 43,103 Hz, an acquisition time of 40 ms, a recycle delay time of 10 to 20 s, a contact time of 3 ms, a 13C π/2 pulse length of 2.0 µs, and a 1H π/2 pulse length of 2.1 µs. Adamantane was used as a chemical shift reference at 38.52 and 29.47 ppm for 13C. Experiments were performed at 10°C to minimize the effect that frictional heating by high-speed rotation had on samples. 1H T1 and 13C T1 values were determined using the inversion recovery method followed by 13C detection and the Torchia method. Measurement was Integral value of the guest molecule per 1H
Integral value of the host molecule per 1H …(1)
=
www.pharmascholars.com
12
Fig.2 Phase solubility diagrams of ASCP with γCD.performed at 10ºC and 95ºC. The 5 times values of 1
H T1 values were used as the recycle delay time to the extent possible (5 to 100 s).
RESULTS AND DISSCUTION Phase Solubility diagram:
A phase solubility diagram is shown in Fig. 2. According to the classification of Higuchi et al., the solubility of ASCP in water increases as a quadratic function with addition of γCD, producing an Ap diagram, but that solubility then decreases as a quadratic function, producing a Bs diagram. A phase diagram of ASCP forming an inclusion complex with γCD at a ratio of 1:1 is known to depict solubility increasing linearly, producing an AL diagram [22]. An inclusion complex of ASCP and γCD at a ratio of 1:2 continuously reacts starting at a ratio of 1:1. In the solubility diagram here, solubility increased as a quadratic function, producing an Ap diagram. Thus, Eq.(2) is used. Accordingly, in solution ASCP and γCD presumably form an inclusion complex at a ratio of 1:2. The apparent stability constant K1:1 for ASCP/γCD at a ratio of 1:1 was calculated in accordance with Eq.(1) based on the slope and intercept (S0) of the initial rise in the phase solubility diagram. The apparent stability constant K1:2 for ASCP/γCD at a ratio of 1:2 was calculated in accordance with Eq.(2) based on the total solubility and (Stot) and concentration of CD ([CD]) [22]. K1:1 was 183.4 M-1 and K1:2 was 68.3 M-1.
0 5 10 15 20
0 20 40 60 80 100
Concentration of γCD (mM)
C o n ce n tr atio n o f A SC P (mM )
Examination of the crystalline state: PXRD was performed to examine the crystal state of the GMs and CP of ASCP and γCD (Fig. 3). With ASCP and the PM (1:1), characteristic peaks due to ASCP (●) were observed at 2θ = 3.8˚ and 5.6˚. With ASCP ground for 60 min, diffraction peaks due to ASCP were noted at 2θ = 3.8˚ and 5.6˚. With γCD ground for 60 min, however, a halo pattern was displayed. In addition, diffraction peaks due to ASCP were
observed at 2θ = 3.8˚ and 5.6˚ with the GM (1:1). These results suggest that excess ASCP is present in the GM (1:1). With the GMs (1:2 and 1:3), however, characteristic peaks for ASCP and γCD were not observed, and a halo pattern was displayed. It reported that co-grinding of the lipid-lowering drug gemfibrozil and dimethyl-β-cyclodextrin results in an amorphous PXRD pattern [19]. Inclusion complexes with CD are formed due to mechano-chemical action such as microparticle formation, crystallization reactions, solid-solution reactions and phase transition reactions caused by mechanical energy produced by friction, and compression and other factors present during the grinding of solid materials [23, 24]. The current results suggested that co-grinding of ASCP and γCD resulted in a drop in crystallinity at a molar ratio of ASCP:γCD = 1:2 or higher due to disturbance of the regularity of the crystal lattice in ASCP. Its structure may be amorphous and ASCP was included in the γCD cavity, suggesting that the existence of a crystal structure unlike that of ASCP crystals.
www.pharmascholars.com
13
(d)5 10 15 20 25 30 35
2θ degree ●
●
□ □
□
□
(i)
(k) (a)
(b)
● ● (g)
(h)
(j) (c)
● ●
● ● ●
●
(e)
(f)
Intensit
y
(c
ps)
Fig.3 PXRD patterns of ASCP:γCD systems.
(a) ASCP, (b) γCD, (c) γCD ground 60min, (d) PM (ASCP:γCD=1:1) , (e) PM (ASCP:γCD=1:2), (f) PM (ASCP:γCD=1:3), (g) GM (ASCP:γCD=1:1), (h) GM (ASCP:γCD=1:2), (i) GM (ASCP:γCD=1:3), (j) GM (ASCP:γCD=1:2) after storage at 40ºC and RH82% for 4weeks, (k) CP
●:Specific peak of ASCP
□:Specific peak of tetragonal-columnar form
Examination of thermal properties
The formation of an inclusion complex between CD and a drug is reported to result in changes in thermal behavior [19]. Therefore, DSC was performed in order to observe the thermal behavior of ASCP (Fig. 4). With ASCP, an endothermic peak due to ASCP was observed around 114 °C. With the PM, an endothermic peak due to ASCP was similarly observed around 114 °C. However, no endothermic peak was observed with the GM (1:2). This variation in the thermal behavior of the GM (1:2) and CP indicated that the endothermic peak observed with ASCP and the PM disappeared. Anselmi et al. reported that, formation of an inclusion complex of ferulic acid and γCD results in changes in thermal behavior, and they noted that the endothermic peak due to ferulic acid disappeared [18]. Disappearance of the endothermic peak was presumably because ASCP had entered the interior of γCD. This also suggested interaction between molecules in a solid state and CP (ASCP/γCD).
50 100 150
Temperature (ºC)
(d) (a)
(b)
(c)
114 114
Endothe
rm
ic
(e)
www.pharmascholars.com
14
FT-IR analysis:The results of PXRD and DSC suggested molecular interaction of ASCP and γCD. FT-IR spectroscopy was performed to examine the mechanism of this interaction in more detail (Fig. 5). With γCD, a peak due to the hydroxy group (-OH) was observed 3371 cm-1. With the PM (1:2), shifts in the various peaks were not noted. With the GM (1:2), however, the peak due to the hydroxy group (-OH) of γCD was found to undergo a low wavenumber shift to about 3363 cm-1 [10]. Peaks due to the olefin group (-CH2-) of ASCP were found to shift to 2922 cm-1 and 2851 cm-1 [23]. These results suggest that in the GM (1:2) the hydroxy group in γCD and the olefin group (-CH2-) in the molecular structure of ASCP are involved in the hydrophobic hydrogen bonding in inclusion compound formation. In the GM, the inclusion molar ratio was found to be ASCP: γCD = 1:2. Compared to the CP, the GM has one fewer γCD molecule for each ASCP molecule. The reason for this is presumably because co-precipitation involves preparing substances in a solution whereas co-grinding prepares substances in a solid state. Thus, differences attributable to inclusion affect the degree of freedom of each molecule. With the CP, the peak due to the hydroxy group (-OH-) was observed to undergo a low wavenumber shift to about 3356 cm-1. With ASCP, absorption peaks due to the stretching vibration of the olefin group (-CH2-) of ASCP were observed around 2918 cm-1 and 2850 cm-1, but with the CP these peaks underwent a high wavenumber shift to 2926 cm-1 and 2857 cm-1, respectively. The absorption peak 1733 cm-1 due to the stretching vibration of the carbonyl group (C = O) of ASCP, which was observed with ASCP, was observed to broaden by the CP. This indicated that the method by which the GM (1:2) and the CP were prepared resulted in differing interaction in the GM and in the CP. Nishimura et al. reported that coenzyme Q10 and γCD form an inclusion complex with a pseudorotaxane structure and that the isoprenoid chain of coenzyme Q10 forms a hydrogen bond with the hydroxy group of γCD[10]. They also reported that the absorption peak due to the isoprenoid chain shifts to a high wavenumber. Ogawa et al. found that formation of an inclusion complex by βCD and fentanyl resulted in a shift in the absorption peak due to the carbonyl group of fentanyl[21]. They reported that this phenomenon occurs since a hydrogen bond
forms between the hydroxy group of βCD and the carbonyl group of fentanyl. These results suggest that the hydroxy group (-OH) of γCD and the olefin group (-CH2-) and carbonyl group (C = O) in the molecular structure of ASCP are involved in the hydrophobic hydrogen bonding in inclusion compound formation.
www.pharmascholars.com
15
14001800 1700 1600 1500
2800 3000 3200 3400 3600 3800
T
rans
m
iss
ion
(%
)
Wavenumber(cm
-1)
(d)
(a)
(b)
(c)
18
18 50
50
33
33 98
71
96
22 51
63
(e)
26 57
56
35
35
Fig.5 IR spectra of ASCP:γCD systems.
www.pharmascholars.com
16
c
ppm
7 6 5 4 3 2 1 0
(b)
(c)
ASCP Glucopyranose
3
1 4
2 6
5
e g i k m o q
b
a c d f h j l n p r
a b
c d
f~q
r
3 ,6 ,5 2 ,4
1
a b
f~q
r 3 ,6 ,5
1
(0.
132)
(1.
06)
(1.
00)
2 ,4
=Guest molecule (mol)
Host molecule (mol) Inclusion molar ratio
= 1.06 / 24H
1.00 / 8H
= 0.044 / 1H
0.125/ 1H ≒
1
3
(a)
www.pharmascholars.com
17
Solubility:Results suggested formation of inclusion complexes between ASCP and γCD as a result of both grinding and co-precipitation. Therefore, the solubility of ASCP due to formation of inclusion complexes was examined. Figure 7 shows the results of solubility testing of ASCP, γCD, PM (1:2), GM (1:2), and CP. After grinding for 60 min, the solubility of ASCP was as follows: ASCP: 0.78±0.21 μg/mL, PM (1:2): 4±1.21 μg/mL, GM (1:2): 12.1±3.04 μg/mL, and CP: 79.3±10.80 μg/mL. Compared to ASCP, the GM (1:2) had improved solubility of about 15-fold, and
the CP had improved solubility of about 102-fold. Differences in the solubility of ASCP presumably arise in comparison to the GM and CP due to molecular interaction with γCD in a solid state and differences in the molar inclusion ratio. In a solubility test, the GM (1:2) and CP had improved solubility compared to ASCP alone. The CP in particular was found to have markedly improved initial solubility. The extent of this improvement in solubility was presumably due to the interaction of ASCP and γCD in the GM (1:2) and the CP (1:3).
0 10 20 30 40 50 60 70 80 90 100
0 3 6 9 12 15 18 21 24
C
once
nt
rat
ion
of
A
SC
P
(μg
/m
L)
Time (hr)
02 4 6 8 10 12 14 16
0 1 2 3 4 5 6
C
on
ce
n
tr
at
io
n
of
A
S
C
P
(
μg
/m
L
)
Time(hr)
Fig.7 Comparison of grinding method and co-precipitation method in the improvement of the solubility of ASCP. ○:ASCP, □:PM (ASCP:γCD=1:2), ▲:GM (ASCP:γCD=1:2), ◆:CP
Results were expressed as mean±S.D. (n=3)
Examination molecular states in solid states: Solid state 13C NMR spectroscopy was performed in to examine structural changes in more detail. Solid state 13
C NMR spectra for 7 samples-ASCP, γCD, ASCP ground for 60 min, γCD ground for 60 min, PM (1:2), GM (1:2), and CP are shown in Fig. 8. With ASCP ground for 60 min, the spectrum similar to that for ASCP was observed, and no changes in the shape of crystals or crystallinity were noted. In contrast, grinding of γCD resulted in broad solid state 13C NMR spectrum, indicating that the crystallinity of γCD had decreased and that γCD changed to amorphous. The PM was found to have the same
www.pharmascholars.com
18
symmetry of the formation of the γCD ring andformation of an ordered structure of γCD and ASCP. The 13C chemical shifts also changed, possibly indicating substantial structural changes as a result of interaction. The 13C signals for ASCP were broader than those for ASCP crystals and the chemical shifts changed substantially from those noted with ASCP. In addition, the signals of the methylene chain were observed as relatively sharp signals at 20 to 45ppm equally to those of γCD. Thus, this hydrophobic portion was presumably included in the γCD cavity.
ASCP Glucopyranose
3
1 4
2 6
5
h j l n p r t v
f
b c
a d e
g
i k m o q s u
j-s
(a)
(b)
(g)
(e)
(f)
(c)
(d)
d e
f
d f
e
6
1 4
2 3,5
180 160 140 120 100 80 60 40 20
ppm
Fig.8 Solid state 13C NMR spectra of ASCP:γCD systems.
(a) ASCP ground 60min, (b) ASCP, (c) γCD ground 60min, (d) γCD, (e) PM(1:2), (f) GM(1:2), (g) CP
Examination of solid state 13C NMR and 1H and
13C T
1 Measurements: 1H T
1 and 13C T1 values were obtained to assess changes in molecular mobility for different molecules in each sample. Strong homonuclear dipolar interaction results in faster spin diffusion, and T1 values are known to be consistent among domains within the same crystals. Usually 1H T1 values are determined using the inversion recovery method by using broad 1H signals. However, in this method, the individual 1H T1 values for ASCP and γCD cannot be identified separately, as 1H signals in solid state are very broad. So the current study used the inversion recovery method followed by 13C detection with cross-polarization between 1H and 13C. This method of measurement yields 1H T1 values for 1H bound to each carbon, so 1H T1 values due to ASCP and 1H T1 values due to γCD can be differentiated. The resulting 1H T1 values are shown in Table 1. 1H T1 value was measured in several samples under two temperature conditions, 10°C and 95°C, but substantial changes were not noted. Molecular mobility is presumed to change little within this range of temperatures. That said, different samples had substantially different 1H T1 values and substantial differences in molecular mobility. Grinding of γCD resulted in an amorphous structure by the PXRD analysis. As expected, ground γCD produced shorter 1H T1 values than intact γCD did, and ground γCD had increased molecular mobility. Intact ASCP produced a 1H T1 value of 20.28 s while the 1H T1 value for ASCP in the GM (1:2) was shorter. This is presumably because ASCP is amorphous. The 1H T1 values for γCD ground for 60min were 1.42. In contrast, the 1H T1 value for γCD in the GM (1:2) was 2.74, so the 1H T
1 value was longer than ground γCD. This suggests that molecular mobility decreased due to some form of interaction. However, the 1H T1 value of 4.85 for ASCP did not coincide with the 1H T1 value of 2.74 for γCD. The mobility of these two molecules differs, resulting in only partial compatibility. Thus, interaction between them may be weak. With the CP, the 1H T1 values for ASCP and γCD were equivalent (about 1.4). This suggested that the two molecules are compatible since they approach one another as a result of their interaction. With the CP, the 1H T1 value for ASCP was extremely short and The ASCP in the CP was found to have substantially increased molecular mobility. This increased compatibility and increased molecular mobility in the CP may have caused an increase in initial solubility.
www.pharmascholars.com
19
Table 1.1H T1 value of ASCP:γCD analysis.Temp 10˚C Temp 95˚C
sample
ASCP γCD-C2,3,5 ASCP γCD-C2,3,5
T1 error T1 error T1 error T1 error
ASCP intact 20.28 0.15 - - 21.85 0.26
-γCD intact - - 2.07 0.01 - - 1.89 0.02
γCD ground 60 min - - 1.42 0.02 - - -
-PM (1:2) 18.9 0.21 1.75 0.04 - - -
-GM (1:2) 4.85 0.38 2.74 0.04 4.90 0.30 2.77 0.02
CP 1.35 0.06 1.39 0.01 1.14 0.11 1.37 0.08
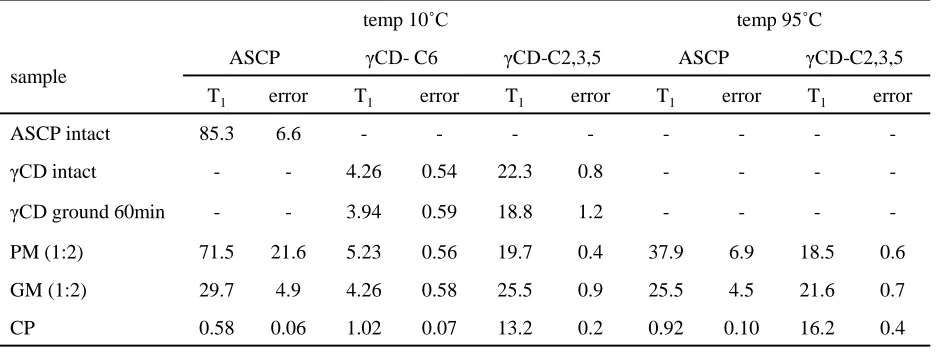
13
C T1 values are shown in Table 2. Comparison of 13C T
1 values yields information regarding the mobility of individual carbons within a molecule. Comparison of the 13C T1 values at 10°C and 95°C indicated that molecular mobility in the PM and GM (1:2) increased as the temperature rose, resulting in shorter 13C T1 values. Thus, there are regions with relatively little molecular mobility in the PM and GM (1:2). In contrast, the rise in temperature resulted in larger 13C T1 values for the CP. Thus, there are regions with substantial molecular mobility in the CP. There were errors in the 13C T1 values for the PM because it wasn’t possible to get enough S/N, but the 13C T
1 values were roughly equivalent to those for ASCP and γCD. Physical mixing does not cause interaction between the two, and the 13C T1 values corroborate this contention. Solid state 13C NMR spectra and PXRD results indicate that both the γCD and the ASCP in GM are amorphous. The 13C T1
values of ASCP in GM were shorter than those of ASCP intact. ASCP alone cannot be prepared in an amorphous form, so ASCP itself is not amorphous. Thus, 13C T1 values between ASCP in GM and ASCP amorphous cannot be compared. γCD in the GM produced longer 13C T1 values than did ground γCD, so 13C T1 values presumably indicate that there is interaction between γCD and ASCP. 13C T
1 values changed markedly for the CP. In the solid state 13C NMR spectrum, ASCP produces sharp signals. Although ASCP is presumed to not be amorphous, it produces extremely small T1 values and it has increased molecular mobility. T1 values for γCD are also extremely small, indicating substantially increased molecular mobility. Compatibility cannot be discussed using 13C T1 values, but those values did indicate greatly increased molecular mobility. This increased molecular mobility is likely to have helped to improve initial solubility.
Table 2 13C T1 value of ASCP:γCD analysis
temp 10˚C temp 95˚C
sample ASCP γCD- C6 γCD-C2,3,5 ASCP γCD-C2,3,5
T1 error T1 error T1 error T1 error T1 error
ASCP intact 85.3 6.6 - - -
-γCD intact - - 4.26 0.54 22.3 0.8 - - -
-γCD ground 60min - - 3.94 0.59 18.8 1.2 - - -
-PM (1:2) 71.5 21.6 5.23 0.56 19.7 0.4 37.9 6.9 18.5 0.6
GM (1:2) 29.7 4.9 4.26 0.58 25.5 0.9 25.5 4.5 21.6 0.7
www.pharmascholars.com
20
CONCLUSIONThe above results suggest molecular interaction between ASCP and γCD as a result of co-precipitation and grinding. Results also indicated the inclusion molar ratio for the CP (ASCP:γCD = 1:3) and GM (ASCP:γCD = 1:2), and results suggested that the inclusion molar ratio differs depending on the method of preparation method. Differences in the structure of inclusion complexes occurred due to differences in the method of preparation, and there were accompanying differences in ASCP solubility. Physicochemical methods of assessment such as PXRD, DSC, and solution state 1H NMR were unable to reveal the mechanism of solubility of ASCP and γCD complexes. However, solid state 13C NMR provided a great deal of information about the status and the mobility of molecules in a solid state. 1H and 13
C T1 values decreased for the GM presumably since
the mobility of γCD and ASCP molecules increased. Furthermore, solid state 13C NMR spectra suggested the formation of regular structure with γCD and ASCP in the CP, and 1H and 13C T1 values suggested an increase in mobility. These differences presumably accounted for improved initial solubility of the CP in comparison to ASCP. A system of assessment using solid state 13C NMR should provide a basis for development of new preparations for future use in pharmaceuticals, foods, and cosmetics.
Acknowledgement: The authors wish to thank Cyclo Chem Co. Ltd. for providing γCD.
Conflict of interest: The authors report no conflicts of interest. The authors alone are responsible for the content and writing of this paper.
REFERENCES
1. Grosso G, Bei R, Mistretta A, Marventano S, Calabrese G, Masuelli L, Giganti MG, Modesti A, Galvano F, Gazzolo D. A review of evidence Front Biosci, 2013; 18: 1017-29.
2. Niki E, Saito T, Kawakami A, Kamiya Y. J Biol Chem, 1984; 10: 4177-82. 3. Telang PS. Indian Dermatol Online J, 2013; 4: 143-46.
4. Ahmad I, Sheraz MA, Ahmed S, Shaikh RH, Vaid FH, ur Rehman Khattak S, Ansari SA. AAPS Pharm Sci Tech, 2011; 12: 917-23.
5. Ochiai Y, Kaburagi S, Obayashi K, Ujiie N, Hashimoto S, Okano Y, Masaki H, Ichihashi M, Sakurai H. J Dermatol Sci, 2006; 44: 37-44.
6. Huang WY, Lee PC, Huang LK, Lu LP, Liao WC. Bioorg Med Chem Lett, 2013; 15: 1583-87. 7. Segall AI, Moyano MA. Int J Cosmet Sci, 2008; 30: 453-58.
8. Moribe K, Limwikrant W, Higashi K, Yamamoto K. J Drug Deliv, 2011;138929. 9. Brewster ME, Loftsson T. Adv Drug Deliv Rev, 2007; 59: 645-66.
10.Nishimura K, Higashi T, Yoshimatsu A, Hirayama F, Uekama K, Arima H. Chem Pharm Bull, 2008; 56: 701-6.
11.Shuichi M, Akito K, Shigesada H, Yuki N, Toshiko T, Yukiko U, Daisuke N, Hiroshi F, Keiji, T. Chem-Bio Informatics Journal, 2009; 9: 1-11.
12.Higashi T, Nishimura K, Yoshimatsu A, Ikeda H, Arima K, Motoyama K, Hirayama F, Uekama K, Arima H. Chem Pharm Bull, 2009; 57: 965-70.
13.Zhang QF, Nie HC, Shangguang XC, Yin ZP, Zheng GD, Chen JG. J Agric Food Chem, 2013; 61: 151-56. 14.Zhang SX, Fan MG, Liu YY, Ma Y, Zhang GJ, Yao JN. Langmuir, 2007; 23: 9443-46.
15.Miyoshi N, Wakao Y, Tomono S, Tatemichi M, Yano T, Ohshima H. J Nutr Biochem, 2011; 22: 1121-26. 16.Martin A, Tabary N, Leclercq L, Junthip J, Degoutin S, Aubert-Viard F, Cazaux F, Lyskawa J, Janus L, Bria
M, Martel B. Carbohydr Polym, 2013; 93: 718-30.
17.Tan Q, Zhang L, Zhang L, Teng Y, Zhang J. Chem Pharm Bull, 2012; 60: 1514-21.
18.Anselmi C, Centini M, Ricci M, Buonocore A, Granata P, Tsuno T, Facino RM. J Pharm. Biomed Anal, 2006; 40: 875-81.
19.Aigner Z, Berkesi O, Farkas G, Szabó-Révész P. J Pharm Biomed Anal, 2012; 57: 62-67. 20.Koontz JL, Marcy JE, O'Keefe SF, Duncan SE. J Agric Food Chem, 2009; 57: 1162-71.
www.pharmascholars.com
21
22.Audur Magnusdottir A, Másson M, Loftsson T. J Incl Phenom Macroc Chem, 2002; 44: 213-18.23.Duri S, Tran CD. Langmuir, 2013; 29: 5037-49.
24.Ikeda A, Ishikawa M, Aono R, Kikuchi J, Akiyama M, Shinoda W. J Org Chem, 2013; 78: 2534-41.
25.Higashi K, Ideura S, Waraya H, Limwikrant W, Moribe K, Yamamoto K. Chem Pharm Bull, 2010; 58: 769-72.