Solar Data Logger
Surendra Kumar Tripathi Kunwar Abhay Singh
Associate Professor UG Student
Department of Electrical & Electronics Engineering Department of Electrical & Electronics Engineering
Krishna Institute of Engineering and Technology, Ghaziabad India
Krishna Institute of Engineering and Technology, Ghaziabad India
Pallavi Ojha Anmol Kumar Baliyan
UG Student UG Student
Department of Electrical & Electronics Engineering Department of Electrical & Electronics Engineering
Krishna Institute of Engineering and Technology, Ghaziabad India
Krishna Institute of Engineering and Technology, Ghaziabad India
Abstract
Solar intensity data log is an instrument for calibrating the insolation of sun radiations. Being aware of the available intensity of an area, it is easier to design and implement a solar power plant in specifically identified area. Such a design criteria need to identify the number of solar cells [1] and their placement as per the radiation level and how much battery to store the generated power. The conventional existing technology to measure solar intensity is Pyranometer which is a broad spectrum device. This device manages the calculations for the whole spectrum which includes radiations which may not provide any work function. Therefore the efficiency of this device is very low. Considering the above mentioned factors, a low cost device for measurement of solar intensity is designed and is presented in this paper. This will contribute in providing intensity manipulation for the relevant spectrum of solar radiation.
Keywords: Calibrating, Insolation, Radiations, Pyranometer, Spectrum
________________________________________________________________________________________________________
I. INTRODUCTION
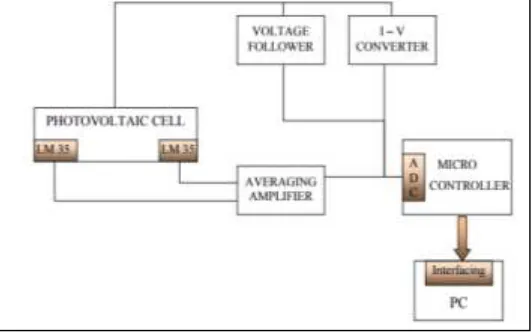
Device that records data for a given time in relation to location either with an available instrument or sensor or through external instruments and sensors is called Data Logger. They are generally small, battery powered, reliable, and equipped with a microprocessor, internal memory for data storage, and various sensors (Current, Voltage and many others). Some data loggers interface with a personal computer, and use software to activate it and to view and analyse the collected data, while many others have a local interface device (keypad, LCD) and can be used as a stand-alone device. Data loggers vary between general purpose types or specific environment [2] or application type only. General purpose types needs to be programmed; however, many data loggers remain as static machines with only a limited number or non-changeable parameters. Electronic data loggers have replaced chart recorders in variety of applications. One of the fundamental benefits of utilizing data loggers is the capacity to automatically collect data on a 24-hour basis where data can be very accurately recoded during a particular hour, minute, second or mili second of a day, week, month or year. Upon activation, data loggers are deployed to measure and record information for the specific duration of the monitoring period. This permits a comprehensive and accurate scenario of the environmental conditions being monitored [14] [15], such as solar intensity, air temperature and relative humidity. Renewable source of energy harnessed through photovoltaic cell [9] [10] can also be now be measured and stored in a memory card for various usage.
II. PROJECT DESCRIPTION
Knowledge Formats
Standardisation of protocols and knowledge formats has been a drag however is currently growing within the trade and XML, JSON, and YAML are progressively being adopted for knowledge exchange. The event of the linguistics net and therefore the web of Things is probably going to accelerate this gift trend.
Instrumentation Protocols
Several protocols are standardised together with a wise protocol, SDI-12, that permits some instrumentation to be connected to a spread of knowledge loggers. The employment of this normal has not gained abundant acceptance outside the environmental trade. SDI-12 additionally supports multi drop instruments. Some knowledge work corporations also are currently supporting the MODBUS normal. This has been used historically within the industrial management space, and there are several industrial instruments that support this communication normal. Another multi drop protocol that is currently commencing to become a lot of wide used is predicated upon will Bus (ISO 11898). Some knowledge loggers use a versatile scripting atmosphere to adapt themselves to numerous non-standard protocols .MODBUS could be a serial prescript originally revealed by an ovulatory drug (now Schneider Electric) in 1979 to be used with its programmable logic controllers (PLCs). Easy and strong, it's since become a factual normal protocol, and it's currently a usually on the market means that of connecting industrial electronic devices.
Knowledge Work versus Knowledge Acquisition
The terms knowledge work and knowledge acquisition are typically used interchangeably. However, in a very historical context they're quite completely different. {Knowledge/ an information} feller could be a data acquisition system; however a knowledge acquisition system isn't essentially a knowledge feller.
Data loggers usually have slower sample rates. A most sample rate of one Hz could also be thought of to be in no time for a knowledge feller, nonetheless terribly slow for a typical knowledge acquisition system.
Data loggers are implicitly complete devices, whereas typical knowledge acquisition system should stay bound to a laptop to amass knowledge. This complete side {knowledge of information} logger implies on-board memory that's wont to store no inheritable data. Typically this memory is extremely massive to accommodate several days, or maybe months, of unattended recording. This memory could also be battery-backed static random access memory, non-volatile storage or EEPROM. Earlier knowledge loggers used storage device, punched paper, or directly visible records like "strip chart recorders".
Given the extended recording times of knowledge loggers, they usually feature a mechanism to record the date and time in a very timestamp to make sure that every recorded knowledge worth is related to a date and time of acquisition so as to supply a sequence of events. As such, knowledge loggers usually use inherent time period clocks whose revealed drift will be a very important thought once selecting between knowledge loggers.
Data loggers vary from easy monaural input to complicated multi-channel instruments. Typically, the less complicated the device the less programming flexibility. Some a lot of subtle instruments give cross-channel computations and alarms supported preset conditions. The latest of knowledge loggers will serve sites, permitting various individuals to watch a system remotely.
The unattended and remote nature of the many knowledge feller applications implies the necessity in some applications to’ control from a DC power supply, like a battery. Alternative energy could also be wont to supplement these power sources. These Constraints have typically crystal rectifier to make sure that the devices they market are extraordinarily power economical relative.
To computers. In several cases they're needed to control in harsh environmental conditions wherever computers won't perform Faithfully.
This unattended nature additionally dictates that knowledge loggers should be extraordinarily reliable. Since they will operate for long periods nonstop with very little or no human management, and should be put in in harsh or remote locations, it’s imperative that goodbye as they need power, they're going to not fail to log knowledge for any reason. Makers visit nice length to make sure that the devices will be relied on in these applications. in and of itself data loggers are nearly fully resistant to the issues that may have an effect on a general laptop within the same application, like program crashes and therefore the instability of some in operation systems.
Data logging Applications
Electric Utilization Applications
Component Life Extension Studies in the Nuclear Industry Temperature Study Underwater Power Distribution Cable Super heater tube profiling
Meteorological Applications Rain Fall Totalization
Cup Anemometer Wind Speed Wind Direction and Averaging
Process Industry Applications Metal Refining and Production Energy usage overview [4] Process control tuning Outflow monitoring
HVAC System troubleshooting Cooling tower efficiency studies Compressed Air Audit
Mobile / Vehicle Testing Applications Vehicle HVAC testing
Reliability studies
Cycled Temperature qualification Exhaust Component Road Testing Vehicle Performance Tuning
Environmental Studies Applications [14] Noxious Gas Detection
Air pollution site monitoring / alarming CEMS certification
Bio-remediation studies
Nitrogen Dioxide Base Line Study Mining Industry Applications Machinery testing
Energy efficiency studies Shoring studies
Ventilation / Gas monitoring
III. WORKING AND METHODOLOGY
MISO/MOSI Coupling of Microcontroller and SD Card Module Sample Programme
The SD Card Module works with standard MicroSD Cards which operating voltage is 3.3 V. Therefore, the module has a voltage regulator and a level shifter so that we can use it with the 5 V pins of the Arduino Board. The SD Card Module have six pins, two for powering the module, the VCC and the GND pins, and four more pins for the SPI communication. Here’s how we need to connect it to the Arduino Board.
MOSI Coupling Programme /*
* Arduino SD Card Tutorial Example *
* by Dejan Nedelkovski, www.HowToMechatronics.com */
#include <SD.h> #include <SPI.h> File myFile;
int pinCS = 53; // Pin 10 on Arduino Uno void setup() {
Serial.begin(9600);
pinMode(pinCS, OUTPUT); // SD Card Initialization if (SD.begin())
{
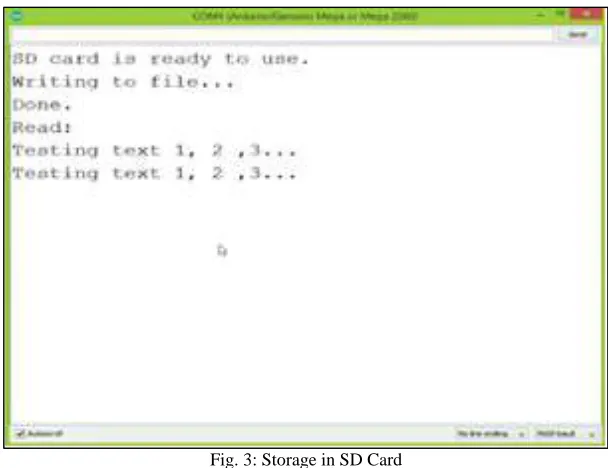
Serial.println("SD card is ready to use."); } else
{
return; }
// Create/Open file
myFile = SD.open("test.txt", FILE_WRITE); // if the file opened okay, write to it:
if (myFile) {
Serial.println("Writing to file..."); // Write to file
myFile.println("Testing text 1, 2 ,3..."); myFile.close(); // close the file
Serial.println("Done."); }
// if the file didn't open, print an error: else {
Serial.println("error opening test.txt"); }
// Reading the file
myFile = SD.open("test.txt"); if (myFile) {
Serial.println("Read:"); // Reading the whole file while (myFile.available()) { Serial.write(myFile.read()); }
myFile.close(); }
else {
Serial.println("error opening test.txt"); }
}
void loop() { // empty }
Code Description
Fig. 3: Storage in SD Card Conversion of SD Card Data into .XLS File
First we need to include the libraries needed for both modules, then create the two objects and in the setup section initialize them. In the loop section using the Serial.print() funtion we will print the time and the temperature values on the serial monitor, with a “comma” character between them and a new line after the temperature value. We need this form of the lines so that we can easily import them and make a chart in Excel. Also note that the temperature values are converted into integers. So these identical values can also be written into the freshly created “test.txt” file and at the termination we only have to add a delay which will represent the interval of recording the temperature data. After uploading the code the Arduino will start storing the temperature values each 3 seconds. After a while we can open the SD card on our computer to see the results. For creating a chart in Excel we need to import this file and here’s how we will do that: From the data menu we need to click “Get Data from Text” button and select the text file. Here we will choose “Delimited” and click next, and in the second step, selects the comma as delimiter and then finishes the wizard. So this process will insert the time and the temperature values into separate columns. Now we just need to select both columns and from the insert menu select “Insert line chart”. This will create the chart where we can see the temperature values each 3 seconds
Fig. 5: Plotting of graph through the stored values IV. CONCLUSION
Data Loggers are changing more rapidly now than before. The original model of a stand-alone data logger is changing to one of a device that collects data but also has a wide access to wireless communications for forecasting of events, automatic reporting of data and remote control. Data loggers are widely used for web pages for instantaneous readings e-mail their alarms and FTP their routine results into databases or directed towards the users. Very recently, there is a trend to move away from proprietary products with commercial software to open source software and hardware devices.
Digital interfaces like I2C, SPI or UART enabling the direct interconnection of a digital sensor and a computer,
Unlimited number of configurations to show measurements in real-time over the internet, process data, plot charts and diagrams.
Based on the data obtained from excel sheet it can be employed to forecast current, voltage , solar intensity of solar panel for the next day as well as certain interval of time provided climatic conditions do not change abruptly and suddenly.
Based on the data of the excel sheet one can predict the best angle at which solar panel must be inclined to so as to increase the efficiency of the solar panel.[6] [7].
Based on the data of excel sheet one can predict at which time of day power should be drawn from solar panel and at which time of the day power must be drawn from main supply so as to avoid ambiguity in operation in case a firm draws power from both sources.
The data so obtained from excel sheet can also form the basis of building MPPT [10][11][12] or PWM[13] based solar power system.
REFERENCES
[1] Chetan Singh Solanki, Solar Photovoltaics, Fundamentals, Technologies and Applications, Second edition, Prentice HALL of India, pp.73-80, 2011. [2] Leon Freris, David Infield, Renewable Energy in Power Systems, First edition, John Wiley & Sons, pp.127-133, 2008.
[3] M. Calavia, J. M. Perie, J. F. Sanz, J Sallan, MPPT Strategies for Solar Modules, FYP Progress Report, pp.6-8, 2011. [4] John Twidell, Tony Weir, Renewable Energy Resources, Second edition, Taylor & Francis Group, pp.46-60, 2006.
[5] G. N. Tiwari, M. K. Ghoshal, Renewable Energy Resources: Basic Principles And Applications, First edition, Alpha Science International Ltd, pp.32-40, 2005
[6] Thomas P. Johansson, Henry Kelly, Amulya K. N. Reddy, Robert H. Williams, Renewable Energy – Sources for Fuel and Electricity, Revised Printing, Island Press, USA, pp.201-210, 1993.
[7] Stuart R. Wenham, Martin A. Green, Muriel E. Watt, Richard Corkish, Applied Photovoltaics, First edition, TJ International Ltd. UK, pp.102- 114, 2007. [8] Augustin McEvoy, Tom Markvart, Luis Castaner, Practical Handbook of Photovoltaics- Fundamentals and Applications, Second edition, Elsevier Ltd,
pp.60-69, 2012.
[9] ATmega8(L) Data Sheet, ATMEL®, pp.137-143 and pp.196-208, 2006
[10] N. Femia, G. Petrone, G. Spagnuolo, and M. Vitelli, “Optimization of perturb and observe maximum power point tracking method,” IEEE Trans. Power Electron., vol. 20, no. 4, pp. 963-973, Jul. 2005.
[11] W. Xiao and W. G. Dunford, “A modified adaptive hill climbing MPPT method for photovoltaic power systems,” in IEEE Power Electron. Specialists Conf., 2004, PESC '04. IEEE 35th, 2004, pp. 1957-1963.
[13] E. Roman, R. Alonso, P. Ibanez, S. Elorduizapatarietxe, and D. Goitia, “Intelligent PV Module for Grid-Connected PV Systems,” IEEE Trans. Ind. Electron., vol. 53, no. 4, pp. 1066-1073, Jun. 2006.
[14] Falk Antony, Christian Durschner, Karl-Heinsz Remmers Photovoltaics for Professionals, solar electric systems –Markeing, design and installations. Berlin: Solar praxis AG 2006.