Determination Of Image Quality Using Saliency
Map
Rani Arjun Vantmure, S.S.Saraf, S.M.Keshkamat
M.Tech (DCN), KLS Gogte Institute of Technology, Belgaum.
Associate Professor, Dept of ECE,KLS Gogte Institute of Technology, Belgaum. Assistant Professor, Dept of ECE,KLS Gogte Institute of Technology, Belgaum.
ABSTRACT: Perceptual image quality assessment uses various computation models to measure image quality by considering subjective evaluation. In recent years, according to the psychologists, neurobiologists study has shown that, which areas of image will attract most attention of human visual system. If distortion occurs in image, it will largely affect its visual saliency map. By considering this feature, in project work simple metric called visual saliency based index (VSI) is proposed to analyse image quality. Visual system is used to indicate local quality of the distorted image and to represent importance of local region in image. Several computational models are exist for computing VS maps. Comparison of various visual saliency models has done to analyse image quality.
Keywords: perceptual image quality, visual system, saliency map.
I. INTRODUCTION
During processing, digital images are affected by wide variety of distortions, which generally gives loss in visual quality. Hence now days, perceptual image quality assessment is most challenging problem in many image processing applications. Mainly there are two types of methods. Subjective assessment by humans and objective assessment by algorithms. In subjective computational model, people express their opinion about the quality of image. Several international standards are proposed to perform a subjective image quality testing, which give reliable results. But the problem with subjective analysis is it takes more time hence it is time consuming. It is not suitable for real time applications. One more method is objective assessment. The goal of objective IQA is to design mathematical models which are able to predict the quality of an image more accurately and automatically. In objective assessment method algorithms, human visual system is important..According to psychologists, neurobiologists, study has shown that most salient regions of image attracts the human visual system. Accordingly, visual system is related to image quality in subjective evaluation of image. When distortion occurs, it will largely effect the visual system. Using this fact, image quality can be determined. This image quality can be expressed in numerical value. Hence now days work is going on to develop objective assessment methods to analyze image quality. In objective assessment, human visual system plays important role. Using human visual system, we are computing saliency map. It detects most salient objects present in image. To find similarity between two images we are using gradient modulus, chrominance feature, visual saliency maps. Image quality distortions give changes in visual saliency maps. Using this property, VS map can be used as feature to characterize the image quality. However experiment study has shown that, VS map does not give correct result if distortion type is contrast change in image. VS map computation process involves normalization operations, VS value calculated at each pixel represents its relative distinctiveness from the surroundings. This reason makes VS to behave poorly in characterizing contrast loss in images. To compensate VS maps poor behavior, additional feature can be used. Simplest feature to characterize contrast change is using gradient modulus.
Gradient modulus map has good capability in reflecting contrast loss of images. To compute the gradient modulus map of image, scharr gradient operator is used. By observing experimental results, which are done on TID2013 database including 25 reference images, 24 distortion types and 5 distortion levels , it is concluded that, VS map which is used as quality distortion indication does not work well for distortion type CCS (change of color saturation). And also, color distortion cannot be well defined by gradient. Reason for this is, gradient is calculated from luminance channel of images. To analyze color information of image, chrominance information should be consider by converting it into opponent color space. With the extracted visual saliency ,gradient modulus and chrominance features, a similarity index called Visual saliency based index(VSI) can be calculated, which gives similarity between both original image and distorted image. Hence this is the combination of following three maps.
1. Gradient modulus map 2. Chrominance feature map 3. Visual saliency map
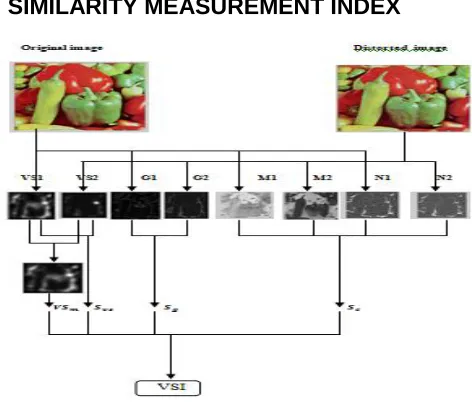
II. SIMILARITY MEASUREMENT INDEX
Copyright © 2015 IJTEEE. a) GRADIENT MODULUS MAP:
Saliency map does not work well for the loss in contrast of image. To compensate that, gradient modulus map is used. It is used for detecting edges of image. Image gradient can be defined as change in intensity or color of image in horizontal and vertical directions. Gradients are used to extract information from images. Gradient term can be used for gradual blend of color, that is from white to black .Mathematically gradient of image intensity function at each image point is two dimensional vector . Components of vector are given by derivatives in the vertical and horizontal directions. The gradient vector points in the direction of largest intensity change in that particular direction at each image point. Rate of change in direction gives the length of the gradient vector. The method of using gradient is convolution with kernel such as prewitt operator or sobel operator.
b) SCHARR GRADIENT OPERATOR
It has proven that scharr gradient operator works well in detecting the effectively, Hence in this method we are using scharr gradient operator to determine the edges . consider f(x) as original image. Then partial derivatives Gx (x) and
Gy (x) of image can be defined as
𝐺𝑥 𝑥 = 1
16
3 0 −3 10 0 −10
3 0 −3
∗ 𝑓 𝑥 (1)
𝐺𝑦 𝑥 = 1 16
3 10 3
0 0 0
−3 −10 −3
∗ 𝑓(𝑥) (2)
Gradient modulus of f(x) can be written as,
𝐺 𝑥 = 𝐺𝑥2 𝑥 + 𝐺𝑦2(𝑦) (3)
Gradient modulus map can be used to represent contrast loss of images and this map gives local quality of image which effects human visual system. Gradient map does not work well for change of color saturation. Gradient is computed from luminance channel of images hence color of image is not well characterized by gradient map. To identify color distortions,chrominance information should be considered. For RGB color images, information from images can be extracted from trnsforming them into opponent color space.to anlyse image quality it is reprented in opponent color space.perception of color is usually not represented in RGB format.better model of human visual system to represent is this opponent color model. This model consists of mainly three components, luminance channel, red green channel, blue yellow channel.mathmatically this conversion is done using following formula. 𝐿 𝑀 𝑁 =
0.06 0.63 0.27 0.30 0.04 −0.35 0.34 −0.6 0.17
𝑅 𝐺 𝐵
(4)
Gradient information is extracted from L channel and to characterize quality degradation caused by color distortion M and N channels are used.with the extracted visual saliency map,gradient modulus map and chrominance feature map we can define visual saliency based index to find the silmilarity between two images namely f1(x) and f2(x). Similarity between original image and distorted image can be find in two steps. In first step local similarity map is computed and in second step we are converting similarity map into single quality score to represent image quality in numerical value.similarity measurement between f1(x) and
f2(x) is separarted into three components, one for saliency,one for gardient and other for chrominance. c) ITTIS MODEL
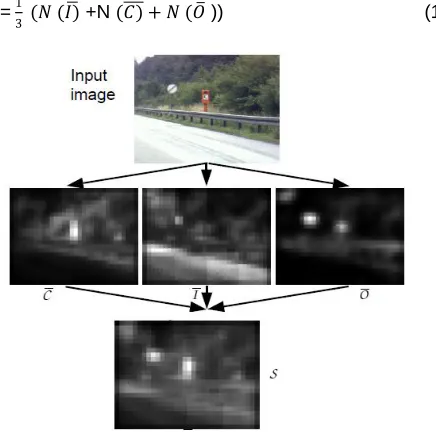
Image consists of multiscale features. By combining all these features, single topological map can be designed, it represents overall saliency of the image. Itti proposed saliency model, which is based on biological architecture. Input image is divided into many topographic feature maps depending on size and extent of image. Spatial locations having saliency, which stands out from other locations is determined .This means these regions are extremely different from its neighborhood region. In ittis model, input image is given in the form of static color image, which is digitized at 640 × 480 resolution. To subsample the input, image dynamic Gaussian pyramid is used, using this 9 spatial scales are created. Each feature is computed by center surround operations. Visual neurons of human visual system is most sensitive in small regions in visual scene. In the model center surround is implemented by taking difference between a fine (center) and a coarse scale (surround) for a given feature. Center region is a pixel at scale C ∈ 2,3,4 . Surrounding region is a pixel with the scale s = c + 𝛿 with 𝛿 3,4 . Visual features can be extracted by red, green and blue components. Intensity image I can be obtained using these three components as I=(r + g + b) /3. This intensity image I is used to create Gaussian period I( 𝜎) where σ ∈ 0.8 is the scale. r, g, b channels are normalized to decouple hue from intensity. Normalization process is only applied at the locations, where intensity of image I is greater than 1/10 of its maximum intensity over entire image. Four color channels R= r- (g + b) / 2 for red, G= g-(r + b) /2 for green, B=b-(r + g) /2 for blue and Y= (r + g) /2- (r –g) /2- b for yellow are created. Four Gaussian pyramids R(𝜎),G(𝜎),B(𝜎),Y(𝜎) are created using these color channels. Center surround differences between center fine scale c and surround scale gives feature maps. First set of feature maps deals with intensity contrast. In human visual system, it is detected by neurons sensitive to either dark centers on bright surrounds or bright centers on dark surrounds. Hence both types of sensitive’s are computed in set of 6 maps I(c , s) with c = {2,3,4} and s = c + d ,d={3,4}.
I(C,S)=|I(C)ɵI(s)| (5)
Second set of feature maps deals with color channels, in human primary visual cortex opponency exists between red / green, green/ red ,yellow/ blue, blue/yellow color pairs. Colors in cortex is represented by double opponency system. Accordingly maps are created for these double opponency in the model. Neurons are exited by one color like red and inhibited by another color like green. Accordingly maps RG (c, s) are created for red / green, green / red and blue / yellow, yellow / blue double opponency.
RG (c,s) =|(R (c) – G ( c)) ɵ (G(s) – R ( s)) | (6) BY (c,s) = | ( B (c) – Y( c)) ɵ (Y (s) –B (s)) | (7)
Third set of feature maps deals with orientation. Orientation information can be obtained using gabor pyramid O (𝜎,𝜃) where 𝜎 = {0..8} represents the scale and
𝜃 𝜖 0°, 45°, 90°, 135° is the preffered orientation. Orientation feature map O(c,s,ɵ) represents orientation contrast between center and surround scales.
In ittis model there are total 42 feature maps including 6 for intensity,12 for color and 24 for orientation features maps. These feature maps can be combined into three consipuity maps Ī for intensity, 𝐶 for color, 𝑂 for orienatation at the scale 𝜎 = 4 of the saliency map.
𝐼 = ⊕𝑐=2 4 ⊕ 𝑠=𝑐+3
𝑐+4 N (I (c, s) (3.16)
𝐶 = ⊕𝑐=24 ⊕ 𝑠=𝑐+3
𝑐+4 𝑁 𝑅𝐺 𝑐, 𝑠 𝑁 (𝐵𝑌 𝑐, 𝑠 )] (9)
(3.17) For computation of orientation feature , all orienataion maps
are combined into single orientation consipuity map.
𝑂 = 𝑁(⊕𝑐=24
𝜃𝜖 0°,45°,90°,135° ⊕𝑠=𝑐+3 𝑐+4N 𝑁 (𝑂 𝑐, 𝑠, 𝜃 )) (10)
Finally,all three feature maps are combined into single saliency map.
S =1
3 (𝑁 (𝐼) +N (𝐶) + 𝑁 (𝑂 )) (11)
Fig 2: Operation of Ittis model with natural image (3.19)
Figure shows steps involved in computing salient objects present in given image.
d) CALCULATION OF VISUAL SALIENCY INDEX (VSI)
Consider that VS1 is the saliency map for original image and VS2 is sliency map for distorted image ,then similarity between both saliency maps can be find out using following formula.
𝑆𝑉𝑆 𝑋 =2 𝑉𝑆1 𝑋 .𝑉𝑆2 𝑋 +𝐶1
𝑉𝑆12 𝑋 +𝑉𝑆22 𝑋 +𝐶1 (12)
Where C1 can be taken positive constant to increase stability of resulting stability. Consider GM1 and GM2 are two gradient modulus maps of original image f1(x) and distorted image f2(x) then,similarity between both images can be written as,
𝑆𝐺=2𝐺1 𝑋 .𝐺2 𝑋 +𝐶2
𝐺12 𝑋 +𝐺22 𝑋 +𝐶2 (13)
Where C2 is positive constant. Similarly between chrominance features can be defined as 𝑆𝐶 𝑋 == 2𝑀1 𝑋 .𝑀 2 (𝑋)+𝐶3
𝑀12(𝑋)+𝑀22(𝑋)+𝐶3 .
2𝑁1(𝑋) .𝑁2(𝑋)+𝐶3
𝑁12 𝑋 +𝑁22(𝑋)+𝐶3 (14)
Finally, 𝑆𝑉𝑆 𝑋 , 𝑆𝐺 𝑋 , 𝑆𝐶 𝑋 are combined to get the local
similarity S(x) of f1(x) and f2(x). We define S(x) as ,
S(x) = 𝑆𝑉𝑆 𝑋 𝑆𝐺 𝑋 𝛼. 𝑆
𝐶 𝑋 𝛽
Where α and β are parameters used to represent importance of chrominance feature. After obtaining local similarity at each point of image,overall similarity of both images can be defined as,
𝐕𝐒𝐈 = 𝐒Ω 𝐕𝐒 𝐗 𝐒𝐆 𝐗 𝛂. 𝐒𝐂 𝐗 𝛃.𝐕𝐒𝐌(𝐗)
𝐕𝐒Ω 𝐌(𝐗) (15)
We know that different regions of image have different human visual system perception of image quality. if anyone of f1(x) and f2(x) has a high VS value, it implies that this position x will have a high impact on HVS when it evaluates the similarity between f1(x)and f2(x).
e) RESULTS
In project four algorithms are used to find amount of distortion present in original image. similarity is calculated between both original image and distorted image.
Fig 3 Original image
Fig 4 Distorted image
Fig3 is original image and fig 4 is distorted version of original image. Ittis algorithm compares both the images
and gives similarity of 0.886523.
Copyright © 2015 IJTEEE. Fig 5 gives luminance, red green and blue yellow color
information of the original image. L1 gives luminance information. M1 and N1 gives red green and blue yellow information respectively.
Fig 6 Gradient maps of original image
Fig 6 gives edges of original image in x and y directions.
Fig 7 Gradient modulus map of original image
Fig 7 gives edges of the image resulting from both x and y directions.
Fig 8 Chrominance feature map of distorted image
Fig 8 gives information about chrominance features of the image. L2 gives information about luminance component.
M2 and N2 gives red green and yellow blue information.
Fig 9 Gradient maps of distorted image in x and y direction
Fig 9 gives edges of original image in x and y directions.
Fig 10 Gradient modulus map of distorted image
Fig 10 gives edges of the image resulting from both x and y directions.
Fig 11 Combine gradient modulus map of both original and distorted image
Fig 11 gives information about similarity of edges present in both original and distorted images.
Fig 12 Combined chrominance feature map of both original and distorted image.
Fig 12 gives information about combined red green and blue yellow component information about original and
distorted image.
Fig 13 Saliency maps of original image and distorted image
Fig 13 represents salient objects present in both original and distorted image.
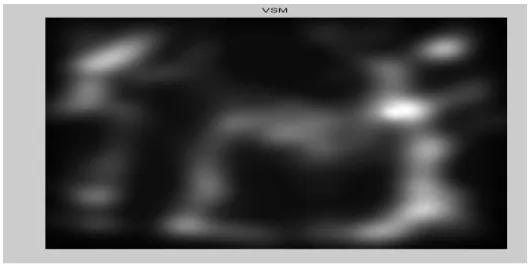
Fig 14 Combined saliency map original and distorted image
.
Fig 15 Similarity measurement of original and distorted image
Fig 15 gives overall similarity between both the original and distorted image. We can express this similarity in terma of
numerical value.
REFERENCES
[1] Z. Wang and A. C. Bovik, Modern Image Quality Assessment. San Rafael, CA, USA: Morgan & Claypool, 2006
[2] W. Lin and C.-C. J. Kuo, ―Perceptual visual quality metrics: A survey.‖J. Vis. Commun. Image Represent., vol. 22, no. 4, pp. 297–312,May 2011.
[3] L. Zhang, L. Zhang, X. Mou, and D. Zhang, ―A comprehensive evaluation of full reference image quality assessment algorithms,‖ in Proc. 19th IEEE Int. Conf. Image Process., Sep./Oct. 2012, pp. 1477–1480.
[4] L. Itti, C. Koch, and E. Niebur, ―A model of saliency-based visualattention for rapid scene analysis,‖ IEEE Trans. Pattern Anal. Mach. Intell., vol. 20, no. 11, pp. 1254–1259, Nov. 1998.
[5] N. Ponomarenko et al., ―Color image database TID2013: Peculiaritiesand preliminary results,‖ in Proc. 4th Eur. Workshop Vis. Inf. Process.,Jun. 2013, pp. 106–111.
[6] N. Ponomarenko, V. Lukin, A. Zelensky, K. Egiazarian, M. Carli, and F. Battisti, ―TID2008—A database for evaluation of full-referencevisual quality assessment metrics,‖ Adv. Modern Radioelectron., vol. 10,pp. 30–45, 2009