International Journal of Pharmaceutical Sciences and Drug Research 2011; 3(1): 13-18
13
Research Article
ISSN 0975-248X
Optimization and Validation of Modulated Release Formulation of
Ranitidine HCl by Response Surface Methodology
Bijay Kumar Sahoo
1*, Amiya Kumar Mishra
1, Tapan Kumar Pal
21Department of Pharmaceutics, College of Pharmaceutical Sciences, Puri-752 002, Orissa, India
2Department of Pharmaceutical Technology, Jadavpur University, Kolkata- 700 032, India
ABSTRACT
The objective of the present study was, 1) to systematically device a model of factors that would yield an optimized sustained release dosage form of model drug (Ranitidine HCl), 2) to validate the models using R2 values, 3) to optimize the
formulation by response surface methodology (RSM). A three - factor, three - level Box-Behnken design was used for the optimization procedure, with the amounts of HPMC K100M (X1), MCC (X2) and Compression Force (X3) as independent
variables. Three dependent variables were considered: percentage of drug release at 1 h, 12 h and T50%. The regression
equation obtained from experiment i. e Y2= 92.41 + 3.18X1+ 2.05 X2 + 2.14X3+ 2.41X1X2+ 0.24 X1X3 + 0.11 X2X3
-3.82X12 - 2.59X22 -0.46X32 , explained the main and interaction effects of factors that influenced the drug release.
Optimization was performed by maximizing the drug release in 12 hrs and placing constraints on Y1, Y2and Y3. Validation
of optimization by carrying out by performing 8 experimental runs showed high degree of prognostic ability of response surface methodology. The results showed that the optimized formulation provided a dissolution pattern similar to the predicted curve, which indicated that the optimal formulation could be obtained using RSM. A simple high performance liquid chromatography method was developed and the dissolution samples were analysed by this procedure.
Keywords: Optimization, sustained release, Ranitidine HCl, Response surface methodology (RSM), Validation.
INTRODUCTION
In the past few years, modulated release systems have become increasingly important, because these systems can maintain the pharmacologic effect for an appropriate extended time. Hydrophilic gel forming matrix tablets are extensively used for an oral extended release dosage forms due to their simplicity, cost effectiveness and reduction of risk of toxicity due to dose dumping. [1-4] In the development
of an extended release dosage form an important issue was to design an optimized formulation with minimum number of trials in short time. For this a computer optimization technique, based on response surface methodology (RSM) utilizing a polynomial equation has been widely used. Many statistical experimental designs have been recognized as useful techniques to optimize process variables. RSM is widely used when only a few significant factors are involved in optimization. Various types of RSM designs include 32 full
factorial designs, central composite design [5-6] and
Box-Behnken design.[7]Box - Behnken design is an independent,
rotatable or nearly rotatable quadratic design (contains no
*Corresponding author: Mr. Bijay Kumar Sahoo,
Department of Pharmaceutics, College of Pharmaceutical Sciences, Puri-752 002, Orissa, India;
E-mail: [email protected]
embedded factorial or fractional factorial design in which the treatment combinations are at the midpoints of the edges of the process space and at the center. A three factor, three level designs would require a total of 27 runs without any repetitions and 30 runs with 3 repetitions. Box-Behnken design requires fewer runs (15 runs) in a three factor experimental design. Hence this design was used to optimize Ranitidine hydrochloride extended release tablets.
Ranitidine hydrochloride (RHCl) is a hydrophilic H2-receptor
antagonist. It is widely prescribed in active duodenal ulcers, gastric ulcers, Zollinger-Ellison syndrome, gastro-esophageal reflux disease, and erosive- esophagitis. The maintenance of uniform plasma levels of a cardiovascular drug is important in ensuring the desired therapeutic response. The half life of R HCl is 2.5 - 3 hours and multiple doses are required to maintain uniform plasma levels to elicit a good therapeutic response.[8]
The current study aimed at developing and optimizing an oral sustained release dosage form of RHCl using computer aided optimization technique i.e. Box-Behnken statistical design with constraints on cumulative percentage of drug release after 1 h (Y1, NMT 30%) and 12 h (Y2, NLT 85%).
The independent variables chosen for the present study were: amount of release retardant polymers – HPMC K100M (X1),
studied were cumulative percentage of drug release after 1 h (Y1) and 12 h (Y2); time required for 50% dissolution –T50%
(Y3).
MATERIALS AND METHODS
Ranitidine HCl was obtained as a gift sample from Albert-David Limited (Kolkata, India). Other materials used were Potassium dihydrogen phosphate, Acetonitrile (Merck Ltd, Mumbai), HPMC K100M, MCC (Stadmed private limited, Kolkata, India). Talc, magnesium stearate and dicalcium phosphate, (Loba chemicals, Mumbai). All other chemicals used were of analytical grade throughout the analysis.
Preparation of matrix tablets
The drug and polymer were sifted through #22 meshes and mixed well to ensure the uniformity of the premix blend. The premix blends was then mixed with MCC and were lubricated with talc and magnesium stearate. The tablets were prepared by directly compressing the mass at an average weight of 600 mg on a 10 station Lab Press compression machine (Cip machineries Pvt. Ltd., Ahmedabad) using 11.9 mm circular, concave punches. Various formulations of Ranitidine HCl sustained release matrix tablets were prepared using the following excipients. HPMCK-100 M, MCC, dicalcium phosphate, talc, and magnesium stearate.
Experimental design
A three factor, three levels Box-Behnken design was used for the optimization procedure. The design consists of a replicated center points and a set of points lying at the midpoint of each edge of the multidimensional cube that defines the region of interest. The non linear computer generated quadratic model is given as:
Y = b0+ b1X1+ b2X2+ b3X3+ b12X1X2+ b13X1X3+ b23X2X3
+ b11X12+ b22X22+ b33X32+ E - (1)
Where y is the measured response associated with each factor level combination; b0is an intercept; b1to b33are regression
coefficients computed from the observed experimental values of Y; and X1, X2and X3are the coded levels of independent
variables and E is the error term. The independent and dependent variables used in the design are listed in Table 1. A total of 15 runs with triplicate center points are given in Table 2 along with the observed responses and other release parameters.
Table 1: Variables in Box-Behnken design
Factor Low Levels used (coded)medium High
X1= HPMC K4M (%) 20 30 40
X2= PVPK-90 (%) 5 10 15
X3= Compression (Tons) 1 3 5
Response Constraints
Y1= Cumulative % drug released in 1 h 20 – 30% Y2= Cumulative % drug released in 12 h > 85%
Y3= Time for 50 % dissolution (T50%) > 4 hrs
Tablet physical evaluation
Tablets were also evaluated for their hardness (n=6) (Monsanto hardness tester), friability (n=6) (Roche friabilator, 100 rpm), weight variation (n = 20) and thickness (n = 10) (Mitutoyo digital vernier caliper).
Determination of release profiles
An automated tablet dissolution tester (USP XXIII), with a basket speed of 100 rpm and 900 ml of simulated gastric fluid without enzymes as the dissolution medium at 37ºC was employed. Samples were withdrawn at different time points (1, 2, 4, 8, and 12 h), suitably diluted and assayed by High performance liquid chromatography (HPLC) using UV
detector at 320 nm. Samples were filtered using 0.45 µm Millipore filter. The dissolution experiments were carried out in triplicate. The cumulative percent drug release was calculated for the formulations and the drug release data was curve fitted to various kinetic models to study the mechanism of drug release from the matrices.
HPLC analysis
The HPLC apparatus (Knauer, Germany) adjusted with HPLC pump (Knauer 1000), Rheodyne injector (D-14163 Berlin), UV detector (Knauer 2500) and EZChrom (version 3.1.6) software. Reverse phase-HPLC analysis was performed isocratically at room temperature using a cyano, 250 × 4.6mm, 5µ particle size stainless steel column. A mixture of dihydrogen phosphate buffer and acetonitrile in the ratio of 50:50 (v/v) was used as mobile phase. The mobile phase was filtered through 0.45 µm membrane filter. The eluent was monitored with a UV detector set at 320 nm at a flow rate of 1.0 ml min-1 and a sample size of 50 µl was
injected through the Rheodyne injector.
Statistical analysis and Optimization
The application of mathematical optimization in the pharmaceutical field was first reported by Fonner et al. Later developments in the computer science have enabled the incorporation of the optimization algorithm into the experimental design software. For this research article, Design- Expert Trial version 7.1.1 software (Stat - Ease Inc. Minneapolis) was used for optimization.
Validation of optimization model
Statistical validity of the polynomials was established on the basis of ANOVA provision in the Design Expert Software. Subsequently, the feasibility and grid searches were performed to locate the composition of optimum formulations. The 3-D response surface plots were drawn using this software. Eight optimum check points were selected by intensive grid search performed over the entire experimental domain to validate the chosen experimental design and polynomial equations. The formulations corresponding to these check points were prepared and evaluated for various response properties. The resultant experimental data of response properties were compared with that of the predicted values. Linear regression plots between the observed and predicted values of the response properties were drawn.
RESULTS AND DISCUSSION Drug content and physical evaluation
Evaluation of the matrix tablets yielded a drug content ranging from 98.22 to104.13% of the desired amount, which justifies an even quantity of drug in all formulations. The homogeneity of the drug in the physical mixtures allows the preparation of tablets with uniform weight. The weight of the tablets ranged between 588.40 mg to 615.80 mg. The hardness of the different formulations studied was in the range of 5 - 7 Kg/cm2. The thickness of the tablets was found
in the range of 4.78 mm to 5.36 mm. The tablets also passed the friability test (F < 1%), showing that all the formulations lie within the limits.
Data fitting to the model and ANOVA
rates. The range of responses Y1, the cumulative % drug
released after 1 h was 45.83% in formulation No. 13 (maximum) and 23.51 % in formulation No 6. Similarly, the response Y2 was maximum in formulation No. 13 and
minimum in formulation No. 15.
Mathematical relationship in the form of polynomial equations for the measured responses obtained with the statistical package Design Expert version 7.1.1 are listed in Table 3. These equations represent the quantitative effect of variables (X1, X2, X3) and their interactions on the response
Y2. Coefficients with more than one factor term and those
with higher order terms represent interaction terms and quadratic relationships respectively. A positive sign represents a synergistic effect, while a negative sign indicates an antagonistic effect. The values of X1– X3were substituted
in the equation to obtain the theoretical values of Y2. The
predicted and the experimental values were in reasonably good agreement.
ANOVA was performed to estimate the significance of the model. At 5% level of significance, a model is considered significant if the p-value is less than 0.05. The ANOVA analysis for all the three responses is shown in Table 3. ANOVA analysis of Y1showed that coefficients b1 and b3
had significant effect with F value of 12.07 (p = 0.0052) and 19.01 (p = 0.0011) respectively. For Y2 and Y3, the main
coefficients b1, b2, b3and interaction coefficients b12, b22had
significant effect with p value less than 0.05. It was observed that increase in the polymer concentration of HPMC K100M increased the T50%due to more retarded release of the drug.
Table 2: Observed responses in Box – Behnken design and release parameters
R u n
Independent
factors Response Release parameters X1 X2 X3 Y1 Y2 Y3 n KH R2
1 0 -1 1 24.56 88.56 3.9 0.4893 21.34 0.9803 2 1 0 -1 34.61 88.64 3.9 0.4821 22.34 0.9831 3 0 0 0 25.86 92.11 5.1 0.4984 25.92 0.9861 4 -1 0 1 27.44 87.15 3.6 0.4633 23.82 0.9752 5 1 1 0 32.56 93.15 4.8 0.4264 24.38 0.9889 6 1 0 1 23.51 95.61 5.0 0.5341 27.03 0.9658 7 0 1 -1 35.16 89.96 4.1 0.5394 22.63 0.9821 8 0 1 1 28.64 94.95 5.2 0.4916 25.84 0.9873 9 -1 -1 0 39.46 94.57 3.4 0.5333 19.37 0.9511 10 -1 1 0 40.56 100.89 3.0 0.4892 21.11 0.9362 11 0 0 0 29.98 90.57 4.3 0.4834 25.71 0.9889 12 1 -1 0 27.71 86.61 3.5 0.5551 23.29 0.9732 13 -1 0 -1 45.83 101.14 3.2 0.4806 17.41 0.9884 14 0 0 0 29.45 94.56 5.2 0.4865 24.04 0.9888 15 0 -1 -1 33.55 87.89 3.1 0.5041 25.13 0.9638
Table 3: ANOVA summary of all responses (Y1, Y2, Y3)
Source F Y1(Linear) Y2(Quadratic) Y3(Quadratic) value p -value valueF p -value valueF p -value
Model 10.85 0.0013 11.23 0.0080 10.09 0.0102
X1 12.07 0.0052 32.96 0.0032 23.56 0.0047
X2 1.48 0.248 13.72 0.0139 9.77 0.0261
X3 19.01 0.0011 14.97 0.0118 10.52 0.0228
X1.X2 - - 9.44 0.0277 6.31 0.0537
X1.X3 - - 0.094 0.7717 1.01 0.3612
X2.X3 - - 0.019 0.8962 0.32 0.5938
X12 - - 21.93 0.0054 23.60 0.0046
X22 - - 10.06 0.0248 15.92 0.0104
X32 - - 0.32 0.5948 4.93 0.0771
Regression equations of the fitted model Y1= 32.184 – 4.237.X1+ 1.322.X2– 5.632.X3
Y2= 92.41 + 3.18.X1+ 2.05.X2+ 2.14. X3+ 2.41.X1X2+ 0.24.X1X3+ 0.11.X2X3– 3.82.X12– 2.59X22– 0.46X32
Y3= 5.00 + 0.51.X1+ 0.33.X2+ 0.34.X3+ 0.38.X1X2+ 0.15.X2X3+ 0.0085.X1X3- 0.75.X12– 0.62.X22– 0.34.X32
Standardized main effects and reliability of the models
Table 4 shows the standardized main effects (SME) obtained by dividing the main effects with the standard error of the main effects. [9-11] Factor X
1showed a larger SME value of
5.78 indicating the significant effect of HPMC K100M on drug release. Factors X2and X3showed almost same effect
on % release at 12 h and T50%as observed from their SME
values. The reliability of the model was further supported by high R2values. Also the p – values of lack of fit (0.3249,
0.8012, 0.9860) above 0.05 also justifies the reliability of the model because for a particular model, p value for lack of fit should be non significant.
Table 4: Standardized main effects of the factors on the responses
Factor Y1(Linear Standardized main effects (SME)
model) Y2(Quadratic model) Y3(Quadratic model)
X1 - 3.18 5.78 4.63
X2 0.99 3.72 3.0
X3 - 4.23 3.89 3.09
X1.X2 - 3.08 2.53
X1.X3 - 0.30 1.0
X2.X3 - 0.14 0.56
X12 - - 4.65 4.68
X22 - - 3.15 - 3.87
X32 - -0.56 - 2.125
R2 93.14% 95.29% 94.78%
p – Value of lack of fit 0.3249 0.8012 0.9860
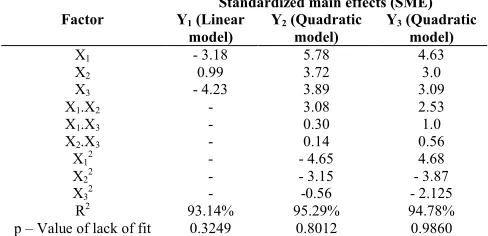
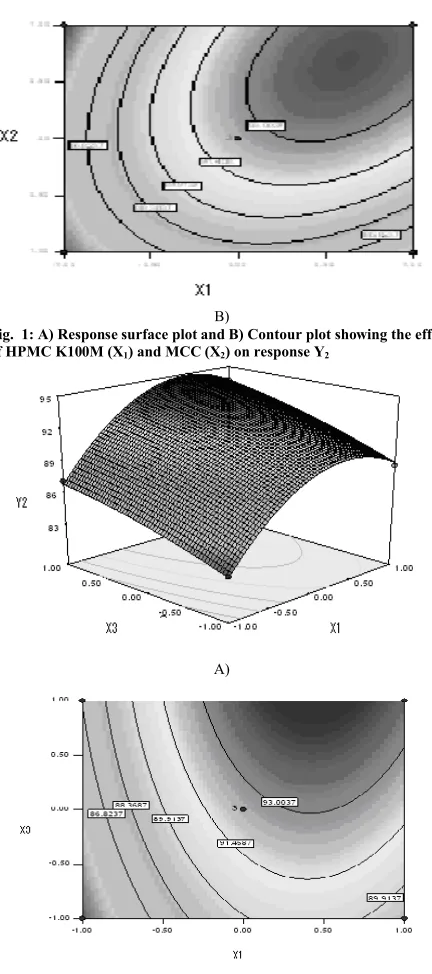
Response surface analysis
Contour plots (Fig. 1B, 2B, 3B) are two dimensional representations of the responses for the selected factors. Three dimensional (3-D) surface plots (Fig. 1A, 2A, 3A) for the obtained responses were drawn based on the model polynomial functions to assess the change of the response surface. These plots explain the relationship between the dependent and independent variables. Response surface plots for the responses Y2 are given in Fig. 1-3 along with their
corresponding contour plots (Fig. 1B, 2B, 3B).
Fig. 1A shows the 3-D plot of the effect of factors X1and X2
on the response Y2. At the lowest level of X1and X2, Y1was
34.51 and Y2was 82.68. The decrease in % drug release was
polymer concentration dependent. The % release at 12 hrs (Y2) obtained was 93.91 when X1was 0.28 and X2was 0.48.
Fig. 2 explains the effect of factors X1, X3on the response
Y2. At a level of 0.70:-1.00 for X1, X3, the % release at 12
hrs was 90.17. Fig. 3 explains the effect of factors X2, X3on
the response Y2. At the lowest levels of both X2and X3, the
% release at 12 hrs was 85.31%. The % release (Y2) was
90.09% when CF was 0.62 and X2was kept minimum.
B)
Fig. 1: A) Response surface plot and B) Contour plot showing the effect of HPMC K100M (X1) and MCC (X2) on response Y2
A)
B)
Fig. 2: A) Response surface plot and B) Contour plot showing the effect of HPMC K100M (X1) and Compression Force (X3) on response Y2.
A)
B)
Fig. 3: A) Response surface plot and B) Contour plot showing the effect of MCC (X2) and Compression Force (X3) on response Y2.
Optimization
After generating the model polynomial equations to relate the dependent and independent variables, the process was optimized for all three responses. Optimum formulation was selected based on the constraints set on independent variables: Y1(20 – 30%), Y2(85 – 100%), Y3(> 4hrs). The
final optimal experimental parameters were calculated using the extensive grid search and feasibility search provided in the Design Expert software. From the various solutions provided by the software, the formulation containing 189 mg of HPMC K100M, 50.4 mg of MCC and 4.06 tons of Compression force was found to fulfill the maximum requisite of an optimum formulation because of the better regulation between the initial release after 1 h and release at the end of 12 h. The release profile of the optimized formulation is shown in Fig. 4.
0 10 20 30 40 50 60 70 80 90 100
0 2 4 6 8 10 12
Time in hours
C
u
m
u
la
ti
v
e
%
r
e
le
a
s
e
Fig. 4: Dissolution profile of the optimized formulation
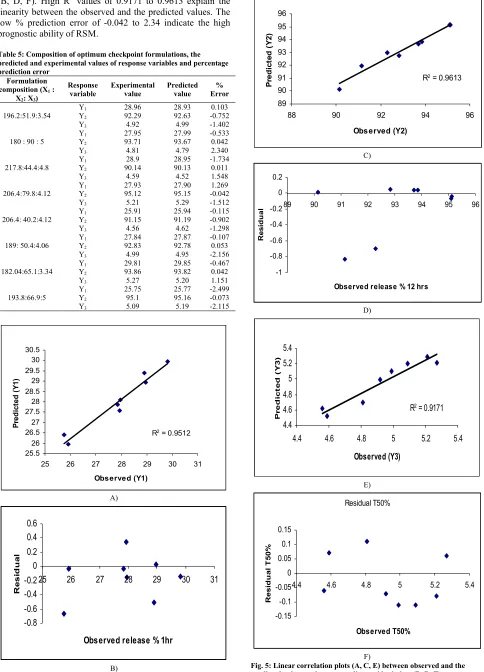
Validation of the RSM results
(B, D, F). High R2 values of 0.9171 to 0.9613 explain the
linearity between the observed and the predicted values. The low % prediction error of -0.042 to 2.34 indicate the high prognostic ability of RSM.
Table 5: Composition of optimum checkpoint formulations, the predicted and experimental values of response variables and percentage prediction error
Formulation composition (X1:
X2: X3)
Response
variable Experimentalvalue Predictedvalue Error%
196.2:51.9:3.54 YY12 28.9692.29 28.9392.63 -0.7520.103
Y3 4.92 4.99 -1.402
180 : 90 : 5 YY12 27.9593.71 27.9993.67 -0.5330.042
Y3 4.81 4.79 2.340
217.8:44.4:4.8 YY12 90.1428.9 28.9590.13 -1.7340.011
Y3 4.59 4.52 1.548
206.4:79.8:4.12 YY12 27.9395.12 27.9095.15 -0.0421.269
Y3 5.21 5.29 -1.512
206.4: 40.2:4.12 YY12 25.9191.15 25.9491.19 -0.115-0.902
Y3 4.56 4.62 -1.298
189: 50.4:4.06 YY12 27.8492.83 27.8792.78 -0.1070.053
Y3 4.99 4.95 -2.156
182.04:65.1:3.34 YY12 29.8193.86 29.8593.82 -0.4670.042
Y3 5.27 5.20 1.151
193.8:66.9:5 YY12 25.7595.1 25.7795.16 -2.499-0.073
Y3 5.09 5.19 -2.115
R2 = 0.9512
25.5 26 26.5 27 27.5 28 28.5 29 29.5 30 30.5
25 26 27 28 29 30 31
Observed (Y1) P re d ic te d ( Y 1) A) -0.8 -0.6 -0.4 -0.2 0 0.2 0.4 0.6
25 26 27 28 29 30 31
Observed release % 1hr
R e s id u a l B)
R2 = 0.9613
89 90 91 92 93 94 95 96
88 90 92 94 96
Observed (Y2) P re d ic te d ( Y 2 ) C) -1 -0.8 -0.6 -0.4 -0.2 0 0.2
89 90 91 92 93 94 95 96
Observed release % 12 hrs
R e s id u a l D)
R2 = 0.9171
4.4 4.6 4.8 5 5.2 5.4
4.4 4.6 4.8 5 5.2 5.4
Observed (Y3) P re d ic te d ( Y 3 ) E) Residual T50% -0.15 -0.1 -0.05 0 0.05 0.1 0.15
4.4 4.6 4.8 5 5.2 5.4
Observed T50% R e s id u a l T 5 0 % F)
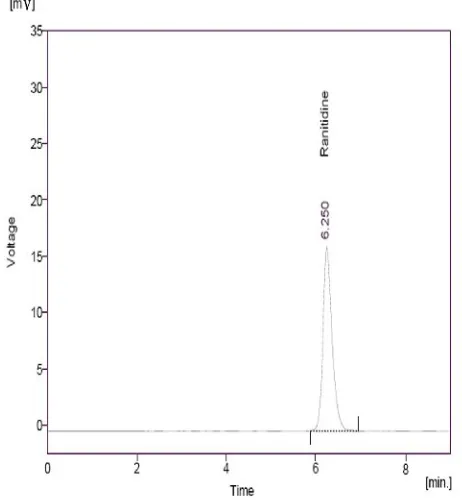
HPLC analysis
The representative HPLC chromatogram obtained after the analysis of the dissolution sample is shown in Figure 6. Under the described chromatographic conditions, RHCl was eluted at a run time of 6.25 minutes. The response obtained in the HPLC system was good and was possible to analyze all the dissolution samples collected at various time points. The HPLC method described is very simple, sensitive and reproducible.
Fig. 6: Representative HPLC chromatogram showing Ranitidine hydrochloride obtained after analysis of dissolution samples
It was concluded that an appropriate statistical design and optimization technique can be successfully used in the development of sustained release tablets of RHCl with predictable drug release properties. Response surface methodology optimization enabled formulation of HPMC matrix tablets with desired RHCl release rate. Validation of the optimization technique demonstrated the reliability of the model. The experimental values of the response variables obtained from the optimized formulations were close and in linear with the predicted values.
ACKNOWLEDGEMENTS
The first author is thankful to Prof (Dr.) T. K Pal of Department of Pharma Technology, Jadavpur University, Kolkata, India for providing a proper platform for carrying out this work.
REFERENCES
1. Gao P, Meury RH. Swelling of hydroxylpropyl methylcellulose matrix tablets. Characterization of swelling using a novel optical imaging method. J Pharm Sc. 1996; 85(4): 725-731.
2. Goehl MC, Amin A. Formulation optimization of controlled release diclofenac sodium microspheres using factorial design. J. Control. Release 1998; 51 (2): 115-122.
3. Hamed E, Sakra A. Application of multiple response optimization technique to extended release formulation design. J Control. Release 2001; 73 (3):329-338.
4. Sanchez – Lafuente C, Furlanetto S, Fernandez-Arevalo M. Didanosine extended release matrix tablets: optimization of
formulation variables using statistical experimental design. Int. J. Pharm. 2002; 237 (5):107-118.
5. Boza A, De la Cruz Y, Jordan G, Jauregui – Haza U, Aleman A, Caraballo. Statistical optimization of a sustained release matrix tablet of lobenzarit disodium. Drug Dev. Ind. Pharm 2000; 26 (2):1303 -1307.
6. Box GEP, Wilson KB. On the experimental attainment of optimum multifactorial conditions. J. Roy. Statist. Soc. Ser. B. Metho. 1951; 13(4):1- 45.
7. Box GEP, Behnken DW. Some new three level designs for the study of quantitative variables. Technometrics 1960; 2: 455 - 475. 8. Sahoo BK, Gowda V, Ghosh A, Bose A, Pal TK. Statistical
Evaluation of HPMC Influence on drug release pattern of a F DDS. Pharmind 2009; 71(8):1423-1428.
9. Ragonese R, Macka M, Hughes J, Petocz P. The use of Box – Behnken experimental design in the optimization and robustness testing of a capillary electrophoresis method for the analysis of ethambutol hydrochloride in a pharmaceutical formulation. J. Pharm. Biomed. Anal. 2002; 27(6): 995-1007.
10. Nutan MTH, Soliman MS, Taha EI, Khan MA. Optimizations and characterization of controlled release multiparticulate beads coated with starch acetate. Int. J. Pharm 2005; 294:89-101. 11. Singh SK, Dodge J, Durrani MJ, Khan MA. Optimization and