Available online on 15.02.2019 at http://jddtonline.info
Journal of Drug Delivery and Therapeutics
Open Access to Pharmaceutical and Medical Research© 2011-18, publisher and licensee JDDT, This is an Open Access article which permits unrestricted non-commercial use, provided the original work is properly cited
Open
Access
Research Article
Development and validation of stability indicating UPLC method for the
estimation of ticagrelor in bulk and its tablet dosage form
Omaima J1*, Shyamala1, J V C Sharma2
1. Department of Pharmaceutical Analysis and Quality Assurance, Joginpally B R Pharmacy College, Hyderabad, T.S., India 2. Principal, Joginpally B R Pharmacy College, Hyderabad, T.S., India
ABSTRACT
The objective of the method was to develop a simple, rapid, sensitive, precise, accurate and validated Ultra Performance Liquid Chromatographic (UPLC) method for the estimation of Ticagrelor in tablet dosage form. Chromatographic separation was achieved on an acquity UPLC BDS C8 (150 x 4.6 mm, 5) column with a mobile phase composed of Buffer 0.1% OPA (2.2 pH) and Acetonitrile in the ratio of 60:40 at a flow rate of 1.0 ml/min and 1 μl injection volume. The effluents were detected at a wavelength of 240 nm using TUV detector. The retention time of Ticagrelor was found to be at 0.942 min. %RSD of the Ticagrelor was found to be 0.7 The method was validated with respect to specificity, accuracy, linearity, precision, robustness. The correlation coefficient for Ticagrelor was found to be 0.999. Recovery of Ticagrelor in formulation was found to be 99.51% . LOD, LOQ values obtained from regression equations of Ticagrelor were 0.45, 1.35 respectively. Due to simplicity, high precision and rapidness the method can be successfully applied for estimation of Ticagrelor in tablet dosage form.
Keywords: Ultra Performance Liquid Chromatographic, Ticagrelor, Tablet dosage form.
Article Info:Received 02 Jan 2019; Review Completed 29 Jan 2019; Accepted 02 Feb 2019; Available online 15 Feb 2019
Cite this article as:
Omaima J, Shyamala, JVC Sharma,Development and validation of stability indicating UPLC method for the estimation of
ticagrelor in bulk and its tablet dosage form, Journal of Drug Delivery and Therapeutics. 2019; 9(1-s):201-205 DOI: http://dx.doi.org/10.22270/jddt.v9i1-s.2305
*Address for Correspondence:
Omaima J, Department of Pharmaceutical Analysis and Quality Assurance, Joginpally B R Pharmacy College, Hyderabad, T.S., India
1. INTRODUCTION
Ticagrelor, (1S,2S,3R,5S) – 3 - (7-{[(1R,2S) – 2 -(3,4difluoro phenyl) cyclopropyl]amino}-5-(propylsulfanyl)-3H-[1,2,3] triazolo[4,5-d]pyrimidin-3-yl)-5-(2-hydroxyethoxy)
cyclopentane-1,2-diol is a platelet aggregation inhibitor . Like the thienopyridines prasugrel, clopidogrel and ticlopidine, ticagrelor blocks adenosine diphosphate (ADP) receptors of subtype P2Y12. In contrast to the other antiplatelet drugs, ticagrelor has a binding site different from ADP, making it an allosteric antagonist, and the blockage is reversible. Moreover, the drug does not need hepatic activation, which might work better for patients with genetic variants regarding the enzyme CYP2C19 (although it is not certain whether clopidogrel is significantly influenced by such variants). The structure of Ticagrelor was shown in Fig. 1.
The literature survey revealed that there are few RP-HPLC 1-4 and UV5-7 methods are available for the estimation of Ticagrelor . However, a stability indicating UPLC method was not available. Hence, present work focused on the development and validation of a simple, rapid, robust and economical stability indicating UPLC method. To the best of our knowledge the anticipated method is the first UPLC
method to allow estimation of Ticagrelor in tablet dosage form.
2.MATERIALS AND METHODS 2.1 RP-HPLC method
2.1.1 Apparatus: The separation was carried on Waters
Acquity UPLC 2996 with Empower 2 software that consisted of a binary solvent manager equipped with automatic sampler. An acquity UPLC Hibra C18 2.1 ×100 mm, 1.8 μ column was used for separation of active ingredients. Analytes were monitored with TUV detector at a wavelength 222 nm. Ultrasonicator was used to remove dissolved gases and air bubbles in the mobile phase.
2.1.2 Materials: Ticagrelor standard sample was obtained
as gift samples from Spectrum Labs, Hyderabad. HPLC grade
water and methanol were purchased from Merck Ltd., Mumbai. Analytical grade acetonitrile and orthophosphoric acid were obtained from Rankem, Avantor Performance Material India Ltd. Marketed formulation of combination was purchased from local market.
2.1.3 Chromatographic Conditions: Separation of analytes
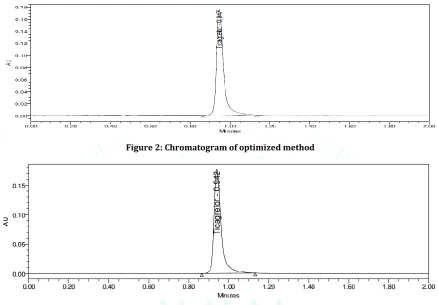
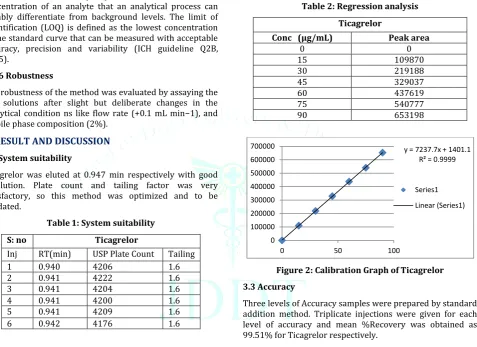
was achieved with a mobile phase consisting of 0.1% OPA and acetonitrile at a ratio of 50:40 delivered at a flow rate of 0.3ml/min through column kept at 25 ºC. The volume of injection was 1 μl and runtime was 2min. The eluents were detected at a wavelength 260 nm. Chromatograms of optimized method and standard were shown Fig. 2 and Fig. 3.
Figure 2: Chromatogram of optimized method
Figure 3: Chromatogram of standard preparation
2.1.4 Preparation of Standard stock solutions: Accurately
weighed 15mg of Ticagrelor transferred to individual 25 ml volumetric flasks separately. 3/4 th of diluents was added to both of these flasks and sonicated for 10 minutes. Flasks were made up with diluents and labeled as Standard stock solution. (600µg/ml of Ticagrelor) . 1ml from each stock solution was pipetted out and taken into a 10ml volumetric flask and made up with diluent. (60µg/ml Ticagrelor)
2.1.5 Preparation of Sample stock solutions: 5 tablets
were weighed and the average weight of each tablet was calculated, then the weight equivalent to 1 tablet was transferred into a 100 ml volumetric flask, 50ml of diluents was added and sonicated for 25 min, further the volume was made up with diluent and filtered by HPLC filters (600µg/ml of Ticagrelor). 1ml of filtered sample stock solution was transferred to 10ml volumetric flask and made up with diluent. (60µg/ml of Ticagrelor).
2.2 Validation of the HPLC method 8-11
2.2.1. System suitability
The developed method was validated according to ICH guidelines8. To check the system performance, the system
suitability parameters were measured. System precision was determined on six replicate injections of standard preparations. Number of theoretical plates and asymmetry were measured9-10
The system suitability parameters were determined by preparing standard solutions of Ticagrelor (60ppm) and the solutions were injected six times and the parameters like peak tailing, resolution and USP plate count were determined. The % RSD for the area of six standard injections results should not be more than 2%.
2.2.2 Linearity
Accurately weighed 15mg of Ticagrelor transferred to individual 25 ml volumetric flasks separately. 3/4 th of diluents was added to both of these flasks and sonicated for 10 minutes. Flasks were made up with diluents and labeled as Standard stock solution. (600µg/ml of Ticagrelor). The calibration graphs were plotted over 5 different linear concentrations in the range of 15-150 g/mL for ticagrelor. 2.2.3 Accuracy
from nine determinations over three concentration levels covering the specified range were determined.
2.2.4 Precision
Precision is the degree of repeatability of an analytical method under normal operational conditions. The precision of the assay was determined by repeatability (intra-day) and intermediate precision (inter-day) and reported as % R.S.D. for a statistically significant number of replicate measurements. The intermediate precision was studied by comparing the assays on 3 different days and the results documented as standard deviation and %R.S.D11.
2.2.5 LOD and LOQ
The limit of detection (LOD) is defined as the lowest concentration of an analyte that an analytical process can reliably differentiate from background levels. The limit of quantification (LOQ) is defined as the lowest concentration of the standard curve that can be measured with acceptable accuracy, precision and variability (ICH guideline Q2B, 2005).
2.2.6 Robustness
The robustness of the method was evaluated by assaying the test solutions after slight but deliberate changes in the analytical condition ns like flow rate (+0.1 mL min−1), and mobile phase composition (2%).
3.RESULT AND DISCUSSION 3.1 System suitability
Ticagrelor was eluted at 0.947 min respectively with good resolution. Plate count and tailing factor was very satisfactory, so this method was optimized and to be validated.
Table 1: System suitability
S: no Ticagrelor
Inj RT(min) USP Plate Count Tailing
1 0.940 4206 1.6
2 0.941 4222 1.6
3 0.941 4204 1.6
4 0.941 4200 1.6
5 0.941 4209 1.6
6 0.942 4176 1.6
According to the USP, the HPLC method is considered suitable when the ticagrelor of peak area ˂1%, tailing factor ˂2 and the theoretical plates ˃2000.
All the system suitability parameters were within the range and satisfactory as per ICH guidelines. The results of system suitability are shown in Table 1.
3.2 Linearity
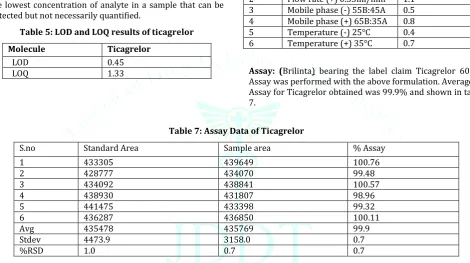
Six linear concentrations of Ticagrelor (15-90µg/ml) was injected in a duplicate manner. Average areas were mentioned above and linearity equations obtained for Ticagrelor was y = 7237.7.x + 1401.1. Correlation coefficient obtained was 0.999 for the drug. The regression analysis is shown in table 2.
Table 2: Regression analysis Ticagrelor
Conc (μg/mL) Peak area
0 0
15 109870
30 219188
45 329037
60 437619
75 540777
90 653198
Figure 2: Calibration Graph of Ticagrelor 3.3 Accuracy
Three levels of Accuracy samples were prepared by standard addition method. Triplicate injections were given for each level of accuracy and mean %Recovery was obtained as 99.51% for Ticagrelor respectively.
Table 3: Recovery studies of Ticagrelor
% Level Amount Spiked(μg/mL) Amount recovered (μg/mL) % Recovery Mean % Recovery
50%
30 30.25 100.84
99.51%
30 29.42 98.06
30 29.92 99.73
100%
60 60.12 100.20
60 59.47 99.12
60 59.51 99.19
150%
90 88.67 98.52
90 89.31 99.24
90 90.62 100.69
3.4 Precision
Multiple sampling from a sample stock solution was done and six working sample solutions of same concentrations
were prepared, each injection from each working sample solution was given and obtained areas were mentioned in the above table. Average area, standard deviation and % RSD y = 7237.7x + 1401.1
R² = 0.9999
0 100000 200000 300000 400000 500000 600000 700000
0 50 100
Series1
were calculated for drug and obtained as 0.7% respectively for Ticagrelor. As the limit of Precision was less than “2” the system precision was passed in this method.
Table 4: Repeatability table of Ticagrelor
S. No Area of Ticagrelor
1. 439649
2. 434070
3. 438841
4. 431807
5. 433398
6. 436850
Mean 435769
S.D 3158.0
%RSD 0.7
Limit of Detection and Limit of Quantification (LOD and
LOQ): The limit of detection is the point at which a measured
value is larger than the uncertainty associated with it. It is the lowest concentration of analyte in a sample that can be detected but not necessarily quantified.
Table 5: LOD and LOQ results of ticagrelor
Molecule Ticagrelor
LOD 0.45
LOQ 1.33
The limit of quantitation is the lowest injected amount that produces quantitative measurements in the target matrix with acceptable precision in chromatography. The quantitative limit is particularly used for the determination of impurities and degradation products. The results were shown in Table 5.
3.5 Robustness
Robustness conditions like Flow minus (0.27ml/min), Flow plus (0.33ml/min), mobile phase minus (55B:45A), mobile phase plus (65B:35A), temperature minus (25°C) and temperature plus (35°C) was maintained and samples were injected in duplicate manner. System suitability parameters were not much affected and all the parameters were passed. %RSD was within the limit.
Table 6: Robustness data for Ticagrelor
S.no Condition %RSD of Ticagrelor
1 Flow rate (-) 0.27ml/min 0.4
2 Flow rate (+) 0.33ml/min 1.1
3 Mobile phase (-) 55B:45A 0.5
4 Mobile phase (+) 65B:35A 0.8
5 Temperature (-) 25°C 0.4
6 Temperature (+) 35°C 0.7
Assay: (Brilinta) bearing the label claim Ticagrelor 60mg,
Assay was performed with the above formulation. Average % Assay for Ticagrelor obtained was 99.9% and shown in table 7.
Table 7: Assay Data of Ticagrelor
S.no Standard Area Sample area % Assay
1 433305 439649 100.76
2 428777 434070 99.48
3 434092 438841 100.57
4 438930 431807 98.96
5 441475 433398 99.32
6 436287 436850 100.11
Avg 435478 435769 99.9
Stdev 4473.9 3158.0 0.7
%RSD 1.0 0.7 0.7
Forced Degradation Studies: Forced degradation studies
were conducted to know the stability of the method. The degradation studies were carried out by applying various stress conditions for the product like acid stress, base stress, UV stress, humidity stress, thermal stress and oxide stress.
Degradation peaks were observed only in acid stress and peroxide stress and all degradation peaks were well resolved from analyte peaks. The results of forced degradation studies were shown in Table 8.
Table 8: results of forced degradation studies Type of
degradation Ticagrelor AREA %RECOVERED % DEGRADED
Acid 415118 95.13 4.87
Base 409117 93.76 6.24
Peroxide 419117 96.05 3.95
Thermal 428139 98.12 1.88
Uv 429780 98.49 1.51
Water 434865 99.66 0.34
CONCLUSION
The developed UPLC analytical method provides an ecofriendly, reliable, reproducible, simple, rapid, sensitive, accurate, precise and specific assay method for the simultaneous estimation of Ticagrelor in pharmaceutical
REFERENCES
1. Eena Joshy, Anu Babu, Delma D’cruz and Aneesh T. P., Development and validation of RP- HPLC method for determination of ticagrelor in pharmaceutical dosage formulation, Scholars Research Library, Der Pharmacia Lettre, 2016; 8 (9):206-212.
2. Kulkarni PR, Gajare GK, Development and validation of rp-hplc method for estimation of ticagrelor in bulk form, International Journal of Research in Pharmacy and Chemistry , 2016; 6(4):733-737.
3. D’Cruz D.; Babu A.; Joshy E.; Aneesh T. P. Bioanalytical method development and validation of ticagrelor by RP-HPLC, International Journal of Applied Pharmaceutics, Innovare Academics Sciences Pvt. Ltd, 2017; 9(3):51-54
4. Tabassum K, Sarvesh R, Analytical Method Development and VALIDATION Studies OF Ticagrelor Tablets by RP-HPLC, International Journal of Applied Pharmaceutics, 2017; 9(4). 5. Ambasana MA, Kapuriya N, Faldu NJ, Ladva K, Development
and validation of a UV spectrophotometric method for the determination of ticagrelor in bulk form, Der Pharmacia Lettre, 2014; 6(4):237-240.
6. Anil Kumar N, Naga Swathi PR, Sharmila D, Sharmila SK, Pawar AKM, A validated stability indicating method of UV-Spectrophotometry for the estimation of ticagrelor in bulk &
marketed formulation, Der Pharmacia Lettre, 2016, 8(19):309-315.
7. Saravanan V., Revathi R., & Meera N. Method development and validation for the simultaneous estimation of lycopene and ubidecarenone by RP-HPLC in combined pharmaceutical dosage form. Journal of Drug Delivery and Therapeutics, 2016; 6(5):46-51. https://doi.org/10.22270/jddt.v6i5.1295 8. ICH Proceedings of the International Conference on
Harmonisation of Technical Requirement of Registration of Pharmaceuticals for Human Use (ICH Harmonised Tripartite Guidelines). Validation of Analytical Procedures: Methodology, Q2B.
9. Bishnoi RS, Kumar M, Shukla AK, Jain CP, Development and validation of novel HPLC method for the estimation of Rutin in crude hydromethanolic leaf extract of Prosopis cineraria, Journal of Drug Delivery and Therapeutics. 2018; 8(6):68-73. 10. Kumar M, Shukla AK, Bishnoi RS, Jain CP, Development of UV
Spectrophotometric Method for The Determination of Benidipine Hydrochloride by Using Quality By Design (QbD) Approach. International Journal of Applied Pharmaceutics, 2018; 10(4):92-97.
11. Kim D., Yousaf A., Li D., Kim J., Yong C., Cho K. and Choi H. Development of RP-HPLC method for simultaneous determination of docetaxel and curcumin in rat plasma: Validation and stability. Asian Journal of Pharmaceutical Sciences, 2017; 12(1):105-113.