Open Access
Research
Evaluating changeability to improve fruit and vegetable intake
among school aged children
Marilyn S Nanney*
1, Debra Haire-Joshu
2, Michael Elliott
2, Kimberly Hessler
2and Ross C Brownson
2Address: 1Department of Health Promotion & Education, University of Utah, Salt Lake City, UT and 2Department of Community Health, School
of Public Health, Saint Louis University, St. Louis, MO
Email: Marilyn S Nanney* - [email protected]; Debra Haire-Joshu - [email protected]; Michael Elliott - [email protected]; Kimberly Hessler - [email protected]; Ross C Brownson - [email protected]
* Corresponding author
Abstract
Background: The purposes of this paper are two fold. First, to describe an approach used to identify fruits and vegetables to target for a child focused dietary change intervention. Second, to evaluate the concept of fruit and vegetable changeability and feasibility of applying it in a community setting.
Methods: Steps for identifying changeable fruits and vegetables include (1) identifying a dietary database (2) defining geographic and (3) personal demographics that characterize the food environment and (4) determining which fruits and vegetables are likely to improve during an intervention. The validity of these methods are evaluated for credibility using data collected from quasi-experimental, controlled design among 7–9 year old children (n = 304) participating in a tutoring or mentoring program in St. Louis, MO. Using a 28-item food frequency questionnaire, parents were asked to recall for their child how often foods were eaten the past 7 days. This questionnaire was repeated eight months later (response rate 84%). T-test analyses are used to determine mean serving differences from baseline to post test.
Results: The mean serving differences from baseline to post test were significant for moderately eaten fruits (p < .001), however, not for vegetables (p = .312). Among the intervention group, significantly more children ate grapes (p < .001), peaches (p = .022), cantaloupe (p < .001), and spinach (p = .044) at post testing – all identified as changeable with information tailored to participants.
Conclusion: Data driven, food focused interventions directed at a priority population are feasible and practical. An empirical evaluation of the assumptions associated with these methods supports this novel approach. However, results may indicate that these methods may be more relevant to fruits than vegetables. This process can be applied to diverse populations for many dietary outcomes. Intervention strategies that target only those changeable fruits and vegetables are innovative and warrant further study.
Published: 21 November 2005
Nutrition Journal 2005, 4:34 doi:10.1186/1475-2891-4-34
Received: 07 September 2005 Accepted: 21 November 2005
This article is available from: http://www.nutritionj.com/content/4/1/34 © 2005 Nanney et al; licensee BioMed Central Ltd.
Background
Children in the United States follow eating patterns that do not meet national recommendations for fruits and veg-etables. [1,2] To date, dietary interventions have been only modestly successful in increasing fruit and vegetable (FV) intake among children [3] with effect sizes ranging from .2 servings (Gimme 5) [4] to .99 servings (High 5 Project). [5] One means of improving the impact of die-tary interventions is to assure the intervention is relevant to a child by targeting foods that are available and accessi-ble in their environment. [6]
Program planning models suggest that directing program
resources toward those factors that are most changeable
helps to ensure program efficiency and effectiveness. [7,8] For dietary interventions, the concept of changeability can be defined as identifying those FV that have the greatest likelihood for increased consumption and targeting them for an intervention. Changeability is moderated by varia-tions in food consumption patterns across racial and eth-nic, [9-12] gender, [9,10,12-15] age, [11,13,15] marital status, [11] and regional [11,13,16] differences. Changea-bility is also influenced by the discrepancies in the availa-bility of food in the community and home environments, particularly in priority populations. [17-19]
From an individual perspective, the food experiences to which young children are exposed are critical to the early development of food acceptance patterns and choices. This exposure to FV influences familiarity, preferences, and intake. For purposes of an intervention, FV that are preferred and eaten by a child are less changeable because consumption goals are met. Instead, moderate intake of FV suggests foods that are familiar, accessible, and change-able. Systematic approaches derived from program plan-ning constructs, are needed to determine program relevance and changeability in order to successfully impact health behaviors. [8]
The purpose of this paper is to describe a systematic approach used for identifying changeable FV that were tar-geted for intervention in Partners of all Ages Reading About Diet and Exercise (PARADE), a school based men-toring program designed to improve FV intake of children ages 7 to 9 years. Children enrolled in the mentoring pro-gram received one to one tutoring on a weekly basis dur-ing regular school hours. PARADE was incorporated within the routine curriculum of the mentoring program. PARADE was based on social cognitive theory and included (1) eight lesson plans with computer-generated storybooks tailored to the dietary patterns of each 7–9 year old child and (2) eight mailed parent newsletters introducing each book and offering tips on how to role model healthy eating at home. PARADE was evaluated using a quasi-experimental study design. Participants in
the evaluation include children and their parents. Approval for this study was obtained from the Saint Louis University Institutional Review Board.
Methods
Steps for identifying changeable FV
Limited time and resources increased the importance of identifying appropriate foods for change in this priority population. The following steps were used to identify and tailor information on FV as part of PARADE lesson plans and storybooks.
Step 1: Identify a comprehensive nutrition database
Dietary measurement is complex. Accuracy can be maxi-mized with methods that help individuals correctly recall the foods and amounts eaten on any given day that repre-sents usual intake. Furthermore, a comprehensive list of foods and nutrient values is essential to calculating the dietary outcomes of interest. [20] The Continuing Survey of Food Intakes by Individuals (CSFII) database repre-sents data from the priority population and is methodo-logically and psychometrically sound. Also popularly known as the "What We Eat in America Survey," the CSFII is a national food consumption survey conducted by the Agricultural Research Service of the United States
Depart-ment of Agriculture. [21] The 10th edition of the CSFII
(1994–1996) provides nationally representative data by over sampling for low-income individuals and young children. Individuals are asked to provide food intakes on two nonconsecutive days using a multiple pass 24-hour dietary recall administered in the home by trained inter-viewers. Sample sizes include 12,700 adults of all ages and 11,800 children birth-19 years. Response rates include 1-day 80% and 2-1-day 76%. Food consumption data are available on CD-ROM from the USDA. More information, including ordering the CD's, can be found at http:// www.ars.usda.gov/Services/docs.htm?docid=7787.
Step 2: Define the sociodemographic characteristics of the priority population
Step 3: Define the geographic characteristics of the priority population
Dietary intake varies by geographic region and urban ver-sus rural influences. The CSFII divides the United States into five geographic regions that are further defined by urbanization type. Urbanization types include city, out-side the city, and rural areas. PARADE participants lived in ten urban and suburban counties in a large Midwest city. Therefore, the CSFII data was analyzed for those living in a metropolitan city and outside the city in the Midwest. Results identified nearly three-quarters of the sample liv-ing in a metropolitan area (central city, 21% and subur-ban, 53%). These geographic criteria resulted in a final sample of dietary intake data for 164 children, mean age 7.93 (SD = .82). Steps 1–3 identified 2423 food entries by the CSFII. This included 670 unique foods including 49 fruits and 79 vegetables consumed by the sample.
Step 4: Identify changeable FV for the priority population
Individual characteristics and environmental exposures influence food familiarity and determine frequency of consumption. We next selected those foods meeting crite-ria for 'moderate consumption'. CSFII food consumption data is organized by numerical food codes and food amounts. Data can be viewed in a number of ways; spe-cific food, food form (canned, frozen, raw), how often a food was eaten, and the amount eaten (gram weight). Individual food items were rank ordered by the percent-age of respondents who reported consuming them over the observation period. Foods whose rank fell into the 25th to 75th percentile were defined as "moderately
con-sumed". Five fruits and eight vegetables were identified as moderately consumed and targeted for an intervention among these school-aged children. Foods in the top quar-tile (>75%) or most frequently consumed (i.e., oranges,
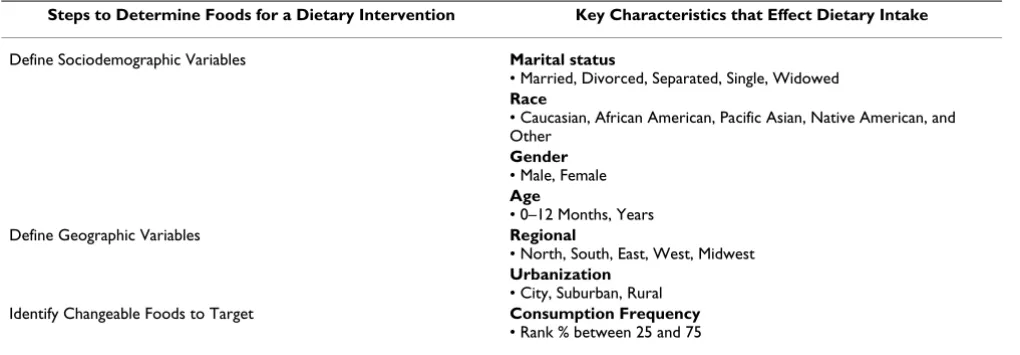
carrots) and FV at the lower range (<25%) of consump-tion (i.e., grapefruit, sweet potatoes) were not included in the intervention. Table 1 summarizes the steps that define the key characteristics to consider when determining rele-vant foods for a dietary intervention.
Results
Using national frequency data to estimate local FV consumption
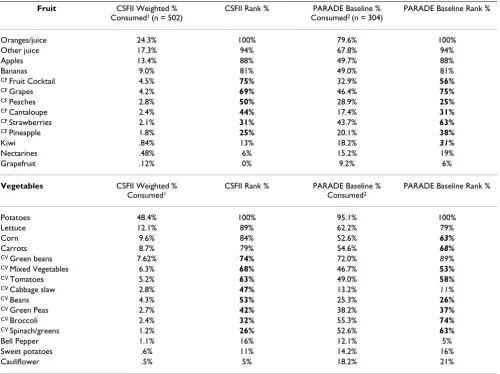
An important assumption being made is that accurate conclusions can be drawn from food consumption fre-quencies collected from a national sample because they mirror local consumption patterns. Table 2 compares FV consumption frequency identified from the CSFII with baseline PARADE data (intervention and delayed inter-vention groups) and indicates agreement between CSFII rank % and PARADE rank % consumptions. For example, according to the national data, those FV eaten most fre-quently (oranges, juice, apples, potatoes, lettuce) corre-spond with the PARADE baseline data as indicated by the 76–100 rank percents. Similar agreement occurs for those fruits and vegetables eaten moderately (25–75 rank per-cent) and least often (<25 rank perper-cent). However, a few discrepancies are noted. Although not identified as a moderately eaten fruit from the national data set, kiwi falls within the moderately eaten range at PARADE base-line (13% versus 31%) and therefore should have been targeted as changeable in the intervention. Vegetable con-sumption was less congruent than fruit concon-sumption. Two vegetables (corn, carrots) were eaten more often in the national sample than reported by PARADE children at baseline. Conversely, PARADE children ate green beans and cabbage slaw more often. Overall, the authors con-clude that using national dietary data to identify percent rank cut points defining consumption frequency can be
Table 1: Steps to identify relevant foods to target in a dietary intervention
Steps to Determine Foods for a Dietary Intervention Key Characteristics that Effect Dietary Intake
Define Sociodemographic Variables Marital status
• Married, Divorced, Separated, Single, Widowed
Race
• Caucasian, African American, Pacific Asian, Native American, and Other
Gender
• Male, Female
Age
• 0–12 Months, Years
Define Geographic Variables Regional
• North, South, East, West, Midwest
Urbanization
• City, Suburban, Rural
Identify Changeable Foods to Target Consumption Frequency
useful when developing community interventions. These methods may be more accurate in predicting fruit con-sumption than vegetable concon-sumption.
After identifying FV for intervention, we incorporated this information into 8 tailored storybooks. Professionally trained interviewers then administered a telephone survey to parents of children enrolled in participating tutoring programs. Using a 28-item FV food frequency question-naire, parents were asked to recall for their child how often select foods were eaten within the past 7 days. This questionnaire was repeated eight months later. Response choices included "none, 1 time, 2 times, 3–4 times, 5–6 times, 7 or more times in the past week". The question-naire demonstrated acceptable internal consistency
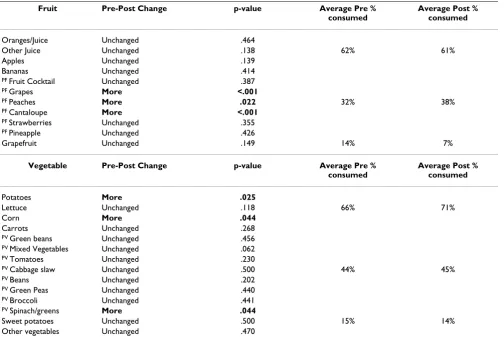
(Chronbach's alpha = .744). Table 3 presents the PARADE changeability results. Six PARADE fruits (PF) and eight vegetables (PV) identified as moderately consumed are hypothesized to be the most likely to improve from base-line to post intervention. Differences in the percent of children who consumed the "same (unchanged) or more" of each PF and PV from baseline to posttest indicate that those targeted as changeable in the intervention were more likely to be eaten.
Among the intervention group, significantly more chil-dren ate grapes (p < .001), peaches (p = .022), cantaloupe (p < .001), and spinach (p = .044) at post testing – all identified as changeable with information tailored to PARADE participants. As hypothesized, consumption of
Table 2: Fruits and vegetables identified as changeable and targeted for intervention
Fruit CSFII Weighted % Consumed1 (n = 502)
CSFII Rank % PARADE Baseline %
Consumed2 (n = 304)
PARADE Baseline Rank %
Oranges/juice 24.3% 100% 79.6% 100%
Other juice 17.3% 94% 67.8% 94%
Apples 13.4% 88% 49.7% 88%
Bananas 9.0% 81% 49.0% 81%
CF Fruit Cocktail 4.5% 75% 32.9% 56%
CF Grapes 4.2% 69% 46.4% 75%
CF Peaches 2.8% 50% 28.9% 25%
CF Cantaloupe 2.4% 44% 17.4% 31%
CF Strawberries 2.1% 31% 43.7% 63%
CF Pineapple 1.8% 25% 20.1% 38%
Kiwi .84% 13% 18.2% 31%
Nectarines .48% 6% 15.2% 19%
Grapefruit .12% 0% 9.2% 6%
Vegetables CSFII Weighted % Consumed1
CSFII Rank % PARADE Baseline %
Consumed2
PARADE Baseline Rank %
Potatoes 48.4% 100% 95.1% 100%
Lettuce 12.1% 89% 62.2% 79%
Corn 9.6% 84% 52.6% 63%
Carrots 8.7% 79% 54.6% 68%
CV Green beans 7.62% 74% 72.0% 89%
CV Mixed Vegetables 6.3% 68% 46.7% 53%
CV Tomatoes 5.2% 63% 49.0% 58%
CV Cabbage slaw 2.8% 47% 13.2% 11%
CV Beans 4.3% 53% 25.3% 26%
CV Green Peas 2.7% 42% 38.2% 37%
CV Broccoli 2.4% 32% 55.3% 74%
CV Spinach/greens 1.2% 26% 52.6% 63%
Bell Pepper 1.1% 16% 12.1% 5%
Sweet potatoes .6% 11% 14.2% 16%
Cauliflower .5% 5% 18.2% 21%
CF = Changeable Fruits CV = Changeable Vegetables
1 CSFII weighted percent consumed was calculated from the percentage of respondents who reported consuming each food item at least once during the period under observation (two days). These data were weighted to represent urban and sub-urban Midwesterners using weights provided by the CSFII study.
fruits and vegetables frequently and rarely eaten remained unchanged or were eaten more in two instances (potatoes, corn). Worth noting is that the majority of the vegetables remained unchanged at the end of the intervention. These results may indicate that these methods may be more rel-evant to fruits than vegetables.
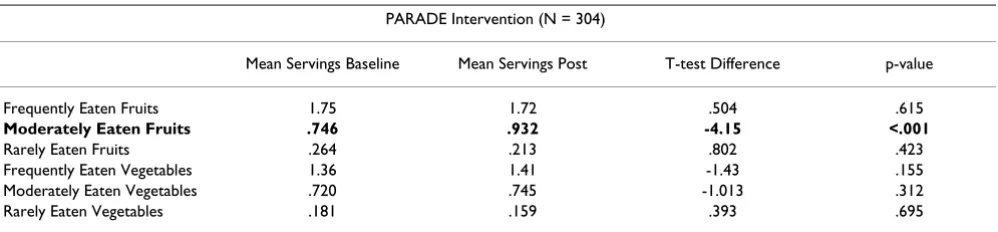
Table 4 summarizes the results by grouping all frequently, moderately, and rarely consumed FV. Average (or mean) baseline servings among PARADE intervention partici-pants (N = 304) are consistent with the assumptions pre-sented where those described as frequently (Mean = 1.75 servings), moderately (Mean = 0.75 servings), and rarely (Mean = 0.26 servings) consumed follow that pattern. T-test analyses indicate that mean serving differences from baseline to post test were significant for moderately eaten fruits (p < .001), however, not for vegetables (p = .312). In general, the authors conclude that applying the concept of changeability to a FV intervention among school-aged children is feasible and supported by this data.
Discussion
Recent findings suggest that innovative research is neces-sary to broaden the traditional approach beyond increas-ing FV awareness and education. [22] Overall, this study reinforces these methods as a way to systematically iden-tify FV to target for an intervention. Ideniden-tifying and con-centrating on the most changeable behavioral targets for interventions direct resources to where they will be most beneficial. Furthermore, greater specificity in program development simplifies the evaluation process (i.e., brief food frequency questionnaire). [23,24]
Assessments of changeability across fruit and vegetable patterns can be made by defining person and place varia-bles of the priority population, examining the frequency with which fruits and vegetables have been consumed, and identifying those that can be reasonably expected to change for targets of an intervention. Moreover, this approach takes into account important environmental influences upon dietary patterns. Haire-Joshu and
Nan-Table 3: Fruits and vegetables targeted for Project PARADE improved at post intervention
Fruit Pre-Post Change p-value Average Pre %
consumed
Average Post % consumed
Oranges/Juice Unchanged .464
Other Juice Unchanged .138 62% 61%
Apples Unchanged .139
Bananas Unchanged .414
PF Fruit Cocktail Unchanged .387
PF Grapes More <.001
PF Peaches More .022 32% 38%
PF Cantaloupe More <.001
PF Strawberries Unchanged .355
PF Pineapple Unchanged .426
Grapefruit Unchanged .149 14% 7%
Vegetable Pre-Post Change p-value Average Pre % consumed
Average Post % consumed
Potatoes More .025
Lettuce Unchanged .118 66% 71%
Corn More .044
Carrots Unchanged .268
PV Green beans Unchanged .456
PV Mixed Vegetables Unchanged .062
PV Tomatoes Unchanged .230
PV Cabbage slaw Unchanged .500 44% 45%
PV Beans Unchanged .202
PV Green Peas Unchanged .440
PV Broccoli Unchanged .441
PV Spinach/greens More .044
Sweet potatoes Unchanged .500 15% 14%
Other vegetables Unchanged .470
ney describe individual food preference, cultural and familial influences, and home, school and community environments as having significant influences upon the food environment of children. [6] This process addresses eating behavior as a function of the varied food environ-ments for a specific population, albeit, in a broader com-munity based context.
We developed, applied, and tested a systematic, data based approach to assess changeability and specify fruits and vegetables for an intervention among underserved school aged children. This approach will allow for further clarity of intervention effects by targeting only those changeable fruits and vegetables for intervention. Further-more, this process can be applied to diverse populations for a variety of dietary outcomes. Additionally, larger mass media interventions like the 5 A Day campaign may ben-efit from this approach. More research is needed to evalu-ate the effectiveness and generalizability of community-based efforts that promote changeable foods for an inter-vention.
Competing interests
The author(s) declare that they have no competing inter-ests.
Authors' contributions
MSN conceived of the concept of changeability and applied the methods to the intervention, developed the data collection instrument and drafted the manuscripts. DHJ conceived of the study, and participated in its design and coordination and helped to draft the manuscript. ME managed the data, performed statistical analysis, and helped to draft the manuscript. KH contributed to the conception of the study, application of the methods, and helped draft the manuscript. RB participated in the design of the study, oversaw the statistical analysis, and helped to draft the manuscript.
Acknowledgements
This work is based upon funding from the American Cancer Society (TURPG-00-286-01 PBP) and National Institutes of Nursing Research (USPHS-5-R01-NR05079). The authors would like to recognize Program
Manager of the PARADE Project Brandye L. Mazdra and our community partners; The OASIS Institute, St. Louis area Big Brothers Big Sisters, and Girls Inc.
References
1. Krebs-Smith SM, Cook A, Subar AF, Cleveland L, Friday J, Kahle LL:
Fruit and Vegetable Intakes of Children and Adolescents in the United States. Arch Pediatr Adolesc Med 1996, 150:81-86. 2. Munoz KA, Krebs-Smith SM, Ballard-Barbash RB, Cleveland LE: Food
Intakes of US Children and Adolescents Compared With Recommendations. Pediatrics 1997, 100(9):323-329.
3. Ammerman A, Lindquist C, Lohr KN, Hersey J: The Efficacy of Behavioral Interventions to Modify Dietary Fat and Fruit and Vegetable Intake: A Review of the Evidence. Preventive Medi-cine 2002, 35:25-41.
4. Baranowski T, Davis M, Resnicow K, Baranowski J, Doyle C, Lin LS, Smith M, Wang DT: Gimme 5 fruit, juice, and vegetables for fun and health: outcome evaluation [published erratum appears in Health Educ Behav 2000 Jun;27(3):390]. Health Educ Behav
2000, 27(1):96-111.
5. Reynolds KD, Franklin FA, Binkley D, Raczynski JM, Harrington KF, Kirk KA, Person S: Increasing the fruit and vegetable consump-tion of fourth-graders: results from the high 5 project. Prev Med 2000, 30(4):309-319.
6. Haire-Joshu D, Nanney MS: Prevention of overweight and obes-ity in children: Influences on the Food Environment. The Dia-betes Educator 2002, 28(3):415-422.
7. Glanz K, Lewis FM, Rimer BK: Health behavior and health edu-cation: theory, research, and practice. 2nd edition. San Fran-cisco , Jossey-Bass; 1997.
8. Green LW, Kreuter MW: Behavioral and environmental assess-ment. In Health Promotion and Planning 3rd. edition. California , May-field Publishing Company; 1999:145.
9. Akan GE, Grilo CM: Sociocultural influences on eating atti-tudes and behaviors, body image, and psychological func-tioning: a comparison of African American, Asian American, and Caucasian college women. International Journal of Eating Dis-orders 1995, 18(2):181-187.
10. Bronner Y: Nutritional status outcomes for children: Ethnic, cultural, and environmental contexts. Journal of the American Dietetic Association 1996, 96(9):891-903.
11. Thompson B, Demark-Wahnefried WD, Taylor G: Baseline fruit and vegetable intake among adults in seven 5 a day study centers located in diverse geographic areas. J Am Diet Assoc
1999, 99:1241-1248.
12. Xie B, Gilliland FD, Li YF, Rockett HR: Effects of Ethnicity, Family Income, and Education on Dietary Intake among Adoles-cents. Preventive Medicine 2003, 36:30-40.
13. DiSogra L, Glanz K: The 5 A Day Virtual Classroom: an on-line strategy to promote healthful eating. Journal of the American Die-tetic Association 2000, 100(3):349-352.
14. Kumanyika S, Tell GS, Shemanski L, Polak J, Savage PJ: Eating pat-terns of community-dwelling older adults: the Cardiovascu-lar Health Study. 4 1994:Ann Epidemiol.
15. Shi L: Sociodemographic characteristics and individual health behaviors. Southern Medical Journal 1998, 91(10):933-941.
Table 4: Moderately eaten fruits improved at post intervention
PARADE Intervention (N = 304)
Mean Servings Baseline Mean Servings Post T-test Difference p-value
Frequently Eaten Fruits 1.75 1.72 .504 .615
Moderately Eaten Fruits .746 .932 -4.15 <.001
Rarely Eaten Fruits .264 .213 .802 .423
Frequently Eaten Vegetables 1.36 1.41 -1.43 .155
Moderately Eaten Vegetables .720 .745 -1.013 .312
Publish with BioMed Central and every scientist can read your work free of charge "BioMed Central will be the most significant development for disseminating the results of biomedical researc h in our lifetime."
Sir Paul Nurse, Cancer Research UK
Your research papers will be:
available free of charge to the entire biomedical community
peer reviewed and published immediately upon acceptance
cited in PubMed and archived on PubMed Central
yours — you keep the copyright
Submit your manuscript here:
http://www.biomedcentral.com/info/publishing_adv.asp
BioMedcentral
16. Kirby S, Baranowski J, Reynolds K, Taylor G, Binkley D: Children's fruit and vegetable intake: Sociodemographic, adult child, regional, and urban-rural influences. Journal of Nutrition Educa-tion 1995, 27:261-271.
17. Hearn MD, Baranowski J, Doyle C, Smith M, Lin LS, Resnicow K:
Environmental influences on dietary behavior among chil-dren: availability and accessibility of fruits and vegetables enable consumption. J Health Educ 1998, 29:26-32.
18. Kratt P, Reynolds K, Shewchuk R: The Role of Availability as a moderator of Family Fruit and Vegetable Consumption. Health Education and Behavior 2000, 27(4):471-482.
19. Morland K, Wing S, Roux AD: The Contextual Effect of the Local Food Environment of Residents' Diets: The Athero-sclerosis Risk in Communities Study. American Journal of Public Health 2002, 92(11):1761-1767.
20. Buzzard M: 24-hour dietary recall and food record methods. In
Nutritional Epidemiology 2nd edition. Edited by: Willett W. New York , Oxford University Press; 1998.
21. Continuing Survey of Food Intakes by Individuals (CSFII) and the Diet and Health Knowledge Survey (DHKS), 1994-96.
1998.
22. Serdula MK, Gillespie C, Kettel-Khan L, Farris R, Seymour J, Denny C:
Trends in fruit and vegetable consumption among adults in the United States: Behavioral Risk Factor Surveillance Sys-tem, 1994-2000. American Journal of Public Health 2004,
94:1014-1018.
23. Nanney MS, Hessler K, Kelly C, Haire-Joshu D: Identifying usual portion sizes for commonly eaten foods among 7-9 year olds using parent-child consensus. Saint Louis University School of Public Health; 2003.
24. Nielsen SJ, Popkin BM: Patterns and trends in food portion sizes, 1977-1998. American Medical Association 2003,