http://www.sciencepublishinggroup.com/j/ajee doi: 10.11648/j.ajee.20180604.12
ISSN: 2329-1648 (Print); ISSN: 2329-163X (Online)
Comparison of GA and PS Optimization Mechanisms for
Optimizing 100MW Delta IV Ughelli Gas Turbine Power
Plant Operating Parameters
Ugwuoke Philip Emeka
Department of Mechanical Engineering, Petroleum Training Institute, Effurun, Nigeria
Email address:
To cite this article:
Ugwuoke Philip Emeka. Comparison of GA and PS Optimization Mechanisms for Optimizing 100MW Delta IV Ughelli Gas Turbine Power Plant Operating Parameters. American Journal of Energy Engineering. Vol. 6, No. 4, 2018, pp. 44-49. doi: 10.11648/j.ajee.20180604.12
Received: November 9, 2018; Accepted: December 10, 2018; Published: January 16, 2019
Abstract:
A comparative analysis for improving the efficiency of 100MW Delta IV Ughelli gas turbine power plant is performed. The study used non-dominated sorting genetic and pattern search algorithms to minimize the objective function by optimally adjusting the operating parameters (decision variables). The adjusted operating variables were compressor inlet temperature (T1), compressor pressure ratio (rp), compressor isentropic efficiency (ɳic), turbine isentropic efficiency (ɳit),turbine exhaust temperature (T4) and air mass flow rate (ma), fuel mass flow rate (mf) and fuel supply temperature (Tf). The
ambient temperature and pressure were held constant at 304K and 1.01325bar respectively because of location limitation. The optimization code was written in Matlab programming language. The decision variables (constraints) were obtained randomly within the admission range. The GA and PS optimal values of the decision variables were obtained by minimizing the objective function. The determined GA and PS optimum operating variables have the same values which were compressor pressure ratio (rn) = 9.76, compressor isentropic efficiency (ɳic) = 86.40%, turbine isentropic efficiency (ɳit) = 89.12%,
combustion chamber outlet temperature (T3) = 1481.8K, air mass flow rate = 530kg/s, fuel mass flow rate = 7.00kg/s. The total
exergy destruction cost rate ( D) for PS and GAvaries by +0.00004% and the total investment cost rate for PS and GAvaries by
+0.00038%. The results show that there is slight increase in total exergy destruction cost rate and total capital investment cost rate in PS optimum when compared to GA optimum. This shows that GA is better than PS as an optimization algorithm.
Keywords:
Comparative Analysis, Optimizing, Genetic Algorithm, Pattern Search1. Introduction
The most effective means for improving the performance of existing power plants in order to attain high thermal efficiency, reliability and low operating cost has continued to agitate the mindsof Engineers. This research uses exergy analysis, a method that uses the conservation of mass and conservation of energy principles together with the second law of thermodynamics for the design and analysis of thermal systems [1]. Genetic Algorithm and pattern search were used to minimize the exergy destruction by optimally adjusting the operating parameters. Genetic Algorithm as an optimization tool works based on Charles Darwins theory of evolution (survival of the fittest). Genetic algorithm was originally designed as simulator but has proven to be a robust optimization technique [2-3].Genetic algorithm uses two
created randomly at the onset is called initial population. The size of this population may vary from several tens of chromosomes (strings) to several thousands. The criterion applied in determining an upper bound for the size of population is that further increase does not result in improvement of near-optimal solution. The upper bound for each problem is determined after some test runs. For most applications, the best population size lies within the limits of 100 – 1000 strings [2-3]. On the basis of the optimality (measure of goodness) value, an objective function value or fitness value is assigned to each string. This fitness usually set as the amount of optimality of each string in the population divided by the average population optimality. Effort is always made to ensure that the fitness value is a positive number [2]. It is possible that a certain string does not reflect an allowable condition. For such a case, the fitness of the string is penalized with a very low value, indicting in such a way to the GA that it is not a good string. Similarly, other constraints may be implemented in the GA. The “operators”, which are kinds of population transformation devises, are applied to the population. As a result of these operators, a new population is created, that will hopefully consist most optimal strings. The old population is replaced by new one. A predefined stopping criterion, usually maximum number of generation s to be performed by the GA is checked. If the criterion is not satisfied, a new generation is started, otherwise, the GA terminates.
Pattern search(PS), algorithm proceeds by computing a sequence of points that may or may not approach to the optimal point. The algorithm starts by establishing a set of points called mesh, around the given point. This current point could be the initial starting point supplied by the user or it could be computed from the previous step of the algorithm. The mesh is formed by adding the current point to a scalar multiple of a set of vectors called a pattern. If a point in the mesh is found to improve the objective function at the current point, the new point becomes the current point at the next iteration.
This maybe better explained by the following[4]:
First, the pattern search beginsat the initial point X0 that is
given as a starting point by the user. At the first iteration, with a scalar = 1 called mesh size, the pattern vectors are constructed as [0 1], [1 0], [1 0], and [0 1], they may be called direction vectors. Then the pattern search algorithm adds the direction vectors to the initial point X0 to compute
the following mesh points: X0 + [10]
X0 + [01]
X0 + [-10]
X0 + [0-1]
The algorithm polls the mesh points by computing their objective function values until it finds one whose value is smaller than the objective function value of X0. If there is
such point, then the poll is successful and the algorithm sets this point equal to X1.
After a successful poll, the algorithm steps to iteration 2 and multiplies the current mesh size by 2, (this is called the
expansion factor and has a default value of 2). The mesh at iteration 2 contains the following points: 2*[10] +X1, 2*[01] +
X1, 2*[-10]+X1 and X*[0-1]+X1. The algorithm polls the
mesh points until it finds one whose value is smaller than the objective function value X1. The first such point it finds is
called X2. And the poll is successful. Because the poll is
successful, the algorithm multiplies the current mesh size by 2 to get a mesh size of 4 at the third iteration because the expansion factor = 2.
Secondly,if iteration3, (mesh size = 4), ends up being unsuccessful poll, i.e. none of the mesh points has a smaller objective functionvalue thanthe value at X2, so the poll is
called an unsuccessful poll. In this case, the algorithm does not change the current point at the next iteration.That is, X3 =
X2. At the next iteration,the algorithmmultiplies the
currentmesh size by 0.5, a contractionfactor,so thatthe meshsize atthenextiterationis smaller.The algorithm then polls with a smaller mesh size.
Thepatternsearchoptimization algorithmwill repeat the illustratedsteps untilit finds the optimalsolutionfor the minimizationof the objective function.The algorithm stops when any of the following conditions occurs:
1.The mesh size is less than mesh tolerance.
2.The number of iterations performed by the algorithm reaches a predefined value.
3.The totalnumberof objective functionevaluationsper-formedbythealgorithmreachesapre-setmaximum numberof functionevaluations.
4.The distance between the point found at one successful poll and the point found at the next successful poll is less than a set tolerance.
5.The change in the objective function from one successful poll to the next successful poll is less than a function tolerance.
The objective is to carry out a comparative Analysisfor optimal performance of 100MW Gas Turbine Power Plant using GA and PS algorithms to minimize the exergy destruction cost rate by optimally adjusting the operating parameters.The parameters are: compressor pressure ratio, compressor isentropic efficiency, turbine isentropic efficiency, fuel mass flow rate, and air mass flow rate and turbine inlet temperature.
2. Materials and Method
Figure 1.Schematic diagram of the plant.
In analysis of the plant, the operating parameters of the plant [6] as shown in table 1 below and exergoeconomic principles were used.
Table 1. Operating Parameters of Delta power plant.
Property Value
Ambient Temperature, T1 303K Compressor outlet temperature, T2 632.2K Temperature of the fuel Tf 298.15K Turbine inlet temperature, T3 1238.5K Turbine outlet temperature, T4 807K Compressor inlet pressure, P1 1.013bar Compressor outlet pressure, P2 10 6 bar
Compressor pressure ratio, rpi.e. 2 1
p
p 10.47
Compressor isentropic efficiency, ηic 88%
Turbine isentropic efficiency, ηit 89%
Mass flow rate of fuel, mɺf 7.04 kg/s
Inlet mass flow rate of air, mɺa 427kg/s
power output, Wnet 46.91(MW) Lower heating value of fuel, Q 50kJ/kg
2.1. Exergoeconomic Principles
The capital investment cost rates for the components were determined based on the modeling expression recommended by [7]. Using the capital recovery factor (CRF(i,n)) and present worth factor (PWF(i,n)), the annual levelized cost may be written as:
Ċ , , (1) Where 0.1 , , / 1 1
, , 1 ,
And PEC is the purchased-equipment cost. Equations for calculating the purchased-equipment costs for the components of the gas turbine power plant [10] are:
For the Compressor, it is expressed as
. !"
#.$ %&'(
)*
)+( ,
)*
)+( (2)
For the Combustion Chamber, it is expressed as
-./.#0!"
#.$$1 232*4 1 exp 0.0189: 26.4 (3)
For the Turbine, it is given as
>? . $.:.!#.$A %&B@( , ))3C( 1 exp 0.0369: 54.4 (4)
Dividing the levelized cost by 8000 annual operating hours (about one month in a year the power plant will be off for maintenance) [8], it is obtainedthat the capital cost rate for the kth component of the plant:
ŻG ∅0###IĊI( (5)
The maintenance cost is taken into consideration through the factor φk = 1.06 for each plant component whose
expected life is assumed to be 15 years and the interest rates is 14% [9]. The number of hours of plant operating per year and the maintenance factor utilized in this study are the typical numbers employed in standard exergoeconomic analysis [10]
The formulations of cost balance for each component and the required auxiliary equations are:
For the compressor, it is expressed as
ĊA Ċ ĊJ Ż (6)
where the subscripts wc denotes the power input to the
compressor.
For the Combustion Chamber, it is expressed as
ĊK ĊL ĊM ŻNN (7)
For the Turbine, it is given as
ĊO ĊPN ĊPQ ĊK ŻQ (8) ĊK
ĖK
ĊPQ
PQ (9)
Where ? denotes the net power generated by the turbine. Auxiliary equation (9) is written assuming the same unit cost of incoming fuel and outgoing exergy streams. A zero unit cost is assumed for air entering the compressor (i.e. Ċ1 =
0).Additional auxiliary equation is formulated assuming the same unit cost of exergy for the net power output of the system and power input to the compressor:
ĊPQ PQ
ĊPS
PS (10)
The information of the cost streams help in exergoeconomic evaluation of the system. In exergoeconomic evaluation of thermal systems, certain quantities, known as exergoeconomic variables, play an important role. These are the average unit cost of fuel (cF,k),
average unit cost of product (cP,k), the cost rate of exergy
destruction (ĊD,k), and the exergoeconomic factor (fk).
Mathematically, these are expressed [11] as:
TU.G ĊĖV.IV.I (11)
T).G ĊĖ2.I2.I (12)
YG ŻIZĊŻI[.I (14)
Exergy costing balances (exergoeconomic balances) were carried out for each component. The exergy cost balance consists of operating cost rate (fuel cost rate), capital cost rate and product cost rate.
The cost balance equation is given as;
ŻX ∑ ĊU,X ∑ Ċ),X (15)
2.2. Economic Constraints
For a component receiving a heat transfer and generating power, cost balance equation may be written as [12]:
∑ Ċ] ],X ĊJ,X Ċ^,X ∑ Ċ_ _,X ŻX (16)
where Ċ denotes a cost rate associated with an exergy stream and the variable Ż represents non-exergetic costs.
2.3. The Objective Function
The objective function expresses total cost rate of the plant in terms of naira per unit time.
i. e. a Ċ)?b? c Ċdedfg ∑ ŻX ∑ ĊW,X (17)
The thermal system requires two conflicting objectives; one being increase in exergetic and energy efficiencies and the other is decrease in product cost to be satisfied simultaneously. The maximization of exergetic efficiency means minimization of exergy destruction cost. Thus, the objective fucntion becomes a minimization problem. The objective function for this problem is defined as to minimize a total cost function Ċ)?b? c which is modelled as:
Ċ)?b? c ĊU?b? c ∑ ŻX (18) In this optimization, compressor pressure ratio h) , compressor isentropic efficiency i_ , turbine isentropic efficiency i_? , combustion product temperature 9: , air mass flow rate e , fuel mass flow rate jedk, temperature of the fuel j9dk are taken as decision variables.
The stopping conditions used for solving the optimization problem are the maximum number of generations/iterations and cumulative function tolerance, which are shown in Table 3.
Table 2. Stop criteria for the optimization algorithms.
No of Generation No of Iteration Function Tolerance
GA 300 1 x 10⁻⁷
PS 50 1 x e-6
Source [6]
2.4. Genetic Algorithm Optimization
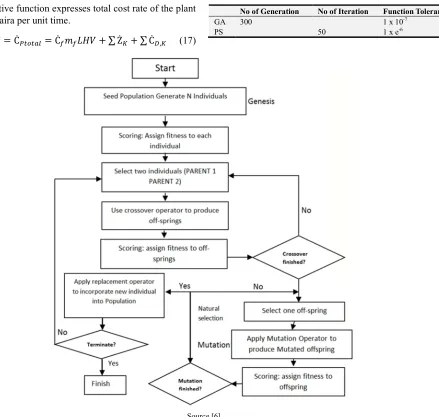
The optimization is done using Non-Dominated Sorting Genetic Algorithm (NSGA) proposed by [13].The algorithm eliminates higher computational complexity, lack of elitism and the requirement for specifying sharing parameter. The developed GA code selects the decision variables in such a way to decrease the objective function. The flowchart of the algorithm is shown in Figure 2. The optimization code was written in MATLAB programming language. The optimal values of the decision variables (constraints) were obtained by minimizing the objective function.
2.5. Pattern Search Algorithm Optimization
The pattern Search (PS) optimization is done using direct search method. Direct search methods are simply structured to explore a set of points, around the current position, looking for a point that has smaller objective function value than the current one. The objective function computation code was written in MATLAB programming language. Unlike genetic algorithm [14-15], PS possesses a flexible and well-balanced operator to enhance and adapt the global and fine tune local search. The flow chart of the algorithm is shown in figure 3
Source: [4]
Figure 3. Flow chart of pattern search.
3. Results and Discussion
Table 3. Comparison of the base and optimal Results.
Property Base Data GA Optimal Results PS Optimal Results
Compressor Pressure Ratio(rp) 10.47 9.76 9.76
Compressor Isentropic Efficiencyɳic (%) 88.0 86.4 86.4 Turbine Isentropic Efficiencyɳit (%) 89.00 89.12 89.12 Turbine Inlet TemperatureT3(K) 1,238.5 1,481.8 1,481.8
Output Power Wt (MW) 188.2 277.11 277.11
Input Power,Wc (MW) 141.29 169.63 169.63
Total Exergy Destruction, EDT (MW) 224.05 67.10 67.10
Total Cost Rate CT ($/hr) 24451.99 13292 13292
Fuel Cost RateCf ($/hr) 2914.10 2898 2898
Total Exergy Destruction Cost Rate CD ($/hr) 14722.38 2310.18 2310.18 Total investment Cost ratelk($/ hr) 6815.44 8083.65 8083.65
Plant Exergy Efficiency, ɳε(%) 13 29 29
Plant Energy Efficiency ɳE(%) 13 31 31
Mass flow rate Airma (kg/s) 427.00 530 530
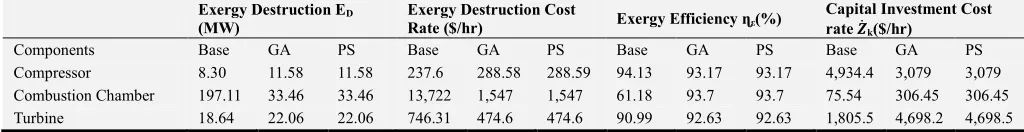
Table 4. Comparison of Component Data for Base, GA and PS Optimal Results.
Exergy Destruction ED (MW)
Exergy Destruction Cost
Rate ($/hr) Exergy Efficiency ɳε(%)
Capital Investment Cost rate mk($/hr)
Components Base GA PS Base GA PS Base GA PS Base GA PS Compressor 8.30 11.58 11.58 237.6 288.58 288.59 94.13 93.17 93.17 4,934.4 3,079 3,079 Combustion Chamber 197.11 33.46 33.46 13,722 1,547 1,547 61.18 93.7 93.7 75.54 306.45 306.45 Turbine 18.64 22.06 22.06 746.31 474.6 474.6 90.99 92.63 92.63 1,805.5 4,698.2 4,698.5
As shown in table 4, the values of variables ɤp, ɳic, ɳit, T3,
ma, mf, are the same forGA and PS optimal results but ɤp, ɳic,
ɳit and T3 increased when compared to base results. Increase
in ɤp is by 6.78%, ɳic is by 1.8%, ɳit is by 0.13% while T3 is
by 19.64%. Increased ɤp results in higher thermal efficiency
for GA and PS results, while increase in ɳic guarantees less
energy destruction in the compressor [1, 16, 17] as shown in table 3 for both GA and PS results. Also, in table 4, mf and
ma values are the same for both GA and PS optimal results
but ma increases and ef decreases when compared to base
results. The increase in earesult is by 24.12% and mf is by
-0.57%. Reducedefand increase in ea contribute to the
reduction of total exergy destruction for both GA and PS results. Minimization of exergy destruction means maximization of energetic efficiency [18, 7, 5] as shown in table 3 for both GA and PS results.
As shown in table 4, the values of total exergy destruction cost rate, ( D) and total investment cost rate (lk) increases
slightly in PS results when compared to GA results. These show that GA is better than PS as an optimization tool.
4. Conclusion
The comparative analysis of the plant optimal operating parameters has been carried out using genetic and pattern search Algorithms. The optimal values as shown in table 3 show that ɤp, ɳic, ɳit, T3, ea, ef for GA and PS algorithms
increase from the base values by 6.78%, 1.8%, 0.13%, 19.64%, 24.12%, -0.57% respectively, but are the same for both algorithms. The total exergy destruction CD and total
investment cost rate lk for PS optimal results increase slightly
when compared to GA optimal results. These show that GA algorithm is a better optimization technique than PS algorithm. Genetic algorithm, however, uses large search space and many generations for optimization whereas pattern search find certain direction and comparatively less steps for solving the problem. Hence, in a machine related complicated problem, GA as an optimizing algorithm is preferable.
References
[1] Bejan, A., Tsatsaronis, G. and Moran, M. (1996).Thermal Design and Optimization.Wiley, New York.
[2] Coley, A. D. (1999); An Introduction to Genetic Algorithms for Scientists and Engineers, 2nd Edition, World Scientific Publishing Co. Pte. Ltd, Singapore, 211pp.
[3] Malhotra, R.; Singh, N. and Singh, Y. (2011); Genetic Algorithms: Concepts, Design for Optimization of Process Controllers, Computer and Information Science, Vol. 4, No. 2, pp. 39-54.
[4] Al-Sumait, J.S. Al-Othman A.K., Sykulski J.K. (2007). Application of Pattern Search Method to Power System Valve-Point Economic Load Dispatch. Journal of Electrical Power and Energy Systems. Pp 720-730.
[5] PHCN (2015); Ughelli Power Plant Logbook, Ughelli, Delta State, Nigeria.
[6] Obodeh, O. and Ugwuoke, P.E. (2017); Optimal Operating Parameters Of 100mw Delta IvUghelli Gas Turbine Power Plant Unit, in press.
[7] Moran, M. J. and Shapiro, H. (2000). Fundamentals of Engineering Thermodynamics, 4th Edition, Wiley, New York. [8] Khosravi, A.; Gorji-Bandpy, M. and Fazelpour, F. (2014);
Optimization of a Gas Turbine Cycle by Genetic and PSO Algorithms, Journal of Middle East Applied Science and Technology (JMEAST), Issue 21, pp. 706-711.
[9] Emefiele, G. (2016). MPR: Banks Raise Interest Rates on Existing Loans. Punch Newspapers, July 29.
[10] Moran, M. J. (1982). Availability Analysis; A Guide to Efficient Energy Use, USA: Prentice Hall, Englewood Cliffs, N.J. [11] Ebadi, M. and Gorji-Bandpy, M. (2005). Exergetic Analysis of
Gas Turbine Plants. International Journal of Exergy 2 (4), 31-39.
[12] Gorji-Bandpy, M. and Goodarzian, H. (2011). Exergoeconomic Optimization of Gas Turbine Power Plant Operating Parameters Using Genetic Algorithm: A Case Study. J Thermal Science, 15, 43-54.
[13] Kumar, M. and Guria, C. (2017). The elitist non-dominated sorting genetic algorithm with inheritance (i-NSGA-II) and its jumping gene adaptations for multi-objective optimization. Information Science, vol. 382-383, pp. 15-37.
[14] Goldberg DE. Genetic algorithms insearch,optimization, and machine learning. Reading, Mass, Harlow:Addison-Wesley;1989.
[15] MichalewiczZ.Geneticalgorithms+ datastructures= evolution programs. 3rd ed. Berlin, New York:Springer-Verlag;1996. [16] Jomison Janawitz, James Masso and Christopher Childs
(2015).Heavy-Duty Gas Turbine Operating and Maintenance Consideration Ger 3620M.GE Power and Water, Atlanta, Georgia, February.
[17] Ogbe, P. O.; Anosike, N. B. and Okonkwo, U. C. (2 Type equation here.016); Exergoeconomic Evaluation of Transcorp Power Plant Ughelli, International Research Journal of Engineering and Technology, Vol. 3, Issue 11, pp. 36-44. [18] Igbong, D. I. and Fakorede, D. O. (2014); Exergoeconomic