http://www.sciencepublishinggroup.com/j/ajp doi: 10.11648/j.ajp.20190503.24
ISSN: 2472-0887 (Print); ISSN: 2472-0909 (Online)
A Classification Model for Severity of Neonatal Jaundice
Using Deep Learning
Ngozi Chidozie Egejuru
1, Adanze Onyenonachi Asinobi
2, Oluwasina Adewunmi
3,
Temilade Aderounmu
4, Samuel Ademola Adegoke
5, Peter Adebayo Idowu
61Department of Computer Science, Hallmark University, Ijebu-Itele, Nigeria 2
Department of Pediatrics, College of Medicine, University of Ibadan, Ibadan, Nigeria 3
Tai Solarin University of Education, Ijebu Ode, Nigeria
4Department of Pediatrics and Child Health Care, Obafemi Awolowo University Teaching Hospital Complex, Ile-Ife, Nigeria 5
Department of Pediatrics and Child Health Care, Obafemi Awolowo University, Ile-Ife, Nigeria 6
Department of Computer Science and Engineering, Obafemi Awolowo University, Ile-Ife, Nigeria
Email address:
To cite this article:
Ngozi Chidozie Egejuru, Adanze Onyenonachi Asinobi, Oluwasina Adewunmi, Temilade Aderounmu, Samuel Ademola Adegoke, Peter Adebayo Idowu. A Classification Model for Severity of Neonatal Jaundice Using Deep Learning. American Journal of Pediatrics.
Vol. 5, No. 3, 2019, pp. 159-169. doi: 10.11648/j.ajp.20190503.24
Received: July 14, 2019; Accepted: August 5, 2019; Published: August 28, 2019
Abstract:
Neonatal jaundice is a yellowish discoloration of the white part of the eyes and skin in a newborn baby due to high bilirubin levels. An early diagnosis of the severity of neonatal jaundice using machine learning will decrease neonates’ likelihood of developing complications. The study elicited knowledge on the variables that are associated with the severity of neonatal jaundice and collected relevant data from a tertiary hospital in south-western Nigeria. The study formulated the predictive model for the severity of neonatal jaundice based on the variables identified using deep learning with multi-layer perceptron (MLP) classifier for varying number of epochs. The results of the study showed that using the deep learning with MLP classifier and 5 epochs had the lowest error rate however with the highest build time and provided a better model compared to the use of the other number of epochs. The study concluded that the using deep learning with MLP classifier and 5 epochs, the development of the classification model for the severity of neonatal jaundice patients receiving treatment was more effective due to its ability to understand the relationship between the attributes and their respective target class labels.Keywords:
Neonatal Jaundice, Fuzzy Model, Risk Classification, Risk Factors1. Introduction
Jaundice is a common disease in newborns babies with majority of cases due to the breakdown of red blood cells which release bilirubin into the blood alongside the immaturity of the liver to effectively metabolize the bilirubin and prepare it for excretion into the urine thus causing elevated levels of bilirubin. Neonatal jaundice is a yellowish discoloration of the white part of the eyes and skin in a newborn baby due to high bilirubin levels with symptoms including excess sleepiness or poor feeding while complications may include seizures, cerebral palsy, or kernicterus [1]. Pathologic jaundice occurs in babies when levels are greater than 308 µmol/L (18 mg/dL) and is noticed
followed up promptly [3].
Hyperbilirubinemia, the cause of jaundice, appears in approximately 60% of the newborns at term and almost in all preterm neonates, with prevalence greater than 80% [4]. In the vast majority of newborns, jaundice is a benign condition. However, an incorrect or delayed diagnosis may put newborns at risk of developing kernicterus [5]. Kernicterus is the chronic form of bilirubin encephalopathy and occurs when the deposition of bilirubin in the brain causes irreversible damage [6]. The correct identification of newborns at risk of developing severe hyperbilirubinemia and kernicterus is essential for early treatment. Therefore, preventing the newborn from toxic bilirubin levels, especially for their immature central nervous system, has become a main concern for pediatricians [7]. Assessing the risk of neonatal jaundice is currently done with the support of specific monograms that take into account the age of the newborns, the serum or transcutaneous bilirubin levels and associated risk factors [8]. Despite the use of different methodologies to assess the risk of developing neonatal hyperbilirubinemia, several studies pointed out a growing resurgence of bilirubin encephalopathy and kernicterus, identifying the need to improve diagnosis [9].
Using information about the modifiable risk factors and associated degree of Jaundice can assist in the detection of Jaundice among neonates thus reducing complications arising from the disease. Increasing number of newborn are being discharged from hospital within 48 hours after birth and with short post-natal hospital stay, jaundice may not be apparent at the time of hospital discharge [10]. Neonatal mortality rate was 48 per 1000 live births, 284000 newborns die annually at an average of 700 per day with neonatal deaths in Nigeria accounting for a quarter of under-five deaths since many babies arrive late in hospitals with kernicterus [11]. Early intervention plays a key role in the prevention of the adverse outcomes resulting from neonatal hyperbilirubinemia [12]. Early post-natal discharge from the hospital requires that parents should be able to recognize neonatal jaundice and seek prompt medical attention for it.
Data mining is one of the newest areas of computer science that uses various statistical techniques, databases, artificial intelligence and pattern recognition (one of the areas of machine learning) from data. The basis of the methodologies of data mining is its ability to find patterns and relationships within large quantities of data that can enable the construction of models that meet the task of assigning the class label at unlabeled cases, the combination of statistical methods and artificial intelligence to the management of databases [13]. Data mining techniques have thus successfully been applied in a variety of classification tasks [14]. By identifying hidden patterns, data mining can get information that allows a new perspective on certain diseases and to find knowledge that can foster more research in several areas of medicine. The high degree of accuracy of developed models is a good example of data mining's contribution to medicine [15]. In many areas of medicine, data mining has proven to be a huge added value by
contributing with new discoveries and improving the results obtained with other methodologies [16].
Machine learning techniques in addition to improvements in available computational control, have come to play a dynamic role in Big Data analytics and knowledge discovery in medical data [17]. In comparison to conventional learning methods, which are dependent on the use of shallow-structured learning architectures, deep learning refers to machine learning techniques that practice supervised and unsupervised approaches to spontaneously learn hierarchical representations in deep architectures for performing classification tasks more effectively [18]. Deep learning implemented successfully in industry domains that perform very well on an enormous amount of ordinal data [19]. Firms similar to MRIs, CT scans, and X-rays gather and explore massive volumes of images each and every day, violently insistent to deep learning associated projects. Due to the increasing number of patients’ data stored in clinical databases, there has been increasing demand for the application of deep learning algorithms for the extraction of relevant patterns from Big Data. This study presents a classification model for the severity of jaundice among neonates based on information about modifiable risk factors using deep learning. Therefore, there is a need for the development of a predictive model for the early detection of jaundice in neonates which is the focus of this paper.
2. Related Works
This section provides a review of related works in the subject area of knowledge discovery using data mining and deep learning. Among the related works, it was observed that deep learning algorithms were mostly applied for the extraction of complex unseen patterns from unstructured data (such as text-based, sound and video) and data of large sizes. Other works showed the advantage of adopting a neural network-based model for solving classification tasks in the medical domain. A number of such papers are presented in the following paragraphs.
In 2018, Balogun et al. [13], worked on the development of an ensemble model for the severity of sickle cell anemia among pediatrics patients in Nigeria. The study collected data from a tertiary hospital consisting of records of 115 pediatric sickle cell patients alongside the severity classified as either low, moderate and high risk cases. The ensemble model was formulated using a combination of C4.5 decision trees, support vector machine and naïve Bayes classifiers. The results showed that the best classification model for determining the severity of anemia among SCD patients was developed using an ensemble of DT and NB algorithms. The study was limited to the classification of the severity of sickle cell diseases among pediatrics.
survival based on identified variables. The model was formulated using the naïve Bayes’ classifier based on the 10-fold cross validation technique. The results showed 81.02% accuracy in the performance of the naïve Bayes’ classifier used in developing the predictive model for HIV/AIDS survival in pediatric patients. In addition, the area under the receiver operating characteristics (ROC) curve had a value of 0.933. The study was limited to the classification of HIV/AIDS survival among pediatrics.
In 2017, Purushothama et al. [21], worked on the application of deep learning models on large healthcare data. The study collected data for the study from the MMIC-III dataset for Intensive Care Unit (ICU) mortality of patients. The study adopted deep learning for the formulation of three (3) models which include: mortality prediction, forecasting length of stay and for ICD-9 cod group prediction using raw and processed datasets. The results of the study showed that deep learning models were showed a better performance using the datasets to develop the classification and regression models required for the study. The results also showed that deep learning algorithms however effective required more computational time for completing processes. The study was limited to the application of deep learning algorithm to the classification of neonatal mortality.
In 2017, Balajee and Sethumadahavi [22], worked on the application of deep learning for the processing of structured and unstructured data. The study collected medical data consisting of doctor’s reports, medical test results, medical images and genomics data which were pre-processed into structured datasets. The model was formulated using deep belief networks (DBN), convolution neural networks (CNN) and recurrent neural networks (RNN) using the collected dataset. The results of the study showed that using the different deep learning algorithms, a better accuracy compared to conventional techniques was achieved. The study was limited to the application of deep learning to the extraction of relevant patterns from medial data.
3. Materials and Methods
This section presents the materials and the methods that were adopted for the development of the classification model required for the classification of the severity of neonatal jaundice. The materials and methods adopted for data identification and collection, model formulation and simulation alongside performance evaluation were presented.
3.1. Method of Data Identification and Collection
Following the review of related works of literature in the body of knowledge of severity of liver disease and the variables related to determine severity of liver disease, a number of variables were identified. The identified variables for determining risk of jaundice were validated by a neonatologist interviewed with more than 10 years’ experience in medicine before the data was collected from the hospital located in the south-western part of Nigeria. For the purpose of this study, data was collected from 23
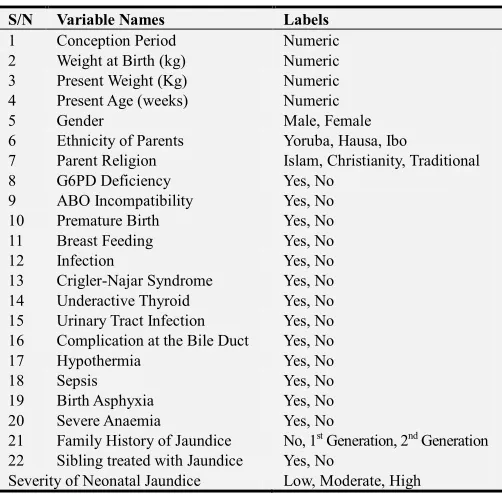
neonates at a hospital located in the south-western part of Nigeria from hospital case files. The information collected from the hospital was stored in a spreadsheet application – Microsoft Excel of the Microsoft Office 2013. Information collected from the neonates contained the explanatory variables for the diagnosis of jaundice as proposed by the cardiologist for each neonate. A description of the attributes contained in the dataset is presented in Table 1.
Table 1. Identified Variables for determining Jaundice.
S/N Variable Names Labels
1 Conception Period Numeric
2 Weight at Birth (kg) Numeric
3 Present Weight (Kg) Numeric
4 Present Age (weeks) Numeric
5 Gender Male, Female
6 Ethnicity of Parents Yoruba, Hausa, Ibo
7 Parent Religion Islam, Christianity, Traditional
8 G6PD Deficiency Yes, No
9 ABO Incompatibility Yes, No
10 Premature Birth Yes, No
11 Breast Feeding Yes, No
12 Infection Yes, No
13 Crigler-Najar Syndrome Yes, No
14 Underactive Thyroid Yes, No
15 Urinary Tract Infection Yes, No
16 Complication at the Bile Duct Yes, No
17 Hypothermia Yes, No
18 Sepsis Yes, No
19 Birth Asphyxia Yes, No
20 Severe Anaemia Yes, No
21 Family History of Jaundice No, 1st Generation, 2nd Generation
22 Sibling treated with Jaundice Yes, No
Severity of Neonatal Jaundice Low, Moderate, High
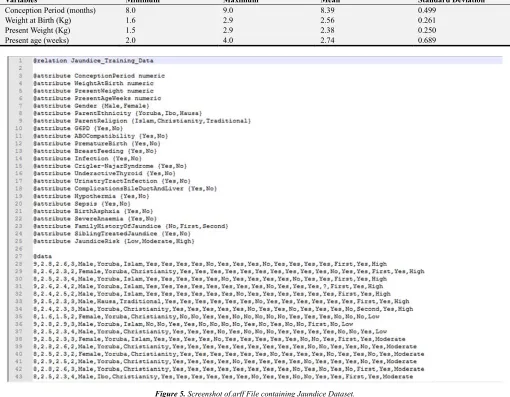
Following the collection of data from the 23 neonates alongside the attributes (22 risk factors) alongside the diagnosis of jaundice, the data collected was checked for the presence of error in data entry including misspellings and missing data. Following this process, there was no error in misspellings but there was missing data in the cells describing severe Anaemia for one record alone. The data was transformed into the attribute file format (.arff) for the purpose of the development of the predictive model for infertility risk using the simulation environment. The dataset collected for the purpose of the development of the predictive model for the diagnosis of jaundice was stored in.arff in the name Jaundice_Data.arff while the number of attributes listed in the attribute section were 23 including the target attribute. Following this, the values of the risk factors for the record of the 49 neonates considered for this study was provided.
3.2. Model Formulation of Classification Model
Cost functions are used by supervised machine learning algorithms to estimate the error in prediction during the training of data for model development. For any supervised machine learning algorithm proposed for the formulation of a predictive model, a mapping function can be used to easily express the general expression for the formulation of the classification model for the prediction of the severity of neonatal jaundice.
The historical dataset S which consists of the records of neonates containing fields representing the set of classification factors (i number of input variables for j patients), alongside the respective target variable (severity of neonatal jaundice) represented by the variable – the risk time of liver disease for the jth neonate in the j records of data collected from the hospital selected for the study. Equation (1) shows the mapping function that describes the relationship between the classification factors and the target class – severity of liver disease patients.
: → : (1)
The equation shows the relationship between the set of risk factors (input vector space) represented by a vector, X
consisting of the values of i variables and the label Y which defines the severity of neonatal jaundice for each neonate as expressed in equation (2). Assuming the values of the set of variable for a neonate is represented as
, , , . . . , where is the value of each variable, i = 1 to i; then the mapping used to represent the
predictive model for patient performance maps the variables of each individual to their respective severity of neonatal jaundice according to equation (2).
! "
# $% (2)
Multi-Layer Perceptron (MLP) Architecture
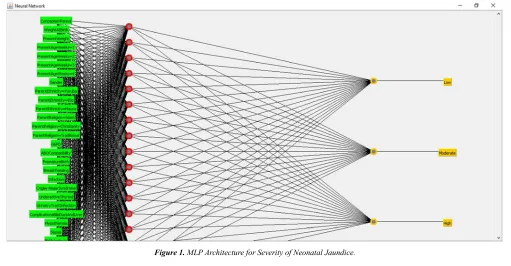
A Multi-Layer Perceptron (MLP) is a deep network of perceptrons (an interconnected group of nodes using synaptic weights) which is similar in topology to the network of neurons in a human brain. MLPs are presented as systems of interconnected neurons (containing activation functions) which send messages to each other such that each connection have numeric synaptic weights (having values between -1.0 to 1.0) that can be tuned based on experience (model learning) thus making neural nets adaptive to inputs and capable of learning unknown patterns from data. The word network refers to the inter-connections between the neurons located at different layers using synaptic weights as shown in Figure 1. The MLP propagated the sum of product of the weights w and the inputs (risk factors of severity of neonatal jaundice) i through nodes located at the input layer j. The sum of product of the values of the weight and inputs as expressed in equation (3) was used by the MLP to propagate successive sum of product of previous nodes to successive nodes all the way to the output node.
Figure 1. MLP Architecture for Severity of Neonatal Jaundice.
The output from successive hidden nodes were propagated using a sigmoid function to normalize the output into an interval of [0, 1] or [-1, 1] as expressed in equation (4).
& ∑(, ( )(* +( (3)
- & . /01 23 (4)
through the neural network using the training pattern target in order to generate deltas 4 of all output and hidden neurons using the gradient descent according to equation (5) while adjusting the weights as a function of the error determined at each node using equations (6) and (7). The process was
repeated for a number of training cycles for which the MLP network converged to a state where the error determined is small enough, then the MLP network was able to learn the target function.
4 57563 573
58093 :
-; < = . - " . >1 < - " .@ A B"=B" B! , ∑ 4CDE C - " . >1 < - " .@ A ! B!
(5)
56
5FG3 4 ) (6)
∆ <I5F56G3 (7)
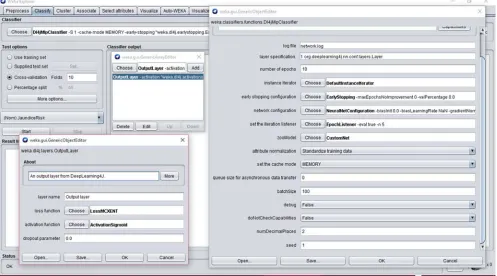
The algorithm for performing the classification model required for the severity of neonatal jaundice was done using the deep learning classification/regression using multi-layer perceptron made available on the Waikato Environment for Knowledge Analysis (WEKA) Simulation Environment. Figure 2 shows the interface of the properties of the algorithm using WEKA. The figure on the far-right shows the main properties of the algorithms while the two dialog boxes on the left (top and bottom) were needed for managing the layers of the MLP architecture. Following the management of the properties of the deep learning scheme, the properties of the MLP component was defined as shown in Figure 3. The specification of the MLP required the identification of the optimization algorithm which composed of variations of the gradient descent algorithms such as: linear-based, conjugate-based, stochastic-based etc.
3.3. Simulation of Classification Model
The dataset collected was divided into two parts: training and testing data – the training data was used to formulate the model while the test data was used to validate the model. The process of training and testing predictive model according to literature is a very difficult experience especially with the various available validation procedures. For this problem, it was natural to measure the model’s performance in terms of the error rate. The error rate being the proportion of errors made over a whole set of instances, and thus measured the overall performance of the classifier. The error rate on the training data set was not likely to be a good indicator of future performance; because the models were being learned from the very same training data. In order to predict the performance of the model on new data, there was the need to assess the error rate of the predictive model on a dataset that played no part in the formation of the model. This independent dataset was called the test dataset – which was a representative sample of the underlying problem as was the training data.
Figure 3. Interface for managing the Multi-Layer Perceptron (MLP) Component.
It was important that the test dataset was not used in any way to create the classifier since the machine learning classifiers involve two stages: one to come up with a basic structure of the predictive model and the second to optimize parameters involved in that structure. For this study the cross-validation procedure was employed, which involved dividing the whole datasets into a number of folds (or partitions) of the data. Each partition was selected for testing with the remaining k – 1 partitions used for training; the next partition was used for testing with the remaining k – 1 partitions (including the first partition used or testing) used for training until all k partitions had been selected for testing. The error rate recorded from each process was added up with the mean the mean error rate recorded. The process used in this study was the stratified 10-fold cross validation method which involves splitting the whole dataset into ten partitions.
3.4. Performance Evaluation for Validation of Classification Model
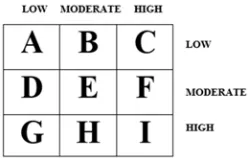
A confusion matrix is a square which shows the actual classification along the vertical and the predicted along the vertical a shown in Figure 4. All correct classifications lie
Figure 4. Diagram of a Confusion Matrix.
along the diagonal from the north-west corner to the south-east corner also called True Positives (TP) and True Negatives (TN) while other cells are called the False Positives (FP) and False Negatives (FN).
Correct classifications were plotted along the diagonal from the north-west position for low predicted as low (A), moderate predicted as moderate (E) and high predicted as high (I) on the south-east corner (all called true positives and negatives). The incorrect classifications were plotted in the remaining cells of the confusion matrix (also called false positives and negatives). Also, the actual low cases are A+B+C, actual moderate cases are D+E+F while actual high cases are G+H+I and the predicted low are A+D+G, moderate are B+E+H and predicted high are C+F+I. The developed model was validated a number of performance metrics based on the values of A – I in the confusion matrix for each predictive model. They are presented as follows.
a. Accuracy: the total number of correct classification
JKKB! KL M/O/P/Q/6/R/S/T/NM/6/N (8)
b. True positive rate (recall/sensitivity): the proportion of actual cases correctly classified.
UVCWF M/O/PM (9)
UVXWY0Z[90 Q/6/R6 (10)
UV\ ]\ S/T/NN (11)
^VCWF [_9`[CabcdefgdQ/S/[_9`[ChGih (12)
^VXWY0Z[90 [_9`[CjbkO/T/[_9`[ChGih (13)
^V\ ]\ [_9`[Cjbk/[_9`[CP/R abcdefgd (14)
d. Precision: the proportion of predictions that are correct
V! K CWF M/Q/SM (15)
V! K XWY0Z[90 O/6/T6 (16)
V! K \ ]\ P/R/NN (17)
Using the aforementioned performance metrics, the performance of the predictive model for the classification of student’s performance can be evaluated by validation using a historical dataset collected based on the information provided in the questionnaire. The TP rate and precision lie within the interval [0, 1], accuracy within the interval of [0, 100]% while the FP rate lies within an interval of [0, 1]. The closer the accuracy is to 100% the better the model, the closer the value of the TP rate and precision is to 1 the better while the closer the value of FP rate is to 0 the better. Therefore, the evaluation of an effective model has a high TP/Precision rates and a low FP rates.
4. Results
In this section of the study, the results of the
methodological approach described earlier are discussed. A thorough investigation into the analysis of the description of the dataset collected was initially performed in order to understand the distribution of the values of the variables among the patients selected for this study using the minimum and maximum values, and the mean and standard deviation of the data distribution. Following this, the results of the model formulation and simulation process for the development of the classification model for the severity of neonatal jaundice was presented. The performance of the predictive models developed using deep learning was evaluated in order to identify the most effective and efficient predictive model for the severity.
4.1. Results of the Identification and Collection of Variables
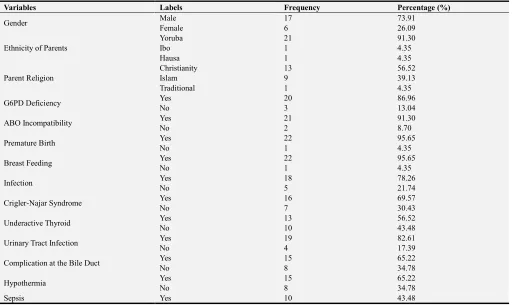
The analysis of the data containing information about the attributes for the 49 neonates are shown in Tables 2 and 3. Table 2 shows the description of the nominal variables while Table 3 shows the distribution of the numeric variables. From the description shown in Table 2, the result of the data collection showed that there were more male than there were female neonates with a ratio of about 3 female to 1 male respectively whom were majorly of Yoruba ethnicity and Christian religion. Majority of the neonates were observed to have G6PD deficiency, ABO incompatibility, were breast fed by mothers regularly, had some form of infection/syndrome, UTI, complications on bile duct, hypothermia, severe anaemia, siblings with aneamia and family history of jaundice.
Table 2. Description of the Nominal Variables in the Dataset.
Variables Labels Frequency Percentage (%)
Gender Male 17 73.91
Female 6 26.09
Ethnicity of Parents
Yoruba 21 91.30
Ibo 1 4.35
Hausa 1 4.35
Parent Religion
Christianity 13 56.52
Islam 9 39.13
Traditional 1 4.35
G6PD Deficiency Yes 20 86.96
No 3 13.04
ABO Incompatibility Yes 21 91.30
No 2 8.70
Premature Birth Yes 22 95.65
No 1 4.35
Breast Feeding Yes 22 95.65
No 1 4.35
Infection Yes 18 78.26
No 5 21.74
Crigler-Najar Syndrome Yes 16 69.57
No 7 30.43
Underactive Thyroid Yes 13 56.52
No 10 43.48
Urinary Tract Infection Yes 19 82.61
No 4 17.39
Complication at the Bile Duct Yes 15 65.22
No 8 34.78
Hypothermia Yes 15 65.22
No 8 34.78
Variables Labels Frequency Percentage (%)
No 13 56.52
Birth Asphyxia Yes 21 91.30
No 2 8.70
Severe Anaemia
Yes 16 69.56
No 6 26.09
Missing 1 4.35
Family History of Jaundice
No 10 43.48
First Generation 12 52.17
Second Generation 1 4.35
Sibling treated with Jaundice Yes 20 86.96
No 3 13.04
The results of the descriptive statistics of the four (4) numeric features was done for neonates aged 8 and 9 months (32 to 36 weeks) based on the identification of the minimum, maximum, mean and standard deviation. The results showed that the weight at birth of neonates was lesser compared to their present weight with a mean age of birth of 2.56 kg and a
mean present age of 2.38 kg. Also, it was observed that there was the maximum weight of neonates at birth and present was 2.9 kg while the minimum weights were 1.6 kg at birth and 1.5 kg at present. Figure 5 shows a diagram of the arff file for the new training data stored in the file Jaundice_training_data.arff.
Table 3. Description of the numeric variables in the dataset.
Variables Minimum Maximum Mean Standard Deviation
Conception Period (months) 8.0 9.0 8.39 0.499
Weight at Birth (Kg) 1.6 2.9 2.56 0.261
Present Weight (Kg) 1.5 2.9 2.38 0.250
Present age (weeks) 2.0 4.0 2.74 0.689
Figure 5. Screenshot of.arff File containing Jaundice Dataset.
4.2. Results of Formulation and Simulation of Classification Model
Following the simulation of the predictive model for the
classifier, the simulation using the 10-fold cross validation process was repeated for 5, 10, 15, 20, 25, 30, 35, 40, 45 and 50 epochs with the build time and mean absolute error of the model observed.
Table 4. Simulation Build Time (in seconds) and Mean Absolute Error
(MAE).
Number of epochs Build time (s) Mean Absolute Error (MAE)
5 epochs 4.87 0.3889
10 epochs 1.05 0.3905
15 epochs 0.92 0.3916
20 epochs 0.72 0.3923
25 epochs 0.92 0.3929
30 epochs 1.15 0.3934
35 epochs 1.09 0.3938
40 epochs 1.30 0.3941
45 epochs 1.33 0.3944
50 epochs 1.47 0.3947
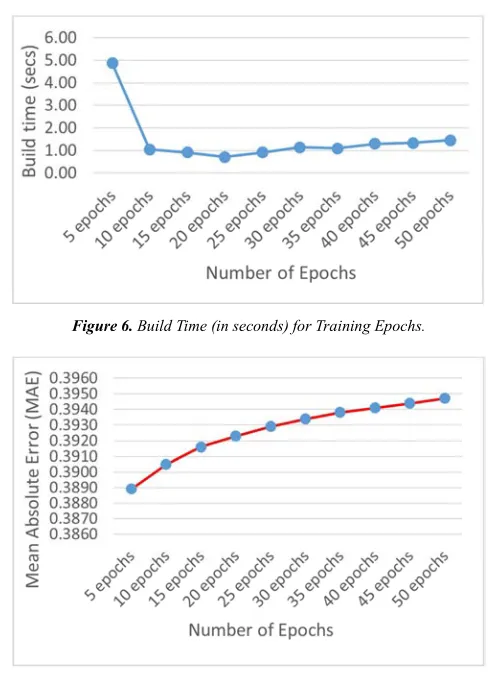
The results showed that the model with the best performance required for the classification of the severity of neonatal jaundice was done using 5 epochs however with the longest build time. As observed from Table 4, the results of the build time shown in Figure 6 presents a steady decrease in the build time of the model from epoch 5 (with 4.87s) to epoch 20 (with 0.72s) and with a steady increase to a value of 1.47s for the 50th epoch. Figure 7 also shows that during the model building, the lowest MAE was recorded for the 5th epoch which increased from a value of 0.3889 to 0.3947 at the 50th epoch.
Figure 6. Build Time (in seconds) for Training Epochs.
Figure 7. Mean Absolute Error (MAE) for Training Epochs.
Figure 9. Results of Model Testing during Validation.
4.3. Results of Validation of Model
Following the process of model building using the 10-fold cross validation technique, the dataset was also applied upon by the deep learning with MLP classifier for the purpose of validating the classification model based on the simulated model. The model validation process showed that out of the 23 datasets, the model was able to correctly classify 13 out of the 23 instances such that 3 were Low cases, 8 were Moderate cases and 2 were High cases. Figure 8 shows the screenshot for the plot of the correct and incorrect classification. Figure 9 (left) shows the correct classifications as crosses while misclassifications were presented using boxes such that blue colour for Low cases, Red colour for Moderate cases and Green colour for High cases.
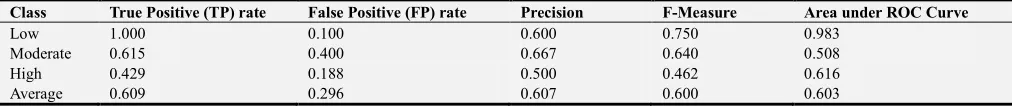
Table 5. Results of the Validation of Model.
Class True Positive (TP) rate False Positive (FP) rate Precision F-Measure Area under ROC Curve
Low 1.000 0.100 0.600 0.750 0.983
Moderate 0.615 0.400 0.667 0.640 0.508
High 0.429 0.188 0.500 0.462 0.616
Average 0.609 0.296 0.607 0.600 0.603
According to the results presented in the confusion matrix shown in Figure 8 (right), the results showed that all the Low cases were correctly classified; 8 out of the 14 actual moderate cases were correctly classified while 2 and 3 were incorrectly classified as low and high cases respectively; while 3 out of the 7 actual high cases were correctly classified with 4 misclassified as moderate cases. Overall, there were 14 correct classifications out of 23 owing for an accuracy of 60.9%.
5. Discussions
The results of evaluation of the performance of the deep learning with MLP classifier based on the 5 epochs used in this study for the development of the classification model for the severity of neonatal jaundice diseases is shown in Table 5. The evaluation was done using metrics such as the TP rate which provides the proportion of actual cases correctly classified hence the higher the better; the FP rate which gives the proportion of a class misclassified as another hence the lower the better and the precision which gives the proportion of the prediction that are correct hence the higher the better. The results showed that the performance of the deep learning with MLP classifier using 5 epochs was better than using the other epochs from 10 to 50 based on the 10-fold cross validation technique. The results also showed that the lower values for the MAE were reflected in the value of the accuracy of the model based on its ability to correctly classify the severity of neonatal jaundice. The results further showed that the deep learning with MLP classifier using 5 epochs had the lowest TP rate for the high cases however was able to identify all low cases and 61.5% of moderate cases. The results also showed that the deep learning with MLP classifier using 5 epochs had the lowest FP rates for the low and high cases while the highest rates was observed in
moderate cases showing that 40% of low and high cases were misclassified as moderate cases. The highest value for the area under the ROC was observed for the low cases owing to high TP and low FP rates followed by high cases with moderate TP rate and low FP rate while the lowest value was reported for moderate cases with moderate TP and FP rates.
6. Conclusion
the real-time assessment of clinical information affecting the risk of Kernicterus and liver disease among patients.
References
[1] Ferreira, D., Oliviera, A. & Freitas, A. (2012). Applying Data Mining Techniques to improve Diagnosis in Neonatal Jaundice. BMC Medical Informatics and Decision Making 12
(143): 1-6.
[2] Egube, B. A., Ofili, A. N. and Onakewhor, J. U. (2013). Neonatal Jaundice and its management: Knowledge, attitude, and practice among expectant mothers attending antenatal clinic at University of Benin teaching Hospital, Benin City, Nigeria. Nigerian Journal of Clinical Practice 16 (2): 188-194.
[3] Coleman, R. (2011). Newborn Jaundice and Vitamin D. Retrieved from http://www.livestrong.com/article/532575-newbornjaundice-vitamin-d/#ixzz2a3FMIuBl on March 21, 2017.
[4] Rennie, J., Burman-Roy, S. & Murphy, M. S. (2010). Neonatal jaundice: summary of NICE guidance. BMJ 340: 1-13.
[5] De Luca D. (2010). NICE Guidelines on Neonatal Jaundice: at Risk of Being Too Nice. Lancet. 376 (9743): 771.
[6] Besser, I., Perry, Z. H., Mesner, O., Zmora, E. & Toker, A. (2010). Yield of recommended blood tests for neonates requiring phototherapy for hyperbilirubinemia. Israeli Medical Association Journal 12 (4): 220-224.
[7] Randev, S. & Grover, N. (2010). Predicting neonatal hyperbilirubinemia using first day serum Bilirubin levels.
Indian Journal of Pediatrics 77 (2): 147–150.
[8] Bhutani, V. K., Vilms, R. J. & Hamerman-Johnson, L. (2010). Universal Bilirubin screening for severe neonatal hyperbilirubinemia. Journal of Perinatology 30 (supplementary): S6–S15.
[9] Burke, B. L., Robbins, J. M., Bird, T. M., Hobbs, C. A., Nesmith, C. & Tilford, J. M. (2009) Trends in hospitalizations for neonatal jaundice and kernicterus in the united states, 1988–2005. Journal of Pediatrics 123 (2): 523–532.
[10] Zupan, J. (2005). Prenatal mortality in developing countries. N Engl J Med 352: 2047-2048.
[11] Ogunfowora, O. B., Adefuye, P. O. and Fetuga, M. B. (2006). What do expectant mothers know about neonatal jaundice?
International Electronic Journal of Health Education 9: 134-140.
[12] Ezechukwu, C. C., Ugochukwu, E. F., Egbuonu, I. and Chukwuka, J. O. (2004). Risk factors from neonatal mortality in regional tertiary hospital in Nigeria. Niger J Clin Pract 7: 50-52.
[13] Balogun, J. A., Aderounmu, T., Egejuru, N. C. & Idowu, P. A. (2018). An Ensemble Model of Machine Learning Algorithms for the Severity of Sickle Cell Disease (SCD). Computer Reviews Journal 2: 331-346.
[14] Idowu, P. A., Aladekomo, T. A., Williams, K. O., Balogun, J. A. (2015). Predictive Model for Likelihood of Survival of Sickle Cell Anaemia (SCA) among Pediatric Patients using Fuzzy Logic. Journal of Transactions on Networks and Communications 3 (1): 31-44.
[15] Idowu, P. A., Aladekomo, T. A., Williams, K. O., Balogun, J. A. (2015). Breast Cancer Risk Prediction using Data Mining Classification Techniques. Journal of Transactions on Networks and Communications 3 (1): 1-11.
[16] Idowu, P. A., Aladekomo, T. A., Agbelusi, O., Alaba, O. B. & Balogun, J. A. (2017). Survival Model for Pediatric HIV/AIDS Patient using C4. 5 Decision Tree Algorithm.
International Journal of Child Health and Human Development 10 (2): 143-155.
[17] Chen, H. Y., Chuang, C. H., Yang, Y. J. and Wu, T. P. (2011). Exploring the risk factors of preterm birth using data mining.
Expert Syst Appl 38 (5): 5384-5387.
[18] Gu, J., Wang, Z., Kuen, J., Ma, L., Shahroudy, A., Shuai, B., Wang, G. (2015). Recent Advances in Convolutional Neural Networks. arXiv, 1–14.
[19] Najafabadi, M. M., Villanustre, F., Khoshgoftaar, T. M., Seliya, N., Wald, R., & Muharemagic, E. (2015). Deep learning applications and challenges in big data analytics.
Journal of Big Data 2 (1): 1-13.
[20] Idowu, P. A., Aladekomo, T. A., Agbelusi, O., Alaba, O. B. & Balogun, J. A. (2017). Prediction of Pediatric HIV/AIDS Survival in Nigeria using Naïve Bayes’ Approach.
International Journal of Child Health and Human Development 10 (2): 131-142.
[21] Purushothama, S., Meng, C., Che, Z. & Liu, Y. (2017). Benchmark of Deep Learning Models on Large Healthcare MIMIC Datasets. Journal of Biomedical Informatics 23: 1-13. [22] Balajee, J. & Sethumadahavi, R. (2017). Big Data Deep Learning in Healthcare for Electronic Health Records.