INTERNATIONAL JOURNAL OF PHARMACEUTICAL, CHEMICAL AND BIOLOGICAL SCIENCES
Available online at www.ijpcbs.com
FORMULATION DEVELOPMENT AND EVALUATION OF FAST
DISSOLVING ACECLOFENACTABLETS PREPARED BY SOLID
DISPERSION BY USING MANNITOL
M. Ratnaparkhi* and R. Dhomse
Marathwada Mitra Mandal’s College of Pharmacy, Kalewadi, Pune, Maharashtra, India.
INTRODUCTION
Aceclofenac is new nonsteroidal anti-inflammatory drug acting by an inhibition of the synthetic of prostaglandins by inhibiting the activity of the enzyme, cyclooxygenase-21,2,3(COX-2). It is more selective for COX –2 than COX-14. Aceclofenac is preferred over covnetional NSAIDs as they may lead to serious gastrointestinal complications such as ulcer, severe bleeding and perforation,
resulting in hospitalization and even death5.
It is mainly used for the osteoarthritis,
rheumatoid arthritis and dysmenorrhea6.
The drug is available in tablets dosage form and is yet not official in any pharmacopoeia
except B.P. Aceclofenac is practically insoluble in water and peak blood level rechease between 1.25 to 3 hrs after oral administration. It is practically insoluble in aqueous fluids.
The rate and extent of dissolution of the
drug from any solid dosage form
determines the rate and extent of absorption of the drug. In the case of poorly water-soluble drugs, dissolution is the rate-limiting step in the process of drug absorption. Potential bioavaibility problems are prevalent with extremely hydrophobic drugs (aqueous solubility less than 0.1
mg/ml at 37o C) due to erratic or
Research Article
ABSTRACT
Aceclofenac is new nonsteroidal anti-inflammatory drug acting by an inhibition of the synthetic of prostaglandins by inhibiting the activity of the enzyme, cyclooxygenase-2(COX-2). It is more selective for COX –2 than COX-1. Aceclofenac is practically insoluble in water and peak blood level rechease between 1.25 to 3 hrs after oral administration. It is practically insoluble in aqueous fluids. In the case of poorly water-soluble drugs, dissolution is the rate-limiting step in the process of drug absorption.The solid dispersion approach has been widely and successfully applied to improve the solubility, dissolution rates and consequently the bioavailability of poorly water-soluble drugs. To improve the dissolution of aceclofenac through the formulation of solid dispersion using water soluble carriers like mannitol by melt solvent methods and to convert the optimized solid dispersion in fast dissolving tablet formulation. The formulated tablets showed rapid in vitro drug dissolution and dissolution efficiency within 30 min.
incomplete absorption from
gastrointestinal tract (GIT)7. The solid
dispersion approach has been widely and successfully applied to improve the
solubility, dissolution rates and
consequently the bioavailability of poorly water-soluble drugs. Numbers of drug have been shown to improve their dissolution
character when converted to solid
dispersion8-12. Some reports on the
formulation of these systems have
appeared13. Because of its poor aqueous
solubility Aceclofenac may pose dissolution related absorption probem. In context of the above principles, a strong need is felt to developed a solid unit dosage form that deliver aceclofenac in the GIT in a form that dissolve very rapidly to reduce its onset time to produce quick pharmacological effect.
Thus an attempt is made in the present investigation to improve the dissolution of aceclofenac through the formulation of solid dispersion using water soluble carriers like mannitol and by melt solvent and solvent evaporation methods and to convert the optimized solid dispersion in fast dissolving tablet formulation.
Fast dissolving drug delivery system A fast dissolving drug delivery system (FDDDS) can be defined as a dosage form for oral administration, which when placed in mouth, rapidly disintegrates or dissolves and can be swallowed in the form of liquid. Conventional dosage form is very popular in pharmaceutical industries because of its easy transportation and low manufacturing cost. However for pediatrics and geriatrics fast dissolving tablet is preferred due to its
swallowing conveniences.22
Advantages of fast dissolving drug delivery system
It offer ease of administration for pediatrics, geriatrics, mentally ill, and uncooperative. It require no water intake
It shows quick disintegration and
dissolution of the dosage form.
It overcomes unacceptable taste of the drugs.
It can be designed to leave minimal or no residue in the mouth after administration and also to provide a pleasant mouth feel.
Introduction to Solid dispersion system24
It is defined as a dispersion of one or more active ingredients in an inert carrier or matrix at solid state prepared by the melting, solvent or melting solvent method. The solid dispersion may also be called solid-state dispersion. Dispersion obtained through the fusion process is often called melts and those obtained by the solvent method are frequently referred to as coprecipitates or coevaporates. The two basic procedures used to prepare solid dispersion the fusion and cosolvent techniques. Modification of these method and combination of them has also been used.
Method of solid dispersion preparation25
Solid dispersion can be prepared by different method based on the physical properties and thermal stability of the drug and the carriers.
Melting or fusion method
A physical mixture of an active agent and a water-soluble carrier is heated until it is melted. The melt is rapidly solidified in ice bath under rigorous stirring. The fused mass is then pulverized and sieved. Rapid congealing is desirable because it results in super saturation of drug as a result of entrapment of solute molecules in the
solvent matrix by instantaneously
solidification. The solidification process can be achieved on stainless steel plates attached to a cooling system to favor rapid heat loss. Spray congealing from a modified spray drier onto a cold metal surface has also been used. Product from spray congealing can be obtained in pellet form without the necessity of a grinding step that may alter crystalline modification.
Solvent method
Physical mixture of two solid components is dissolved in a common solvent and then the solvent is usually removed by evaporation
under reduced pressure at varying
precipitation is a recognized technique for increasing the dissolution of poorly
water-soluble drugs such as Ketoprofen,
spironolactone, nifedipine, so as to
consequently improve their bioavailability. Melting-solvent method
It has found that 5-10 % w/w of liquid compound could be incorporated in PEG 6000 without significant loss of its solid properties. Hence it is possible to prepare solid dispersion by first dissolving drug in a suitable solvent and then the solution is incorporated directly into the melt of PEG
(70 0 C) without removing the liquid
solvent.
MATERIALS AND METHODS
Determination of UV absorption maxima Aceclofenac solution was prepared in phosphate buffer pH 6.8 and diluted suitably. The UV spectrum of the solution was taken on Shimadzu UV-1601 UV/Vis double beam spectrophotometer. The solution exhibited UV maxima at 275.0 nm as shown in figure 1.1.
Preparation of calibration curve
Accurately weighed 10 mg of aceclofenac was transferred to a 100 ml volumetric flask and dissolved in 60 ml phosphate buffer pH 6.8. The volume was adjusted to the mark with phosphate buffer pH 6.8 to prepare stock solution (0.1 mg/ml). Aliquots of working solution of aceclofenac (0.5 – 3 ml, 100 μg/ml) were transferred in to a series of 10 ml volumetric flasks and volume was made up to the mark with phosphate buffer pH 6.8. The absorbance of the resulting solution were measured at 275.0 nm against a reagent blank solution prepared similarly without drug using
Shimadzu UV/ Vis double beam
spectrophotometer. Calibration curve was prepared by plotting concentration versus absorbance.
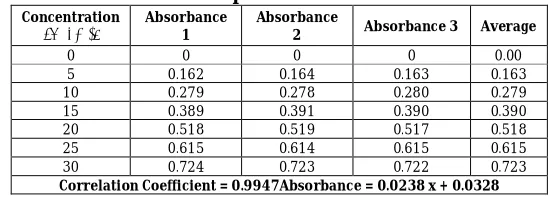
The method was validated for linearity, accuracy and precision. The method obeys Beer-Lambert’s law in the concentration range of 5–30 μg/ml. The results of standard curve preparation are shown in Table 1.1 and Figure 1.2.
Preparation of solid dispersion of aceclofenac with carriers
Solid dispersion containing aceclofenac and carrier in the proportion of 1:1, 1:2, 1:3, and 1:4 were prepared by melt solvent.Solid dispersion of drug with mannitol was prepared by melt solvent method. In this method, aceclofenac was dissolved in acetone and the solution was incorporated into the melt of mannitol at 1650 C by pouring into it. It was kept in an ice bath for sudden cooling. The mass was kept in the desiccators for complete drying. The solidified mass was scrapped, crushed, pulverized and passed through 80. All the solid dispersion was preserved in well-closed glass container till use.
Infrared absorption spectroscopy
Infrared absorption spectroscopy (IR) spectra of aceclofenac (fig.1.3), mannitol (fig 1.4), and solid dispersion of aceclofenac and mannitol (fig.1.5) are shown. Infrared absorption spectroscopy (IR) of aceclofenac showed sharp band at 3319,3278 and 1770 cm-1 due to stretching vibration bands of OH, NH, and C=O, respectively. Solid dispersion (SD) prepared using solvent evaporation method at 1:3 ratio showed decrease in intensity and shift to higher
wave number for 3319 and 3270 cm-1. This
finding suggested that there might be a short of molecular interaction of the drug and mannitol in SD.Formulations of tablets of aceclofenac-mannitol by solid dispersion given in Table 1.2
Cumulative percentage of aceclofenac release from formulated tablets with Mannitolgiven in Table 1.3,In vitro release profile of aceclofenac from formulated tablet with mannitolgiven in Figure 1.6. Tablets formulations were developed from aceclofenac – mannitol solid dispersion (1:4) that has shown maximum in vitro dissolution rate. But there is minor difference in dissolution rate between solid dispersion (1:4) and (1: 3).Croscarmellose sodium used as a disintegrating agent.
sodium lauryl sulphate (1%) and
equal proportion. All the ingredients were mixed intimately and the mixture was compressed into tablets (500mg weight) on a rotary tablet machine.The formulated tablets were stored in a tightly closed glass container and evaluated for various characteristics.
Evaluation of solid dispersion tablets Compressed tablets were then evaluated for hardness15, disintegration16, friability17 and drug content. Monsanto types hardness tester measured hardness. One tablet was placed in each tube of disintegration apparatus (model ED, Electrolab) media at
37 ± 20 C. Friability was determined in
friabilator by taking twenty tablets. For drug content analysis twenty tablets were accurately weighed and finely powdered. Quantity of powder equivalent to 100 mg of aceclofenac was taken into a 100 ml volumetric flask and dissolved in phosphate buffer pH 6.8. 5 ml of the filtrate was diluted to 100 ml with phosphate buffer pH6.8. and assayed for drug content at 275.0 nm using double beam UV / Vis. Spectrophotometer (Shimadzu, model – 2201). The average drug content of the tablets found was 102 ± 0.2%. Table (1.4) shows the evaluation of tablets of aceclofenac.Results of formulated aceclofenac tablets batch S4 given in Table 1.4.
In vitro dissolution study of aceclofenac tablets
In vitro dissolution study of tablets18, 19 was conducted using USP dissolution apparatus II (model TDT-06T, Electolab) at 50 rpm, using phosphate buffer pH 6.8 as a dissolution media maintaining at 37 ± 0.50 C. Sample were withdrawn 5 ml, at 5 min. intervals to 30 min. and filtered through a filter paper, diluted and assayed at 275 nm using UV/ Vis double beam spectrometer. Comparison of prepared aceclofenac tablet with marketed tablets
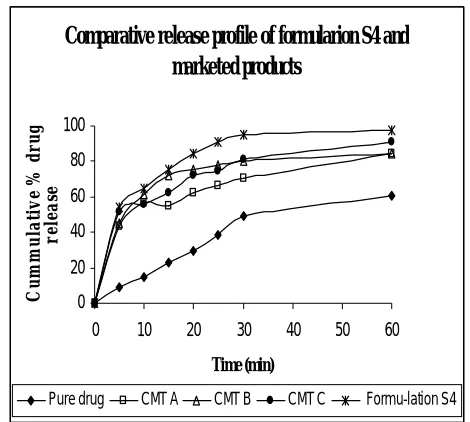
The developed tablet formulation was compared with conventional market tablet for in vitro drug release profile and % dissolution efficiency20. Percentage of drug dissolved in 30 min (Q30) and dissolution
efficiency after 30 min (DE30) were consider
for comparison. Results are shown in Table 1.5. The in vitro release profile of batch S4 was compared with conventional market tablet (CMT) for similarity factor (f2) and dissimilarity factor21 (f1). The data are shown in table 1.6.
RESULT AND DISCISSION Results of analytical method
Aceclofenac solution exhibited UV maxima at 275.0 nm as shown in Figure 1.1 Developed method was validated for linearity, accuracy and precision. The method obeys Beer-Lambert’s law in the
concentration range of 5 – 30 μm with a
correlation coefficient of 0.9947 (Table 1.1)
indicating good linearity in this
concentration range. The proposed method is simple, sensitive, accurate and precise and can be employed as a quality control tool for the estimation of aceclofenac in its tablets and in bulk drug.
Results of in vitro dissolution study of the prepared tablets
Table 1.3 show the cumulative percentage of aceclofenac released from formulations. It is clear that the dissolution of aceclofenac has improved considerably in mannitol using formulation. The poor dissolution of pure drug could be due to poor wettability and / or agglomeration of particles. Figure 1.6 shows the in vitro release profile of
aceclofenac from mannitol using
Results of evaluation of formulated tablets
Compressed tablets were evaluated for hardness, disintegration, friability and drug content (Table 1.4). Mean hardness and mean disintegration time of the tablets was
found to be 3 Kg/cm3 and 15 sec
respectively. Percentage friability and % assay were found 0.42 and 102.8 ± 0.2, respectively and were within the acceptable limit.
Result of comparison of prepared aceclofenac tablets with marketed tablets
The developed tablet formulation
(formulation S4) was compared with conventional market tablet (CMT A), (CMT B), and (CMT C) tablet for in vitro drug
release profile (Q30) and % dissolution
efficiency (DE30). The Q30 values of
conventional marketed tablet (CMT A), (CMT B), (CMT C) and formulation S4 were 49.31, 70.47, 8046, 81.42 and 95.32
respectively. (Table 1.5, figure 1.7)
indicating betterness of formulation S4. The
DE30 values were 23.17, 53.13, 62.26, 59.50
and 69.79 respectively. (Table 1.5, figure 1.7) indicating betterness of formulation S4. The in vitro release profile of formulation S4 was compared with conventional market tablet (CMT A), (CMT B), and (CMT C) for
similarity factor (f2) and dissimilarity factor (f1). The values for f1 for (CMT A), (CMT B), and (CMT C) are 21.94, 11.33, and 13.07 respectively and f2 for (CMT A), (CMT B), and (CMT C) are 36.33, 49.77 and 47.09 (Table 1.6) indicating no similarity in in vitro dissolution of formulation S4 with (CMT A), (CMT B), and (CMT C). There for formulation S4 was considered better cost effective formulation with higher and rapid in vitro dissolution.
CONCLUSION
The study demonstrates the preparation of
fast dissolving aceclofenac tablets
containing its solid dispersion by using mannitol as a carrier. The polymer used in the solid dispersion and its concentration had significant effect on the in vitro dissolution of the drug from solid dispersion. The formulated tablets showed rapid in vitro drug dissolution and dissolution efficiency within 30 min. The developed tablets were able to produce rapid onset of action of the drug with reasonable cost.
ACKNOWLEDGEMENTS
Authors are thankful to principal and
management, MarathwadaMitraMandal’s
college of pharmacy, Pune, India for providing facility for this work.
Table 1.1: Data for calibration curve of aceclofenac in phosphate buffer pH 6.8 at 275 nm
Concentration (μg/ml)
Absorbance 1
Absorbance
2 Absorbance 3 Average
0 0 0 0 0.00
5 0.162 0.164 0.163 0.163
10 0.279 0.278 0.280 0.279
15 0.389 0.391 0.390 0.390
20 0.518 0.519 0.517 0.518
25 0.615 0.614 0.615 0.615
30 0.724 0.723 0.722 0.723
Table 1.2: Formulations of tablets of Aceclofenac-mannitol by solid dispersion Ingredients in (mg) S1 S2 S3 S4 S5
Aceclofenac 100 100 100 100 100
Mannitol - 100 200 300 400
Hydroxypropyl cellulose 50 50 50 50 50
Croscarmellose sodium 30 30 30 30 30
Magnesium stearate 5 5 5 5 5
Sodium lauryl sulphat 5 5 5 5 5
Lactose monohydrate 310 210 110 10 10
Total 500 500 500 500 600
Table 1.3: Cumulative percentage of Aceclofenac release from formulated tablets with Mannitol
No Time (min) S1 S2 S3 S4 S5
1 0 0 0 0 0 0
2 5 8.7 14.86 31.99 53.73 55.43
3 10 14.96 25.43 40.66 64.92 67.58
4 15 22.76 36.97 51.13 75.65 74.94
5 20 29.1 46.45 62.66 84.23 85.03
6 25 38.87 55.85 66.55 91 92
7 30 49.31 61.18 77.48 94.82 96.58
8 60 61 76.96 85.87 97.91 98.74
Table 1.4: Results of formulated Aceclofenac tablets batch S4 S.No Evaluation parameters Results
1 Mean hardness (Kg / cm2) 3.0
2 Mean disintegration time (sec) 15
3 Friability % 0.42
4 Assay % 102 ± 0.2
Table 1.5: Comparison of formulation S4 with marketed aceclofenac tablets
Product
% Drug release After 30 min
(Q30)
% Dissolution efficiency After 30 min (DE30)
Pure drug 49.31 23.17
Market product (CMT) A 70.47 53.13
Market product (CMT) B 80.46 62.26
Market product (CMT) C 81.42 59.50
Formulation S4 95.32 69.79
DE30: Dissolution efficiency after 30 min.CMT A: is a conventional market tablet from
Medley pharmaceutical Ltd CMT B: is a conventional market tablet from IPCA pharmaceutical LtdCMT C: is a conventional market tablet from Intas pharmaceutical
Table 1.6: Cumulative % drug release of batch (S4) and marketed product
Fig. 1.1: UV spectrum of aceclofenac
Fig. 1.2: Calibration curve of aceclofenac in phosphate buffer pH 6.8 in phosphate buffer pH 6.8
y = 0.023x + 0.032 R² = 0.994
0 0.1 0.2 0.3 0.4 0.5 0.6 0.7 0.8
0 10 20 30 40
A
b
so
rb
a
n
ce
Concentration
Time (min) Formulation S4 CMT A CMT B CMT C
0 0 0 0 0
5 53.73 43.18 45.45 51.5
10 64.92 56.52 61.68 55.85
15 75.65 54.87 72.34 62.14
20 84.23 62.65 75.78 71.89
25 91 66.36 78.11 74.94
30 94.82 70.47 80.46 81.42
60 97.91 84.83 84.72 90.98
Similarity factor (f2)
Dissimilarity factor (f1)
36.33 21.94
49.77 11.33
47.09 13.07 CMT A: is a conventional market tablet from Medley pharmaceutical LtdCMT B:
Fig. 1.3: Infrared spectra of aceclofenac
Fig. 1.4: Infrared spectra of mannitol
Fig. 1.6: In vitro release profile of aceclofenac from formulated tablet with mannitol
Fig. 1.7: In vitro release profile of aceclofenac from formulation S4 and marketed product
REFERENCES
1. Ormod D, Wellington K and
Wagstaff AJ. Drugs. 2002;62:2059. 2. Fricker J, Varkalis J, Zwillich S, Adler
R, Forester E, Recker DP and
Verburg KM, Amer J Ther.
2002;9:89.
3. Dannhardt G and Kiefer W. Eur J
Med Chem. 2001;36:109. In vitro release profile of Aceclofenac from
formulated tablets with mannitol
0 20 40 60 80 100
0 10 20 30 40 50 60
Time (min)
C
u
m
u
la
ti
v
e
%
d
r
u
g
re
le
a
se
S1 S2 S3 S4 S5
Comparative release profile of formularion S4 and
marketed products
0 20 40 60 80 100
0 10 20 30 40 50 60
Time (min)
C
u
m
m
u
la
ti
v
e
%
d
r
u
g
r
e
le
a
se
4. McMurray RW and Hardy KJ. Amer J Med Sci. 2002;323:181.
5. Baker DE. Rev Gastroenterol Disord.
2002;2:16.
6. Camu F, Beecher T, Recker DP and
Verburg KM. Amer J Ther.
2002;9:43.
7. Higuchi T and Mishra. JJ Pharm Sci. 1962;51:685
8. Goldberg AH, Gibaldi M and Kanig
JL. J Pharma Sci. 1966;55:482.
9. Hilton JE and summers MP. Int J
Pharm. 1986;31:157.
10.Najib MM, Suleiman M and Malakh
AN. Int J Pharm. 1986;32: 229
11.Rani G,Venkataramana D,
Suryakumar J and Krishna DR. Indian J Pharm Sci. 1993;55:61.
12.Patel DM, Shah RR and Jogani PD.
Indian J Pharm Sci. 2003;65:264
13.Patel DM, Shah RR and Jogani PD.
Indian J Pharm Sci. 2004;66:49.
14.Madusudan B, Rambhau D,
Gudsoorkar VR, Shete JS and Apte SS. Indian J Pharm. Sci. 2002;64:233
15.Lachman L and Lieberman HA. In;
Pharmaceutical Dosage Forms,
Tablets, Marcel Dekker, Inc., New York; Vol. 2
16.Indian Pharmacopoeia, Controller of
Publications, India, New
Delhi;2ndEdn 1966:740
17.Indian Pharmacopoeia, Controller of
Publications, India, New
Delhi;4ndEdn. 1966:A-80.
18.Indian Pharmacopoeia, Controller of
Publications, India, New Delhi; 4ndEdn. 1966:A-82.
19.USP 24 and NF 19, US
Pharmacopoeial convention, Inc., Rockville, MD; 2000: 1941
20.Polli JE, Rekhi GS, Augsburger LL
and Shah VP. J Pharm Sci. 1997;86:690.
21.M. EL-Badry and M. Fathy. Drug
Development and Industrial
Pharmacy, Number 2 2006;32:141-150.
22.Habib W, Khankaric R and Hontz J. Crit Rev Ther Drug Carrier Systs. 2000;17:61.
23.Chang RK, Guo X. Burnside BA. and Couch RA. Pharm Technol. 2000 24:52.
24.Mayersohn M and Gibaldi. J Pharm
Sci. 1966;55:1323.
25.Chiou WL and Riegelman S. J Pharm
Sci. 1971;60:1281.
26.Giovanni FilippoPalmieri, Franco
Cantalamessa, Piera Di Martino, CinziaNasuti and SanteMartelli. Drug Development and Industrial Pharmacy. 2002;28(10):1241-1250
27.Vandre MK. Swarbrich J. Edn.,
Encyclopedia of Pharmaceutical
Technology, Marcel Dekker, Inc., New York, 1999;3: 337
28.Remington, The Science and
Practical of Pharmacy, Gennaro, A.R., Eds., Lippincott Williams &
Wilkins, New York, 2000; 20th