INTERNATIONAL JOURNAL OF PHARMACEUTICAL, CHEMICAL AND BIOLOGICAL SCIENCES
Available online at
www.ijpcbs.com
DEVELOPMENT, CHARACTERIZATION AND OPTIMIZATION
OF SOLID LIPID NANOPARTICLES FROM MICROEMULSION
TECHNIQUE USING A BOX-BEHNKEN DESIGN
M. Parvathi
1*, J. Raveendra Reddy
1and D. Subba Rao
21
Raghavendra institute of pharmaceutical education and research (RIPER),
Anantapur, Andhra Pradesh, India.
2
JNTUA college of engineering, Anantapur, Andhra Pradesh, India.
INDRODUCTION
Solid lipid nanoparticles (SLNs) showed better advantages compared to existing drug , delivery systems. The benefits of SLNs are sustained release, increased loading capacity, incorporation of both hydrophobic and hydrophilic drugs etc. Several methods are available for the production of SLNs among them microemulsion method was highly suitable for SLNs preparation at laboratory level. In order to reduce the number of experiments and improve the productivity the SLNs was prepared as per response surface method (RSM). The present research work utilizedbiocompatible solid lipids were monostearin (GMS), pearl stearic (stearic acid), palmitate (palmitic acid), cetylpalmitate, glycerol tristearate (tristearin), glycerol tripalmitate(tripalmitin), and surfactants as polysorbate 60,polysorbate 80, polysorbate 20, klliphor RH 40 and co-surfactants such as polyglycol400, ethanol. The prepared SLNs were analyzed forsurface charge, surface potential, %EE and drug diffusion.
MATERIALS AND METHODS Materials
Prednisolone acetate (PA) was procured from Sigma-Aldrich chemical Co; Germany.Cremophor RH40 was purchased BASF certified supplier zeel. Tween 20, 60, 80 and PEG400 were brought from chemisol.
ABSTRACT
The objective of this study was to formulate and optimize PA loaded SLNs usingvarious solid lipids. The SLNs were prepared from phase behaviours of hot microemulsions-ultra probe sonication technique.The phase diagrams were prepared from lipid/Smix at 60oc using prosimsoftware. The analogy between design factors and experimental data was studied using response surface methodology(RSM). A statistical technique of RSM with Box-Behnken design wasframed to study and determine the influence of formulation independent factors including a solid lipid (x1), surfactant/co-surfactant ratio (x2), sonication time (x3). The dependent factors were particle size, entrapment efficiency(%EE). Tristearin showed better stability and low particle size hence selected for the study. The prepared nanoparticles were in a spherical shape and average particle size of 24.69 nm andthe polydispersity index, zeta potential and %EE range of 0.274, -28.47mV & 89.82% respectively. In Vitro diffusion studies showed a burst release at the initial stage followed by prolonged release of PA from SLNs up to 15hrs and drug diffusion found to be 94.85%. The release kinetics of the optimized formulation was best fitted the zero order model (R2- 0.9938).These results concluded that the prednisolone acetate –loaded SLNs could potentially be exploited as a delivery system with improved drug entrapment efficiency, low mean particle size and controlled drug release.
Bangalore. Ethanol was purchased from Hi-media, Secunderabad. Solid lipids were from Bros scientifics,Tirupati. All other chemicals and solvents used were of analytical grade.
Preparation of lipid microemulsions
Among the selected solid lipids tristearin showed low zeta size, better zeta potential and stability hence was selected. Initially pseudoternary phase diagrams were constructed using solid lipid (tristearin), surfactant as polysorbate 60, polysorbate 80, polysorbate 20, Kolliphor RH 40 and co-surfactants such as polyglycol 400, ethanol. The weight ratio of surfactant to co-surfactants ratio of 1:1, 2:1, 3:1, 4:1 and lipid to Smix ratio of 1:9, 2:8, 3:7, 4:6, 5:5, 6:4, 7:3, 8:2, 9:1 (%w/w). From all these pseudoternary phase diagrams had highest area was selected for further studies. The procedure for the preparation of
microemulsion, tristearin kept at 65octo this melt PA followed by polysorbate 60 and ethanol was added.
The similar procedure was followed for the remaining surfactants and co-surfactants.
Preparation of SLNs
The formula for the preparation of SLNs was followed as per Box-Behnken design. The prepared lipid microemulsionwas added to cold water under probe sonicator at 200w amplitude with probe 8mm diameter at different time intervals. The obtained liquid SLNs converted into solid SLNs using ScanVac analyzer and its size, potential and PDI was analyzed by zeta sizer.
Experimental design
The 33 Box-Behnkendesign was applied to study the effect of independent variables on dependent
variables and shown in Table 2.
Zeta size, potential and PDI
The SLNs size, potential and size was measured using zeta sizermentioned in Table 2.
Encapsulation efficiency
The prepared SLNs were centrifuged and amount of drug which was not incorporated analyzed using UV-Visible spectrophotometer from that drug encapsulated determined.
EE %= [(wtotal- wfree)/wtotal]*100
Wtotal = total amount of drug added Wfree = not encapsulated drug
In vitrodrug diffusion studies
The prepared SLNs (5ml) kept in receptor compartment and samples were withdrawn at different time intervals 0, 0.5, 1, 2, 3, 4, 5, 6, 7, 8, 9, 10, 11, 12, 13, 14, 15 hrs. The following conditions were used for in vitro diffusion studies.
Diffusion medium : SNES The run speed: 50 rpm
Volume of diffusion medium: 30mL
Temperature: 37±0.5oc
RESULTS AND DISCUSSION
In the present study, a 17 run, 3-factor, 3-level Box-Behnken design was designed to obtain polynomial equations. The response surface plots and polynomial equations was obtained using Design expert soft
ware (Trial version9). Independent factors including a tristearin (X1), Smix ratio (X2), sonication time (X3).
The dependent factors were particle size (Y1), entrapment efficiency (Y2) were shown in Table1. The
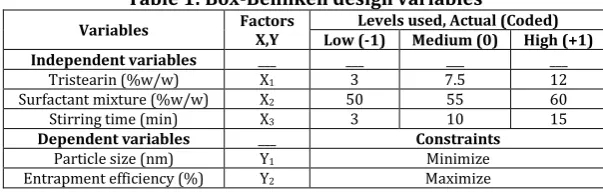
Table 1: Box-Behnken design variables
Variables Factors X,Y Low (-1) Levels used, Actual (Coded) Medium (0) High (+1) Independent variables ___ ___ ___ ___
Tristearin (%w/w) X1 3 7.5 12
Surfactant mixture (%w/w) X2 50 55 60
Stirring time (min) X3 3 10 15
Dependent variables ___ Constraints
Particle size (nm) Y1 Minimize
Entrapment efficiency (%) Y2 Maximize
Table 2: Box-Behnken design matrix and observed responses
RUN Tristearin (%w/w) Cremo:Ethanol (3:1), (%w/w) Sonication time (Min) size(nm) Particle efficiency (%) Entrapment Zeta potential (mV) PDI
1 3 50 10 94.4 74.26 -15.5 0.535
2 3 55 5 91.23 77.17 -13.5 0.715
3 3 55 15 89.41 77.34 -13.5 0.715
4 3 60 10 87.42 79.35 -12.6 0.767
5 7.5 50 15 79.84 83.12 -22.8 0.522
6 7.5 50 5 80.04 83.01 -13.7 0.522
7 7.5 55 10 27.98 86.43 -16.4 0.901
8 7.5 55 10 27.98 86.43 -16.4 0.901
9 7.5 55 10 27.98 86.43 -16.4 0.901
10 7.5 55 10 27.98 86.43 -16.4 0.901
11 7.5 55 10 27.98 86.43 -16.4 0.901
12 7.5 60 5 26.64 89.78 -22.8 0.281
13 7.5 60 15 24.69 89.82 -28.4 0.275
14 12 50 10 179.1 90.07 -19.8 0.334
15 12 55 15 180.23 91.43 -17.1 0.281
16 12 55 5 183.04 91.56 -17.1 0.639
17 12 60 10 187.63 94.78 -13.7 0.639
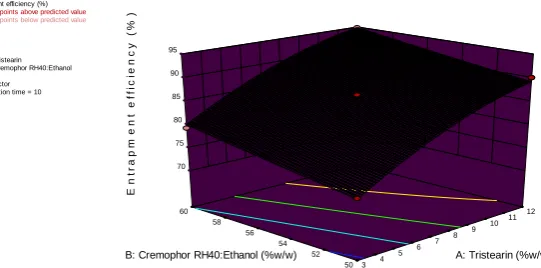
Entrapment efficiency
The encapsulation efficiency ranges from 74-94%. The effect of X1, X2 and X3 on encapsulation efficiency
explained by quadratic equation.
% Entrapment efficiency = +86.43+7.47*A+2.91*B- 0.024*C-0.095*AB-0.075*AC-0.018*BC-1.94A2+0.12*B2-0.12*C2
The + values indicated that directly affected by the factors i.e. increased the factor ratio increases the
response. The r2 was found to be 0.9999, indicating good fit in the equation. The P value of X1andX2 was
P<0.05 hence these two factors significantly affect the % entrapment of drug in lipid core. The
X3(sonication time) had – value hence sonication not influences the entrapment of drug in lipid core.
Particle size
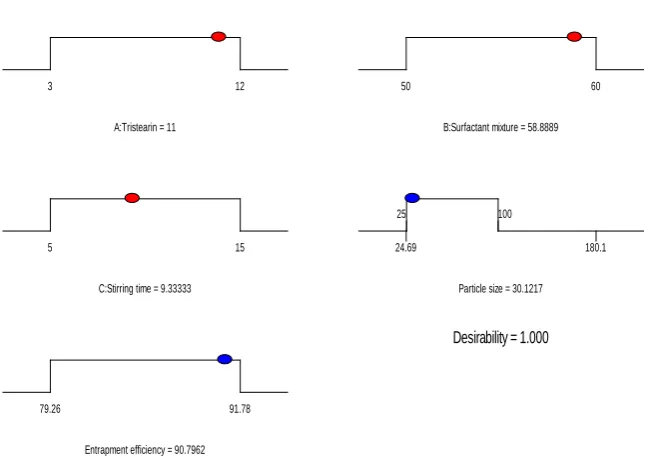
The nanoparticle size varied from 24 to 187 nm. From the ramp model various trials were carried out and shown in Fig 3. After comparing the optimized and experimental value showed that the particle size, zeta potential, PDI and %EE was 24.69nm, -28.47mV, 0.274 and 89.82% respectively. The zeta size graph and optimized ,experimental value showed in Fig 1 & 2 and Table 3.
Table 3: Values of optimized and experimental values
parameters at desired level
Optimized value Exp. value Zeta size, nm % EE b Zeta size, nm % EE
Tristearin (lipid) (%) = 11
Surfactant mixture (%) = 58.88 Stirring time (min)
=9.33
Fig. 1: Zeta size graph of optimized formulation
Fig. 2: Zeta potential graph of optimized formulation
A:Tristearin = 11
3 12
B:Surfactant mixture = 58.8889
50 60
C:Stirring time = 9.33333
5 15
Particle size = 30.1217 25 100
24.69 180.1
Entrapment efficiency = 90.7962
79.26 91.78
Optimization by Box Behnken Design
The values were treated with Box-Behnken design and subjected to model adequacy test, model summary statistics and ANOVA these values were mentioned in Table 6, 7 &8 respectively. The effect of independent variables on response was shown in surface plots from fig.
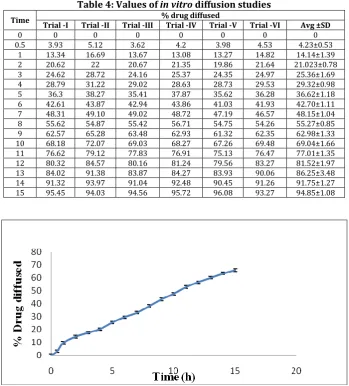
In vitro diffusion studies
The drug release was found up to 15 hrs of 94%. The kinetic release studies showed that drug followed zero order release. The values of drug release and graph was mentioned in table 4 and Fig:4 respectively. The kinetics of drug release was mention in Table 5.
Table 4: Values of in vitro diffusion studies
Time Trial -I Trial -II Trial -III % drug diffused Trial -IV Trial -V Trial -VI Avg ±SD
0 0 0 0 0 0 0 0
0.5 3.93 5.12 3.62 4.2 3.98 4.53 4.23±0.53
1 13.34 16.69 13.67 13.08 13.27 14.82 14.14±1.39
2 20.62 22 20.67 21.35 19.86 21.64 21.023±0.78
3 24.62 28.72 24.16 25.37 24.35 24.97 25.36±1.69
4 28.79 31.22 29.02 28.63 28.73 29.53 29.32±0.98
5 36.3 38.27 35.41 37.87 35.62 36.28 36.62±1.18
6 42.61 43.87 42.94 43.86 41.03 41.93 42.70±1.11
7 48.31 49.10 49.02 48.72 47.19 46.57 48.15±1.04
8 55.62 54.87 55.42 56.71 54.75 54.26 55.27±0.85
9 62.57 65.28 63.48 62.93 61.32 62.35 62.98±1.33
10 68.18 72.07 69.03 68.27 67.26 69.48 69.04±1.66
11 76.62 79.12 77.83 76.91 75.13 76.47 77.01±1.35
12 80.32 84.57 80.16 81.24 79.56 83.27 81.52±1.97
13 84.02 91.38 83.87 84.27 83.93 90.06 86.25±3.48
14 91.32 93.97 91.04 92.48 90.45 91.26 91.75±1.27
15 95.45 94.03 94.56 95.72 96.08 93.27 94.85±1.08
Fig. 4: In vitro diffusion studies of optimized formulation
Table 5: Release kinetics of optimized formulation
S.NO. R2 Value Korsemeyerpeppas
Optimized Zero order First order Higuchi Plot R2 Value n-Value
Optimization by Box Behnken Design
Table 6: Model adequacy tested in the design
Source Sum of squares DF Mean square F value P value Prob>F Remarks
Particle size
Mean 1.226E+005 1 1.226E+005
Linear 18322.58 3 6107.53 1.84 0.1904
2FI 61.15 3 20.38 4.720E-003 0.9995
Quadratic 41671.10 3 13890.37 64.11 <0.0001 Suggested
Cubic 1516.67 3 505.56 Aliased
Residual 0.000 4 0.000
Total 1.842E+005 17 10832.56
Entrapment efficiency
Mean 1.256E+005 1 1.256E+005
Linear 293.79 3 97.93 267.35 <0.0001 Suggested
2FI 0.55 3 0.18 0.43 0.7332
Quadratic 4.18 3 1.39 286.30 <0.0001 Suggested
Cubic 0.034 2 0.017 Aliased
Residual 0.000 5 0.000
Total 1.259E+005 17 7402.94
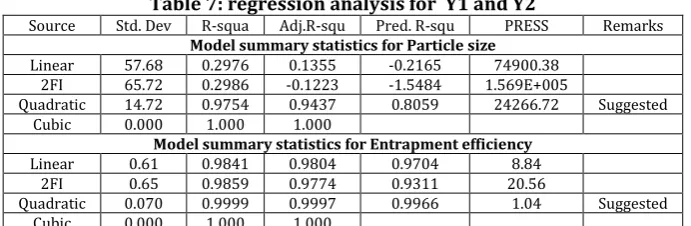
Table 7: regression analysis for Y1 and Y2
Source Std. Dev R-squa Adj.R-squ Pred. R-squ PRESS Remarks
Model summary statistics for Particle size
Linear 57.68 0.2976 0.1355 -0.2165 74900.38
2FI 65.72 0.2986 -0.1223 -1.5484 1.569E+005
Quadratic 14.72 0.9754 0.9437 0.8059 24266.72 Suggested
Cubic 0.000 1.000 1.000
Model summary statistics for Entrapment efficiency
Linear 0.61 0.9841 0.9804 0.9704 8.84
2FI 0.65 0.9859 0.9774 0.9311 20.56
Quadratic 0.070 0.9999 0.9997 0.9966 1.04 Suggested
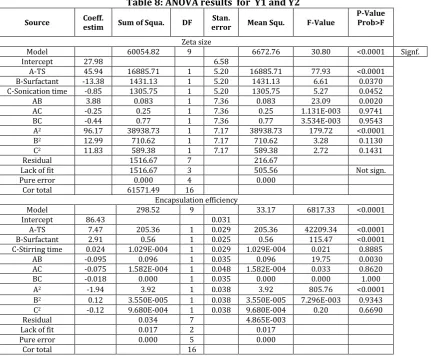
Table 8: ANOVA results for Y1 and Y2
Source Coeff. estim Sum of Squa. DF error Stan. Mean Squ. F-Value P-Value Prob>F
Zeta size
Model 60054.82 9 6672.76 30.80 <0.0001 Signf.
Intercept 27.98 6.58
A-TS 45.94 16885.71 1 5.20 16885.71 77.93 <0.0001
B-Surfactant -13.38 1431.13 1 5.20 1431.13 6.61 0.0370
C-Sonication time -0.85 1305.75 1 5.20 1305.75 5.27 0.0452
AB 3.88 0.083 1 7.36 0.083 23.09 0.0020
AC -0.25 0.25 1 7.36 0.25 1.131E-003 0.9741
BC -0.44 0.77 1 7.36 0.77 3.534E-003 0.9543
A2 96.17 38938.73 1 7.17 38938.73 179.72 <0.0001
B2 12.99 710.62 1 7.17 710.62 3.28 0.1130
C2 11.83 589.38 1 7.17 589.38 2.72 0.1431
Residual 1516.67 7 216.67
Lack of fit 1516.67 3 505.56 Not sign.
Pure error 0.000 4 0.000
Cor total 61571.49 16
Encapsulation efficiency
Model 298.52 9 33.17 6817.33 <0.0001
Intercept 86.43 0.031
A-TS 7.47 205.36 1 0.029 205.36 42209.34 <0.0001
B-Surfactant 2.91 0.56 1 0.025 0.56 115.47 <0.0001
C-Stirring time 0.024 1.029E-004 1 0.029 1.029E-004 0.021 0.8885
AB -0.095 0.096 1 0.035 0.096 19.75 0.0030
AC -0.075 1.582E-004 1 0.048 1.582E-004 0.033 0.8620
BC -0.018 0.000 1 0.035 0.000 0.000 1.000
A2 -1.94 3.92 1 0.038 3.92 805.76 <0.0001
B2 0.12 3.550E-005 1 0.038 3.550E-005 7.296E-003 0.9343
C2 -0.12 9.680E-004 1 0.038 9.680E-004 0.20 0.6690
Residual 0.034 7 4.865E-003
Lack of fit 0.017 2 0.017
Pure error 0.000 5 0.000
Cor total 16
Design-Expert® Software Factor Coding: Actual Particle size (nm)
Design points above predicted value
Design points below predicted value 187.63
24.69 X1 = A: Tristearin X2 = B: Cremophor RH40:Ethanol Actual Factor
C: Soniction time = 10
50 52 54 56 58 60
3 4 5 6
7 8 9 10
11 12 0
50 100 150 200
P
a
r
ti
c
le
s
iz
e
(
n
m
)
A: Tristearin (%w/w) B: Cremophor RH40:Ethanol (%w/w)
Design-Expert® Software Factor Coding: Actual Particle size (nm)
Design points above predicted value Design points below predicted value
187.63
24.69
X1 = A: Tristearin X2 = C: Soniction time
Actual Factor
B: Cremophor RH40:Ethanol = 55
5 7 9 11 13 15
3 4 5 6
7 8 9 10
11 12 0 50 100 150 200 P a r t ic le s iz e ( n m )
A: Tristearin (%w/w) C: Soniction time (min)
Fig. 6: Response surface plot of optimized formulation
Design-Expert® Software Factor Coding: Actual Particle size (nm)
Design points above predicted value Design points below predicted value
187.63
24.69
X1 = B: Cremophor RH40:Ethanol X2 = C: Soniction time
Actual Factor A: Tristearin = 7.5
5 7 9 11 13 15 50 52 54 56 58 60 0 50 100 150 200 P a r ti c le s iz e ( n m )
B: Cremophor RH40:Ethanol (%w/w) C: Soniction time (min)
Fig. 7: Response surface plot of optimized formulation
Design-Expert® Software Factor Coding: Actual Entrapment efficiency (%)
Design points above predicted value
Design points below predicted value 94.78
74.26 X1 = A: Tristearin X2 = B: Cremophor RH40:Ethanol Actual Factor C: Sonication time = 10
50 52 54 56 58 60
3 4 5 6
7 8 9 10
11 12 70 75 80 85 90 95 E n tr a p m e n t e ff ic ie n c y ( % )
A: Tristearin (%w/w) B: Cremophor RH40:Ethanol (%w/w)
Design-Expert® Software Factor Coding: Actual Entrapment efficiency (%)
Design points above predicted value Design points below predicted value
94.78
74.26
X1 = A: Tristearin X2 = C: Sonication time
Actual Factor
B: Cremophor RH40:Ethanol = 55
5 7 9 11 13 15
3 4 5 6
7 8 9 10
11 12 70 75 80 85 90 95 E n tr a p m e n t e ff ic ie n c y ( % )
A: Tristearin (%w/w) C: Sonication time (min)
Fig. 9: Response surface plot of optimized formulation
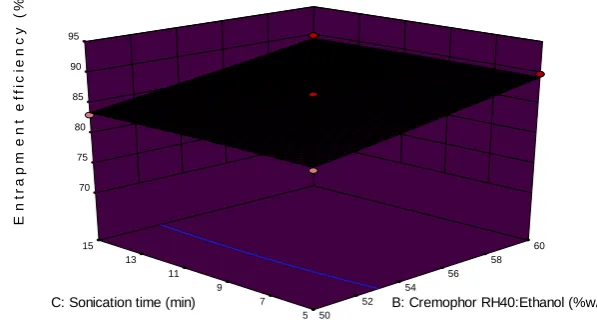
Design-Expert® Software Factor Coding: Actual Entrapment efficiency (%)
Design points above predicted value Design points below predicted value
94.78
74.26
X1 = B: Cremophor RH40:Ethanol X2 = C: Sonication time
Actual Factor A: Tristearin = 7.5
5 7 9 11 13 15 50 52 54 56 58 60 70 75 80 85 90 95 E n tr a p m e n t e ff ic ie n c y ( % )
B: Cremophor RH40:Ethanol (%w/w) C: Sonication time (min)
Fig. 10: Response surface plot of optimized formulation
REFERENCES
1. Mukherjee S, Ray S and Thakur RS. Solid lipid nanoparticles: A modern formulation approach in
drug delivery system. Ind J Pharm. 2009;71:349-358.
2. ZurMuhlen A, Schwarz C and Mehnert W. Solid lipid nanoparticles (SLN) forcontrolled drug
delivery-drug release and release mechanism. Eur JPharm Biopharm. 1998;45(2):149–155.
3. Muller RH, Madar K and Gohla S. Solid lipid nanoparticles for controlled drug delivery-a review
of the state of the art. Eur J Pharm Biopharm. 2000;50:161-177.
4. Jannin V, Musakhanian J and Marchaud D. Approaches forthe development of solid and semi-solid
lipid-based formulations, Advanced Drug Delivery Reviews. 2008;60(6):734–746.
5. Mehnert W and Mader K. Solid lipid nanoparticles: production, characterization and application,
Adv Drug Deliv Rev. 2001;47:165-196.
6. Muller RH, Olbrich C and Kayser O. Lipase degradation of Dynasan 114 and116 solid lipid
7. Yang HJ, Cho WG and Park, SN. Stability of oil-in-water emulsions preparedusing the phase inversion composition method. J Ind Eng Chem. 2009;15:331.
8. Basu B, Garala K, Bhalodia R, Joshi B and Mehta K. Solid lipid nanoparticles : A promising tool for
drug delivery system. J Pharm Research. 2010;3(1):84-92.
9. Das S and Chaudhury A. Recent advances in lipid nanoparticleformulations with solid matrix for
oral drug delivery. AAPS Pharm Sci Tech. 2011;12(1):62–76.
10. Uner M. Preparation, characterization and physico-chemical properties of solid lipid
nanoparticles (SLN) and nanostructured lipid carriers (NLC): Their benefits as colloidal drug carrier systems. Pharmazie. 2006;61:375–86.
11. Kaur IP, Bhandari R, Bhandari S and Kakkar V. Potential of solid lipidnanoparticles in brain
targeting. J Control Release. 2008;127:97-109.
12. Wissing SA, Kayser O and M¨uller RH. Solid lipid nanoparticles for parenteral drug delivery. Adv.
Drug Deliv Rev. 2004;56(9):1257–1272.
13. Almeida AJ, Runge S and Miiller RH. Peptide-loaded solid lipid nanoparticles (SLN): Influence of
production parameters. Int J Pharm. 1997;149:255-265.
14. Ketenci A, Basat H and Esmaeilzadeh S. The efficacy of topical thiocolchicoside (Muscoril) in the
treatment of acute cervical myofascial pain syndrome: a single-blind, randomized, prospective, phase IV clinical study. Journal of the Turkish Society of Algology. 2009;21(3):95–103.
15. Soonawalla DF and Joshi N. Efficacy of thiocolchicoside in Indian patients suffering from low back