381 |
P a g e
IMAGE FORGERY DETECTION USING ANALYSIS
OF CFA ARTIFACTS
Yogesh Katre
1, Prof. Gajendra Singh Chandel
21
M.tech Student , Software Engineering, SSSIST, Sihore(M.P.), India
2
HOD ,Software Engineering ,SSSIST(M.P.),India
ABSTRACT
Image forgery detection plays an important role in image forensics, most of the existing methods aimed at
focusing coarse grained forgery localization. In this paper, we introduce tamper detection techniques based on
artifacts created by Color Filter Array (CFA) processing in most digital cameras. We make the assumption that
tampering removes the artifact due to de-mosaicking algorithm. We focus our attention on the fine grained
forgery localization problem, assuming to have no information on the position of possibly manipulated pixel.
The proposed method is based on a new feature measuring the presence of de-mosaicking artifact at local level.
We proposed a new feature measuring the presence of de-mosaicking artifact even at the smallest 2 X 2 block
level with the help of this method we are able to find fine grained forgery localization .
Keywords
—
CFA Artifact, Digital Camera Demosaicking, Forgery, Image Forensics, Interpolation,Tampering Probability Map.
1.INTRODUCTION
Imaging Devices (Digital Cameras, PDA, Mobile Phones, etc.) are becoming more and more ubiquitous,
replacing de facto the film-based camera in all camera based applications. To reduce the costs and size, typical
devices use the expedient to capture the image using only one sensor chip (CCD or CMOS), covering its surface
with a Color Filter Array (CFA). The CFA is compound by a set of spectrally selective filters, arranged in an
interleaved mosaic pattern, so that each pixel registers only one of the components of the color spectrum.
Nearly all digital cameras contain an image sensor with a color filter array, for example, the Bayer filter array
shown in Figure 1. A filter is positioned over each photo site, sensitizing it to either the red, green, or blue
component of the incident light. While other color filter array patterns and filters are sometimes used, the Bayer is
the most common The raw image from the image sensor contains only a single signal value at each pixel position.
This pixel value further corresponds to only a single color component (red, green, or blue in the case of the Bayer
382 |
P a g e
the raw image to estimate the pixel value for each color component. The interpolation can either be linear oradaptive. With a native interpolation, each color channel is interpolated independently using only samples from
the same color, for example, with bilinear or bicubic, interpolation.
In more complicated linear algorithms, interpolation is performed by considering the local pixel values of
multiple color channels. For example, all of the missing green values can first be found. Then missing red pixel
values are found by interpolating a red minus green differential. In even more complex nonlinear algorithms, the
interpolation kernel is adaptive depending on the characteristics of the pixel values of the local neighborhood.
Generally speaking, demosaicing algorithms have several features in common. Missing color values are
determined from a weighted linear combination of neighboring pixels, and the sum of the weights is one. As
described in both [4] and [5], it was shown in general that interpolation of this variety leaves a signature that can
be reliably detected. Detailed analysis of the signal traces left by interpolation are found in [4,5]. Considering
only the green pixel values of the Bayer pattern shown in Figure 1, each green pixel value can be interpolated
from its four nearest neighbors using bilinear interpolation.
Fig. 1. When demosaicking is performed with linear interpolation, The interpolated green pixels
have lower variance than the original green pixels. Assuming pixel values from green photo sites
in the bayer array are IID with variance 1/4 , this image represents the variance from which
each pixel value is drawn. The spatial pattern of variances is the basis for detecting the presence
of demosaicking
.The artifact left in the image by the interpolation process can be analyzed to revel image forgery.
Demosaicking inconsistencies between different parts of the images as well as resampling artifact in all or part of
the analyzed image will put image integrity in doubt.
Our effort is focused on the study of demosaicking artifact at local level: by means of a local analysis of
such traces we aim at localizing image forgeries whenever the presence of CFA interpolation is not present.
Obviously our approach is based on the hypothesis that unmodified images coming from a digital camera are
characterized by the presence of CFA demosaicking artifact. Starting from such an assumption, we propose a
new feature that measure the presence/absence of these artifact even at the smallest 2 X 2 block level, thus
providing as final output a forgery map indicating with fine localization the probability of the image to be
383 |
P a g e
2. LITERATURE SURVEY
Swaminathan et al. in [6] propose a method for camera identification by the estimation of the CFA pattern and
interpolation kernel; while in [7] the same authors exploit the inconsistencies among the estimated demosaicking
parameter as proof of tampering. Bayram et al. detect and classify traces of demosaicking by jointly analyzing
feature coming from previous work (see [8] and [9] below), in order to identify the source camera
model.Regarding the detection of demosaicking traces, Popescu and farid propose an approach for detecting the
interpolation artifacts left on digital images by resampling [5] and demosaicking processes. Authors tested their
algorithms on 256 X 256 and 512 X 512 sized areas. By applying Expectation-Maximization algorithm.
Gallagher in [9] observed that the variance of the second derivative of an interpolated signal is periodic: he thus
looked for the periodicity in the second derivative of the overall image by anlalyzing its Fourier transform.
Successively,for detecting traces of demosaicking. Gallagher and Chen proposed in [10] to apply Fourier analysis
to the image after high pass filtering, for capturing the presence of periodicity in the variance of
interpolated/acquired coefficients authors tested theirs algorithm on 64 x 64 image block.
In[11] by Dirik and Memon, in their paper a block based CFA detection proposed ,however the feature
proposed there in have to computed on 96 x 96 blocks, thus permitting only a coarse grained localization of
tampering. By analyze generic resampling artifacts can also detect demosaicking artifact.In this area ,Kirchner in
[12],[13] consider an approach similar to [5],by observing that the actual prediction weights of the resampling
filter are not necessary for revealing periodic artifacts, thus simplifying the analysis, however experimental results
consider only 512 X 512 images. Vasquez- Padin et al.demonstrate that the interpolated images in an almost
cyclostationary process, with a period depending on the resampling factor. However , the authors use image
blocks of size 128 X 128 pixels for the analysis, which only permits a coarse forgery localization.
We focus our attention on the fine grained forgery localization problem. Since in the previous approaches
either the area to be investigated has to manually selected, or automatic block processing obtain poor detection
performance.
Fig.2. (a) The Bayer’s filter mosaic; (b) the quincunx lattice A for the acquired green channels
and the complementary quincunx lattice I for the interpolated green channel.
3. PROPOSED ALGORITHM
When we are processing the images in the digital domain, the emphasis is on the pixel—the underlying building
384 |
P a g e
pixel-level correlations that arise from a specific form of tampering. We will analyze pixel level correlation byusing color Filter array. We will consider as specific CFA the most frequently used Bayer’s filter mosaic ,a 2 X
2 array that contain red and green filter for one row and blue and green filter for another row(see fig 2( a)).We
will extract only green channel because the green channel is up sampled by a factor 2.
We focusing on the green channel, the acquired or interpolated samples of one-dimensional case turn into the
quincunx lattice A for acquired green values and the second one is quincunx lattice I for interpolated green
values. Similar two one dimensional case, we assume that in the presence of CFA interpolation the variance of
prediction error on acquired pixel is higher than the variance of prediction error on interpolation pixel. In both
case it is content dependent and in opposite if no demosaicking has been applied, the variance of the prediction
error on acquired pixel and interpolated pixel having similar value.
3.1 Proposed Feature
We assume s(x, y) is an observed image. Where . The prediction error can be obtained as:
(1)
Where is a bidimensional prediction filter. In the ideal case . Where is the interpolation
kernel of the demosaicking algorithm. In general we assume that Since the in-camera demosaicking
algorithm usually unknown.
Due to the local stationary of the residue, the variance of the prediction error e(x, y) is locally estimated pixel
by pixel for each position (demosaicked or acquired) only from a neighborhood of interpolated (I) or acquired (A)
pixels respectively. In our work we assume to know the spatial pattern of the CFA. We use Bayer CFA in our
method. This hypothesis is not a serious constraint, because it is reasonable to suppose either to know the CFA
pattern it can be estimate by adopting a proper estimating algorithm [6].
By assuming that the local stationarity of the prediction error is valid in a window. It is
possible to define the local weighted variance of the prediction error
(2)
Where α i j are suitable weight, is a local weighted mean of the prediction
error and ,j is a scale factor that makes the estimator unbiased i.e.,
,for each pixel class. The weight where:
(3)
and W( i , j) is a (2K + 1) X (2K + 1) Gaussian window with standard deviation K/2.
Given a N X N image, we analyze it by considering B X B nonoverlapping blocks, where B is related to the
period of Bayer’s filter mosaic: the smallest period (and block dimension) is (2,2),but also multiples can be
385 |
P a g e
disjoint sets of acquired and interpolated pixels, indicated as and respectively. We then define thefeature L[15]:
(4)
Where is the geometric mean of the variance of prediction errors at acquired pixel position, defined
as:
(5)
Whereas is similarly defined for the interpolated pixels.
Now using proposed feature L it is possible to find imbalance between the local variance of prediction error
when an image is demosaicked: indeed, in this case the local variance of the prediction error of acquired pixels is
higher than that of interpolated pixel and thus the expected value of L( k, l) is a nonzero positive amount. If the
image is not demosaicked, this difference between the variance of acquired and interpolated pixel disappears and
thus the expected value of L(k, l) is zero. Our approach will be based on these two key observation.
Let we take demosaicked image has been tampered by some part of image and to make the forgery more
realistic ,some process(blurring, shearing, rotation, compression, etc.)has been likely applied to the added content,
due to that destroying the demosaicking traces on the forged region. when we propose feature L(k. l) from such
image the local variance of prediction error of acquired pixel is equal to local variance of prediction error of
interpolated pixel. We can thus employ these inconsistence to finely localize forgeries.
In some respect, proposed feature is conceptually similar to the approach in [10].In that approach technique
required to find local variance and difference use Fourier analysis.
3.2. Feature Modeling:
It is possible to derive the probability that CFA artifact are presence/absence conditioned on the observed
value of L(k,l) by applying Bayesian approach ,to each block B k,l.
Let M1 and M2 be the hypothesis of presence and absence of CFA artifact, respectively. In order to have a
simple and tractable model, we assume that L(k, l) is Gaussian distributed under both hypothesis and for any
possible size B of the blocks . For a fixed B, we can characterize our feature using the following conditional
probability density function:
) (6)
With µ1 > 0 ,and
(7)
The above probability density function hold for all block B k ,l =0,1,…..(N/B) – 1,i.e., we assume that the
parameters of the two conditional pdf do not change over the considered image, such that they can be globally
386 |
P a g e
part, i.e. CFA artifact have been destroy. Therefore L(k, l) can be modeled as a mixture of Gaussian distribution.The feature L(k, l) can be modeled as a mixture of Gaussian distribution. Now the first M1 contain µ1 > 0 due to
the CFA artifact present and second M2 contain µ2 = 0 due to the CFA artifact have been removed. In order to
estimate the parameter of the proposed Guassian mixture model (GMM).we employ the Expectation
maximization algorithm[14].This is the standard iterative algorithm that estimate the mean and the variance of
the component distribution by maximization the expected value of a complete log likelihood function with
respect to the distribution parameters. In our case ,the EM algorithm is used to estimate only µ1, and
,since we assume µ2 = 0. The final aim we point at is to achieve a map indicating for each B X B block its
probability to be original/tampered based on its probability to contain or not CFA artifacts. starting from (6) and
(7) and assuming a priori probabilities 1/2 we obtain the posterior probability of being an
original block. By exploiting Bayes’ Theorem and relying on the observed feature L (k,l) for each block we
achieve:
Which can be expressed as:
(9)
Where L is the likelihood ratio of L (k, l) defined as:
(10)
Let us note that (9) and (10) have the same statistical information. Applying (10) to each block of an image, we obtain a likelihood map (LM),where each pixel of the map is the likelihood ratio associated to a B X B block.
These map are usually noisy because they associate a probability value to a single realization of L (k,l).Which is
very noisy itself. In order to denoise these maps, we can cumulate feature values on larger blocks whose size is
C X C, where C= n.B with n . Assuming blocks to be conditionally likelihood ratio is obtained as:
(11)
In order to further improve the localization performance, we know the forged region area usually connected.,
due to the image semantic content. These connected region highlighted by applying to a simple low-pass filter,
Like a mean filter or a median filter. for better numerical stability, such filters are applied to the logarithm of the
387 |
P a g e
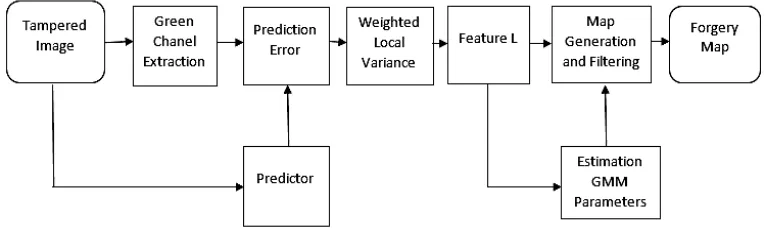
Fig 3. The Work Flow of Our Algorithm
We show the overall system working in fig 3.from a tampered image we find the forgery map.: each pixel in
the forgery map indicates for each C X C image block its probability to contain CFA artifacts, so that low values
in the output map correspond to likely forged areas.
First of all green channel extract from the given tampered image, and then prediction error computed. Because
in-camera processing algorithm are usually unknown, a fixed predictor is used. The weighted local variance is
then estimated and the feature L (k, l) is obtained for each B X B block. Then GMM parameter are estimate by
using expectation maximization algorithm and used for generation of the forgery map. When C=B the forgery
map is generated using the likelihood ratio in (10), whereas for C > B we use the cumulated likelihood map in
(11).Optionally, the intermediate log-likelihood map can be filter using either a mean filter or a median filter.
4. EXPERIMENTAL RESULT
The result presented in this paper have been obtained on a dataset consisting of 100 original color images, in TIFF
uncompressed format, coming from 4 different cameras (25 images for each camera): Canon EOS 450D, Nikon
D50, Nikon D90, Nikon D7000.All cameras are equipped with a Bayer CFA, thus respecting our requirement that
authentic images come from a camera leaving demosaicking traces, but the in-camera demosaicking algorithm of
such devices are unknown. Each image was cropped to 512 X 512 pixels, maintaining the original Bayer pattern,
which is assume to be known .We will refer to such a dataset as the original dataset.
Some example of forgery localization are shown on realistically tampered images. In all the cases, the
corresponding forgery maps have been obtained by computing features on 8 X 8 blocks(C=B=8), using the
bilinear predicator and applying median filtering on the log likelihood map. In fig. 4 a copy move forgery on an
image acquired with a Nikon D90 is shown. In fig. 4 both the original image and the tampered copy are saved in
TIFF uncompressed format. The flower in the upper- left corner has been pasted disaligning the CFA pattern,
whereas the flower in the lower right corner has been pasted maintaining the same CFA pattern. In fig 4 we show
the forgery maps obtained with the proposed algorithm with histogram. The proposed algorithm correctly
localizes the flower in the upper-left corner, whereas it is not able to localize the flower in the lower-right corner.
This is not surprising, since the proposed method gives higher likelihood values for positive values of the feature
and revels locals inconsistencies of the CFA artifact even when L < 0.To make the forgery more convincing some
image processing operation, like smoothing, filtering, stretching, rotating, etc., are applied. These operation,
388 |
P a g e
where a tampering is done by splicing a geometrically transformed image onto an image taken by a Nikon D90camera. In Fig. 5 we show forgery map obtained using proposed algorithm and also showing the histogram.
The inspection of the forgery maps in Figs. 4-5 suggests that the proposed method is less effective in the
presence of either almost flat areas or sharp edges. The prediction error is almost zero irrespective of the presence
of CFA artifact. So that this appears as an intrinsic limit of the method.
5. CONCLUSION
In this paper, we focused main attention on the fine grained forgery localization problem. We analyze artifact left
in the image by the interpolation process to reveal image forgery. The result show that the proposed algorithm can
be a valid tool for detecting and localizing forgeries in images acquired by a digital camera. However, it should
be remarked that the detection performance is strongly affected by JPEG compression, limiting the applicability
to scenarios in which the image under test is either uncompressed or compressed with high quality factors.
Moreover, the present method may not be directly applicable to camera using a super CCD.
Not tampered image Manipulated image
Probability map (Nb = 8)
20 40 60
10
20
30
40
-2000 -100 0 100 200
100 200 300
Histogram of the proposed feature
Fig.4. Detection of image forgery with histogram.
Not tampered image Manipulated image
Probability map (Nb = 8)
100 200 300
50
100 150
200 250
-1000 -50 0 50 100
500 1000 1500
Histogram of the proposed feature
389 |
P a g e
REFERENCES[1] J.Adams and J.Hamlton. Design of practical filter array interpolation algorithm for digital camera. Proc.
SPIE, 1997.
[2] D.Cok signal processing method and apparatus for producing interpolated chrominance values in a sampled
color image signal U.S Patent 4,642,678, 1986.
[3] C-Y Tsai and K. –T.Song.A new edge-adaptive demosaicing algorithm for color filter arrays.Image Vision
Comput,2007.
[4] A Gallagher . Detection of linear and cubic interpolation in JPEG compressed images. In Proc. CRV ,2005.
[5] A. Popescu and H. Farid. Exposing digital forgeries by detecting traces of resampling. IEEE Trans.on
Signal Processing. Vol. 53,no. 2,pt. 2,pp. 758-767 , Feb. 2005.
[6] A. Swaminathan, M. Wu, and K. R. Liu, Nonintrusive component forensics of visual sensor using images,
IEEE Trans. Inf. Forensic Security , vol 2,no. 1,pp. 91-106,Mar. 2007.
[7] A Swaminathan, M Wu and K. J. R. Liu,Digital image forensics via intrinsic fingerprints,IEEE Trans. Inf.
Forensic Security,vol. 3,no. 1,pp. 101-117,Mar. 2008.
[8] A. C. Popescu and H. Farid, Exposing digital forgeries in color filter array interpolated images,IEEE Trans.
On Signal Process, vol. 53,no. 10,pt 2,pp. 3948-3959,oct. 2005.
[9] A. C. Gallagher, Detection of linear and cubic interpolation in JPEG compressed images, In Proc.
Canadian Conf. Computer and Robot Vision,2005,vol. 0,pp. 65. 65-72.
[10]A. C. Gallagher and T. Chen ,Image authentication by detecting traces of demosaicing,In Proc. IEEE
Computer Vision and Pattern Recognition Workshops(CVPRW 2008), 2008, ppp. 1-8.
[11]A. E. Dirik and N. memon, Image tamper detection based on demosaicing artifacts, In Proc. 16th IEEE Int. Conf. on Image Processing (ICIP ‘09’),2009,pp. 1497-1500.
[12]M. Kirchner, Fast and reliable resampling detection by spectral analysis of fixed linear prediction residue,In
Proc. 10th ACM Mltimedia and Security Workshop(MM & Sec. ’08), 2008.pp. 11-20.
[13]M. Kirchner and T . Gloe, On resampling detection in re-compressed images,In proc. First IEEE int.
Workshop on Information Forensics and Security, 2009, Dec. 2009,pp. 21-25.
[14]A. P. Dempster, N. M. Larid, and D. B. Rubin, Maximum likelihood from incomplete data via the EM
algorithm,J . Royal Statist. Society:Servies B, vol. 39, pp. 1-38, 1977.
[15] Pasquale Ferrara, Tiziano Bianchi, Alessia De Rosa and Alessandro Piva, Image Forgery Localization via
fine grained analysis of CFA artifacts, IEEE Transaction on Information Forensics and security, vol. 7, No.