INTERNATIONAL RESEARCH JOURNAL OF PHARMACY
www.irjponline.com
ISSN 2230 – 8407
Research Article
FORMULATION, OPTIMIZATION AND EVALUATION OF MOUTH DISSOLVING TABLETS OF
PIROXICAM USING HYDROTROPIC SOLUBILIZATION TECHNIQUE
Akhil Sharma *, Shaweta Sharma, Keshari Kishore Jha, Shekhar Singh
Teerthanker Mahaveer College of Pharmacy, Teerthanker Mahaveer University, Moradabad, U.P., India
*Corresponding Author Email: [email protected]
Article Received on: 24/11/17 Approved for publication: 27/12/17
DOI: 10.7897/2230-8407.0812255
ABSTRACT
Solubility is a most important parameter for the oral bioavailability of poorly soluble drugs. Dissolution of drug is the rat e-determining step for oral absorption of the poorly water-soluble drugs, which can subsequently affect the in-vivo absorption of drugs. The delivery of such water-soluble drugs has been the subject of much research, as approximately 40% of new chemical entities are hydrophobic in nature and solubility of active pharmaceutical ingredients (API) has always been a concern for formulators. The objective of present work was to enhance the aqueous solubility of poorly soluble drug Piroxicam using hydrotropic solubilization technique and develop its mouth dissolving tablets which resulted in enhanced solubility and thus bioavailability of the drug. The present study included the formulation of mouth dissolving tablets of Piroxicam by incorporating suitable superdisintegrants, and subliming agent which were evaluated on the basis of pre and post compression parameters. Initially, physical mixtures and hydrotropic solid dispersions of Piroxicam, were prepared using selected hydrotrope i.e. sodium benzoate in different ratios. After evaluating the physical mixtures and hydrotropic solid dispersions, the particular HSD of the drug concerned, was screened out and selected for further formulation development in the form of mouth dissolving tablets. It was concluded that such novel formulation design could be extrapolated to many potential therapeutic candidates possessing poor aqueous solubilities targeting at overwhelming demand of enhanced bioavailability encompassing utmost economic relevance.
Keywords: Piroxicam; Solubility Enhancement; Hydrotropic Solubilization Technique; Hydrotropic Solid dispersion; Mouth dissolving tablets; Optimization
INTRODUCTION
The performance of orally administered dosage forms largely depends upon the inherent property of the drug candidate i.e. water solubility, which facilitates its absorption.1 Recent researches have revealed the necessity of developing novel dosage forms together with ease of medication. ODTs are advantageous particularly for geriatric patients with whom conventional tablets and capsules are problematic in swallowing. Moreover, pediatric patients, due to immature development of muscular and nervous capabilities, also fail to ingest them. MDTs are the currently preferred dosage forms with higher patient compliance.
The oral tablets, when brought to dissolve in mouth, result in rapid absorption and quicker onsets. The drugs undergoing pregastric absorption elicit apparently increased oral bioavailability when presented as MDTs.2
Better dissolution and bioavailability rates, of poorly aqueous soluble drugs, can be attributed to the phenomenon of solid dispersion.3 An increase in aqueous solubility of the chosen drug can be brought about by the addition of another solute which is attributed as hydrotropic solubilization (Fig.1). 4-5
MDTs induce rapid disintegration (>1 min.) of the dosage form in the oral cavity and the transformed residue is easily swallowable. 6 Piroxicam is chemically, 4-hydroxy-2-methyl-N-(2-pyridyl)-2H-1,2-benzothiazine-3-carboxamide-1,1-dioxide. It
rheumatoid arthritis, osteoarthritis and other joint disorders. The poor aqueous solubility of the drug made difficulty in formulation of appropriate dosage form with better absorption characteristics.7 Hence, the study included the formulation of MDTs of Piroxicam using hydrotropic solubilization method.
MATERIALS AND METHODS
Drug sample and carriers, used in the study were obtained from various companies of repute. Piroxicam -Ramdev Chemicals, Thane, Ascorbic acid, Sodium benzoate, Sodium acetate, Camphor, MCC & Magnesium Stearate-CDH Pvt. Ltd. Mumbai, Crospovidone & CCS-Vardha Biotech, Mumbai, Talc-Rankem and Mucin-Vivan Life Sciences, Mumbai etc.
SELECTION OF HYDROTROPE FOR POORLY AQUEOUS SOLUBLE DRUG
Equilibrium solubility determination at room temperature
The different dissolution media, consisting of distilled water, 20% solution of sodium acetate, sodium benzoate and ascorbic acid, were added with excess amounts of the drug separately and shaken (12 h at 28°±1°C) mechanically, equilibrated (24 hrs) and centrifuged (5 min at 2000 rpm). The supernatant obtained in each case, was passed through whatman filter paper (No. 41). Each filtrate was suitably diluted and analyzed spectrophotometrically.8
DRUG-EXCIPIENT COMPATIBILITY STUDY TLC (thin layer chromatographic) method
It involved silica gel (F254) coated plates as stationary and ethyl acetate: toluene: butylamine (2:2:1; v/v/v) as mobile phases. Spots were evaluated at 254 nm.9
PREPARATION OF HSDs AND PMs
Preparation of HSDs (Hydrotropic Solid Dispersion)
Piroxicam (1.0g) was added to the aqueous medium (minimum quantity) maintained at a definite temperature (80-850 C) containing sodium benzoate (2.0 g), in the dissolved state, and stirred to obtain a semisolid mass. After evaporation, such the mass was spreaded for faster drying (60-650C). The pulverized mass was ground and repeatedly dried in an oven. The obtained dried powder (HSD) was sieved (# 100) and stored in an air-tight descicator for 6 days.
PM of Piroxicam & sodium benzoate [1:4 & 1:6 (w/w)], Piroxicam & sodium acetate [1:2, 1:4 & 1:6 (w/w)] and Piroxicam & ascorbic acid [1:2, 1:4 & 1:6 (w/w)] were also prepared adopting the similar method as mentioned above.
Preparation of PM (Physical Mixtures)
Piroxicam and sodium benzoate (1:2 w/w) were accurately weighed and triturated intensely (10 min) following mechanical sifting (# 100). Piroxicam & sodium benzoate [1:4 & 1:6 (w/w)], Piroxicam & sodium acetate [1:2, 1:4 & 1:6 (w/w)] and Piroxicam & ascorbic acid [1:2, 1:4 & 1:6 (w/w)] were obtained with similar methods also (Table 1).10
EVALUATION OF HSDs AND PMs
Estimation of drug in prepared HSDs and PMs
Powdered HSD/PM containing Piroxicam (10 mg equivalent) was added with 50 ml of distilled water was added and shaken for complete dissolution. Finally, the volume was adjusted (100 ml) with distilled water. The absorbance was determined at respective wavelengths against the blank. The regression equation was used to estimate the drug content.
Dissolution rate studies of Pure drug, PMs and HSDs
The stirrer was adjusted (50 rpm) and (37° ± 0.5°C) which was kept constant. The definite volumes (5 ml), of the withdrawn medium at fixed time intervals, were diluted suitably and analyzed. Absorbances of suitably diluted samples were determined at respective wavelengths against the blank.11 The most suitable HSD was chosen for development of MDT.
PRE COMPRESSION PARAMETERS
Hydrotropic Solid Dispersion as selected in above study was examined for various parameters i.e. bulk density, tapped density, Hausner’s ratio, Carr’s index and angle of repose.
FORMULATION OF MOUTH DISSOLVING TABLETS OF PIROXICAM
Primarily, six batches of tablets were designed and prepared by direct compression method to screen out different superdisintegrants.
Such tablets contained solid dispersion (20mg Piroxicam equivalents), Mannitol, Saccharin, MCC, Camphor, Menthol,
Magnesium stearate and different superdisintegrants. Weight of tablets was kept constant in each batch (Table 2).
EXPERIMENTAL DESIGN
A 32 full factorial design was performed and the runs were conducted for all possible combinations. The independent variables were % of superdisintegrant (Crospovidone) (X) (2, 3.5 & 5) and % of subliming agent (Camphor) (Y) (0, 5 & 10), narrated as Factor A and B respectively (Table 3,4).
POST COMPRESSION EVALUATION PARAMETERS
Hardness, Thickness, Friability, Uniformity of weight, Disintegration time, Wetting time, Water Absorption Ratio, In-vitro dissolution studies, Optimization and Accelerated stability were studied as post compression parameters as per official descriptions.12-15
RESULTS AND DISCUSSION
EQUILIBRIUM SOLUBILITY DETERMINATIONS
Solubility enhancement ratios with selected hydrotropes were determined (Table 5).
TLC METHOD
The Rf values of Piroxicam (0.74-0.76), were somewhat similar, obtained with the pure drug and that in combinations with different ingredients, which confirmed the drug compatibility (fig. 2).
EVALUATION OF SOLID DISPERSIONS AND PHYSICAL MIXTURES
Determination of drug content
Drug content of each formulation was determined as summarized in Table 6.
In-vitro dissolution studies of pure drug, PMs and HSDs
Percent drug release obtained with pure drug, physical mixture and hydrotropic solid dispersion was compared and results were depicted in fig.3. Evidently, 1:6 ratio of Drug: Sodium benzoate (HSD) gave most significant release in distilled water as compared to its counterpart i.e. PM. Hence, HSD was chosen for further studies and PM was discarded.
EVALUATION PARAMETERS FOR TABLET FORMULATIONS
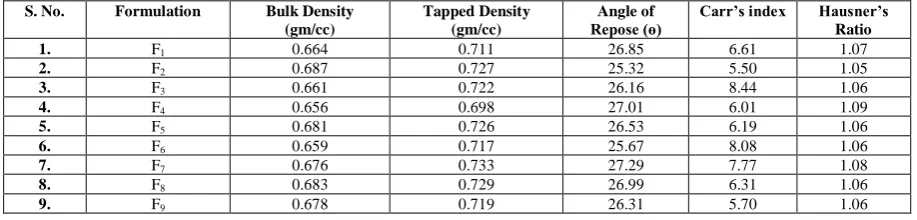
Pre-compression parameters for trial batches
Results obtained with (T1-T6) formulations showed that ranges of different pre-compression parameters were: Bulk density (0.657-0.682gm/cc), Tapped density (0.712-0.737gm/cc), Angle of Repose (25.24-27.540), Carr’s index (6.03-8.87%) and Hausner’s ratio (1.06-1.09).
Post-compression parameters for trial batches
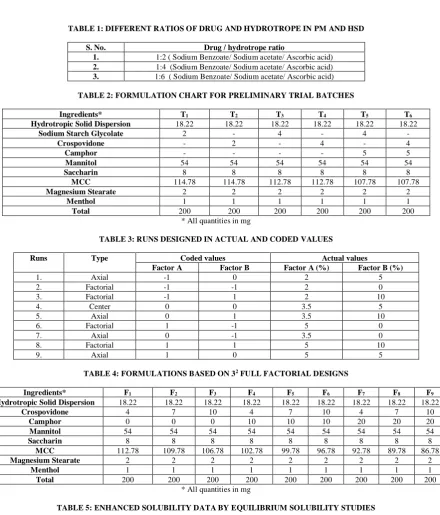
TABLE 1: DIFFERENT RATIOS OF DRUG AND HYDROTROPE IN PM AND HSD
S. No. Drug / hydrotrope ratio
1. 1:2 ( Sodium Benzoate/ Sodium acetate/ Ascorbic acid)
2. 1:4 (Sodium Benzoate/ Sodium acetate/ Ascorbic acid)
3. 1:6 ( Sodium Benzoate/ Sodium acetate/ Ascorbic acid)
TABLE 2: FORMULATION CHART FOR PRELIMINARY TRIAL BATCHES
Ingredients* T1 T2 T3 T4 T5 T6
Hydrotropic Solid Dispersion 18.22 18.22 18.22 18.22 18.22 18.22
Sodium Starch Glycolate 2 - 4 - 4 -
Crospovidone - 2 - 4 - 4
Camphor - - - - 5 5
Mannitol 54 54 54 54 54 54
Saccharin 8 8 8 8 8 8
MCC 114.78 114.78 112.78 112.78 107.78 107.78
Magnesium Stearate 2 2 2 2 2 2
Menthol 1 1 1 1 1 1
Total 200 200 200 200 200 200
* All quantities in mg
TABLE 3: RUNS DESIGNED IN ACTUAL AND CODED VALUES
Runs Type Coded values Actual values
Factor A Factor B Factor A (%) Factor B (%)
1. Axial -1 0 2 5
2. Factorial -1 -1 2 0
3. Factorial -1 1 2 10
4. Center 0 0 3.5 5
5. Axial 0 1 3.5 10
6. Factorial 1 -1 5 0
7. Axial 0 -1 3.5 0
8. Factorial 1 1 5 10
9. Axial 1 0 5 5
TABLE 4: FORMULATIONS BASED ON 32 FULL FACTORIAL DESIGNS
Ingredients* F1 F2 F3 F4 F5 F6 F7 F8 F9
Hydrotropic Solid Dispersion 18.22 18.22 18.22 18.22 18.22 18.22 18.22 18.22 18.22
Crospovidone 4 7 10 4 7 10 4 7 10
Camphor 0 0 0 10 10 10 20 20 20
Mannitol 54 54 54 54 54 54 54 54 54
Saccharin 8 8 8 8 8 8 8 8 8
MCC 112.78 109.78 106.78 102.78 99.78 96.78 92.78 89.78 86.78
Magnesium Stearate 2 2 2 2 2 2 2 2 2
Menthol 1 1 1 1 1 1 1 1 1
Total 200 200 200 200 200 200 200 200 200
* All quantities in mg
TABLE 5: ENHANCED SOLUBILITY DATA BY EQUILIBRIUM SOLUBILITY STUDIES
Hydrotrope solution Conc. of hydrotrope Solubility (mg/ml) Solubility enhancement ratio
Distilled water - 0.231 -
Ascorbic acid 20% 2.426 10.50
Sodium benzoate 20% 8.262 35.76
Sodium acetate 20% 3.112 13.47
TABLE 6: DRUG CONTENT IN PHYSICAL MIXTURE AND HYDROTROPIC SOLID DISPERSION
Hydrotrope Drug hydrotrope ratio Percent Drug Content
PM HSD
Ascorbic Acid
1:2 91.34 95.18
1:4 92.67 95.37
1:6 93.89 96.62
Sodium Benzoate
1:2 97.34 99.78
1:4 98.67 99.89
1:6 98.78 99.12
Sodium Acetate
1:2 93.45 95.92
1:4 94.66 96.73
TABLE 7: RESULTS OF PRE-COMPRESSION PARAMETERS FOR FACTORIAL BATCHES (F1-F9)
S. No. Formulation Bulk Density
(gm/cc)
Tapped Density (gm/cc)
Angle of
Repose (ɵ) Carr’s index Hausner’s Ratio
1. F1 0.664 0.711 26.85 6.61 1.07
2. F2 0.687 0.727 25.32 5.50 1.05
3. F3 0.661 0.722 26.16 8.44 1.06
4. F4 0.656 0.698 27.01 6.01 1.09
5. F5 0.681 0.726 26.53 6.19 1.06
6. F6 0.659 0.717 25.67 8.08 1.06
7. F7 0.676 0.733 27.29 7.77 1.08
8. F8 0.683 0.729 26.99 6.31 1.06
9. F9 0.678 0.719 26.31 5.70 1.06
TABLE 8: RESULTS OF POST-COMPRESSION PARAMETERS FOR FACTORIAL BATCHES (F1-F9)
S. No.
Formulation Thickness
(mm)
Friability (%)
Hardness (kg)
Weight variation
D.T (sec)
Average wetting time (sec)
Water absorption ratio (%)
1. F1 2.64 0.348 4.7 Passed 33 36 65.24
2. F2 2.49 0.373 4.5 Passed 30 32 67.46
3. F3 2.59 0.401 4.3 Passed 27 29 70.97
4. F4 2.46 0.448 4.2 Passed 25 28 70.05
5. F5 2.48 0.476 4.1 Passed 23 25 78.72
6. F6 2.61 0.503 3.8 Passed 21 23 80.46
7. F7 2.48 0.535 3.4 Passed 16 18 82.14
8. F8 2.54 0.562 3.1 Passed 14 17 83.52
9. F9 2.64 0.591 3.2 Passed 12 15 85.56
TABLE 9: MULTIPLE REGRESSION ANALYSIS FOR DEPENDENT VARIABLE
For Disintegration Time
Polynomial equation Y = 23.00 – 2.33A – 8.00B + 0.50AB + 1.692E-015A2 -1B2 eq. (1)
Correlation coefficient 0.9992
A B AB A2 B2
X Coefficient -2.33 -8.00 0.50 1.692E-015 -1
P value 0.0004 <0.0001 0.057 1 0.024
For % Friability
Polynomial equation Y = 0.48 + 0.027A + 0.094B +7.500E-004 +6.667E-004 -7.333E-003 eq. (2)
Correlation coefficient 1
A B AB A2 B2
X Coefficient FM 0.027 0.094 7.500E-004 6.667E-004 -7.333E-003
P value <0.0001 <0.0001 0.126 0.278 0.0007
TABLE 10: PREDICTED SOLUTION FOR OPTIMIZED BATCH (F9)
Factor A (Crospovidone) (mg) Factor B (Camphor) (mg) D.T (sec) Friability (%) Desirability Remarks
10.00 20.00 12.00 0.591 1.000 Selected
Figure 2: Photographic representation of TLC
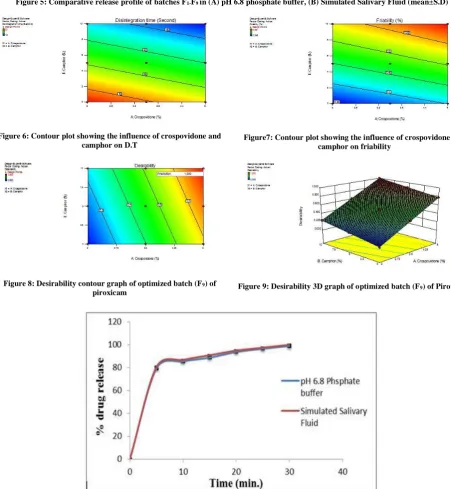
Figure 5: Comparative release profile of batches F1-F9 in (A) pH 6.8 phosphate buffer, (B) Simulated Salivary Fluid (mean±S.D)
Figure 6: Contour plot showing the influence of crospovidone and
camphor on D.T Figure7: Contour plot showing the influence of crospovidone and camphor on friability
Figure 8: Desirability contour graph of optimized batch (F9) of
piroxicam Figure 9: Desirability 3D graph of optimized batch (F9) of Piroxicam
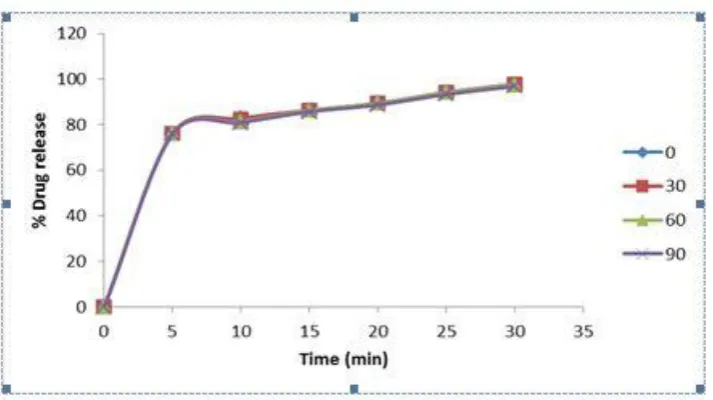
Figure 11: Comparative release profile formulation at different time intervals (0, 30, 60 and 90 days) on stability
In-vitro dissolution studies of trial batches
In-vitro dissolution study of trial batches (in pH 6.8 phosphate buffer) revealed T6 as the best trial batch which was further subjected to optimization study (Fig. 4).
Pre-compression parameters for factorial batches
Various inferred results were as mentioned in the table (Table 7) below.
Post-compression parameters for factorial batches
Various results were as mentioned in Table 8.
In-vitro dissolution studies of factorial batches
Prepared factorial batches were also evaluated for release characteristics in two different media i.e. pH 6.8 phosphate buffer and Simulated Salivary Fluid (Fig. 5).
OPTIMIZATION STUDY
Effect of crospovidone and camphor on D.T
It wasobservedfrom eq. (1) that A and B factors significantly affected D.T with p < 0.05(negatively); while the coefficients of A, B, AB & B2 also significant negative effects at p ≤ 0.05 (Table 9, Fig.6).
Effect of crospovidone and camphor on Friability
The findings revealed that A and B factors elicited significant positive effect on Friability (p < 0.05); indicating increased response proportionately. It was observed from eq. (2) that the coefficient of A, B and B2 showed significant positive effects at
p < 0.05 (Table 9, Fig. 7). From the above figures (Fig. 6,7), it was interpreted that disintegration time decreased from blue to orange owing to increase in camphor in the first response graph. Friability was affected by both % of camphor and Crospovidone in the second response surface graph.
The optimized study, applied to factorially designed batches (F1 -F9), revealed the predicted solution data as depicted in Table10, Fig.8,9.
Hence, F9 formulation was considered as the optimized batch. The optimized formulation (F9) exhibited 98.88% & 99.97% release (in 30 minutes) in pH 6.8 phosphate buffer and Simulated Salivary Fluid respectively (Fig. 10).
STABILITY STUDY OF OPTIMIZED FORMULATION
As per ICH guidelines under officially prescribed conditions (400±20C/75%±5%RH), the performed stability studies revealed that optimized formulation was stable and thus complied with dose conformity criterion (Fig.11).
DISCUSSION
A significantly large portion of an active drug moiety scapes gastrointestinal absorption when applied in conventional dosage forms i.e. tablet, suspension, capsules etc. This amounts to frequent administration pertaining to its low bioavailability. Conclusively, such formulation strategies could be applied to different categories of drugs bringing about their enhanced water solubility and the emerging oral dosage forms would also impart higher bioavailability to the incorporated medicament(s). The work would definitely torch newer path for future research arena.
ACKNOWLEDGEMENTS
Authors want to thanks to College of Pharmacy, Teerthanker Mahaveer University, Uttar Pradesh for providing research facilities and Ramdev chemicals for providing drug sample.
REFERENCES
1. Khadka P, Ro J, Hyeongmin K, Iksoo K, Jeong TK. Pharmaceutical Particle Technologies: An Approach to improve drug solubility, dissolution and bioavailability. Asian Journal of Pharmaceutical Sciences 2014;9;304-316.
2. Patil MR, Gujarathi NA, Rane BR. Formulation and Evaluation of mouth dissolving tablet: Review Article. Pharma Science Monitor 2014;5(2);7-20.
3. Luhadiya A, Agrawal S, Jain P, Dubey PK. A Review on Solid dispersion.International Journal of Advance Research in Pharmaceutical and Biosciences 2012;2(2);281-291.
Journal of Pharmacy and Pharmaceutical Sciences 2014;6(6); 1-7.
5. Kapadiya N, Singhvi I, Mehta K. Hydrotropy: A Promising tool for Solubility Enhancement: A Review. International Journal of Drug Development & Research 2011; 3(2); 26-33. 6. Ashish P, Harsoliya MS, Pathan JK, Shruti S. A Review: Formulation of Mouth dissolving tablets. International Journal of Pharmaceutical and Clinical Science 2011;1(1); 1-8.
7. Singh S, Shyale SS, Bhosale G. Formulation and Evaluation of Mouth dissolving tablets of Piroxicam. International Journal of Pharmaceutical Sciences and Nanotech 2015;8(3);2941-2946. 8. Maheshwari RK. Analysis of bulk sample of salicylic acid by application of hydrotropic solubilization method. Indian Journal of Pharmaceutical Sciences 2008; 823-825.
9. Starek M, Krzek, Rotkegel P. TLC determination of Piroxicam, Tenoxicam, Celecoxib and Rofecoxib in biological material. Journal of Analytical Chemistry 2015; 70(3); 351-359. 10. Madan JR., Kamate VJ, Awasthi R., Dua K. Recent Patents on Drug Delivery and Formulations. 2017, doi: 10.2174/1872211311666170427100213.
11. Maheshwari RK. Quantitative spectrophotometric determination of ornidazole tablet formulation using ibuprofen
sodium as hydrotropic solubilizing agent. Digest Journal of Nanomaterial and Biostructure 2010;5(1); 97-100.
12. Kumar R, Patil S, Patil MB, et al. Formulation Evaluation of Mouth dissolving tablets of Fenofibrate using sublimation technique. International Journal of Chemical Technology and Research 2009;1(4);840-850.
13. Garg A, Gupta MM. Taste masking and formulation development & evaluation of mouth dissolving tablets of Levocetrizine dihydrochloride. Journal of Drug Delivery & Therapeutics. 2013;3(3); 123-130.
14. Khemariya P, Gajbhiye KR, Vaidya VD, et al. Preparation and evaluation of mouth dissolving tablets of Meloxicam. International Journal of Drug Delivery 2010;2;76-80.
15. Rane DR, Gulve HN, Patil VV, et al. Formulation and evaluation of fast dissolving tablet of Albendazole.International Current Pharmaceutical Journal 2012;1(10); 311-316.
Cite this article as:
Akhil Sharma et al. Formulation, optimization and evaluation of mouth dissolving tablets of piroxicam using hydrotropic solubilization technique. Int. Res. J. Pharm. 2017;8(12):91-98 http://dx.doi.org/10.7897/2230-8407.0812255
Source of support: Nil, Conflict of interest: None Declared