Pediatric Medical Complexity Algorithm: A New
Method to Stratify Children by Medical Complexity
WHAT’S KNOWN ON THIS SUBJECT: Quality measures developed by the Pediatric Quality Measures Program are required to assess disparities in performance according to special health care need status. Methods are needed to identify children according to level of medical complexity in administrative data.
WHAT THIS STUDY ADDS: The Pediatric Medical Complexity Algorithm is a new, publicly available algorithm that identifies the small proportion of children with complex chronic disease in Medicaid claims and hospital discharge data with good sensitivity and good to excellent specificity.
abstract
OBJECTIVES:The goal of this study was to develop an algorithm based on International Classification of Diseases, Ninth Revision, Clinical Modification (ICD-9-CM), codes for classifying children with chronic disease (CD) according to level of medical complexity and to assess the algorithm’s sensitivity and specificity.
METHODS:A retrospective observational study was conducted among 700 children insured by Washington State Medicaid with$1 Seattle Children’s Hospital emergency department and/or inpatient en-counter in 2010. The gold standard population included 350 children with complex chronic disease (C-CD), 100 with noncomplex chronic disease (NC-CD), and 250 without CD. An existing ICD-9-CM–based algorithm called the Chronic Disability Payment System was modified to develop a new algorithm called the Pediatric Medical Complexity Algorithm (PMCA). The sensitivity and specificity of PMCA were assessed.
RESULTS: Using hospital discharge data, PMCA’s sensitivity for cor-rectly classifying children was 84% for C-CD, 41% for NC-CD, and 96% for those without CD. Using Medicaid claims data, PMCA’s sensitivity was 89% for C-CD, 45% for NC-CD, and 80% for those without CD. Specificity was 90% to 92% in hospital discharge data and 85% to 91% in Medicaid claims data for all 3 groups.
CONCLUSIONS:PMCA identified children with C-CD (who have accessed tertiary hospital care) with good sensitivity and good to excellent specificity when applied to hospital discharge or Medicaid claims data. PMCA may be useful for targeting resources such as care coordination to children with C-CD.Pediatrics2014;133:e1647–e1654
AUTHORS:Tamara D. Simon, MD, MSPH,a,bMary Lawrence
Cawthon, MD, MPH,cSusan Stanford, MPH, MSW,bJean
Popalisky, DNP, RN,bDorothy Lyons, MPA,cPeter Woodcox,
BA,cMargaret Hood, MD,aAlex Y. Chen, MD, MS,dand Rita
Mangione-Smith, MD, MPH,a,bfor the Center of Excellence
on Quality of Care Measures for Children with Complex Needs (COE4CCN) Medical Complexity Working Group
aDepartment of Pediatrics, University of Washington/Seattle
Children’s Hospital, Seattle, Washington;bSeattle Children’s
Research Institute, Seattle, Washington;cResearch and Data
Analysis Division, Washington Department of Social and Health Services, Olympia, Washington; anddDepartment of Pediatrics,
Children’s Hospital Los Angeles, Keck School of Medicine at the University of Southern California, Los Angeles, California
KEY WORDS
administrative data, claims data, children, medical complexity, sensitivity, specificity, stratification, validation
ABBREVIATIONS
C-CD—complex chronic disease CD—chronic disease
CDPS—Chronic Illness and Disability Payment System COE4CCN—Center of Excellence on Quality of Care Measures for Children with Complex Needs
CRG—Clinical Risk Group ED—emergency department
ICD-9-CM—International Classification of Diseases, Ninth Revi-sion, Clinical Modification
NC-CD—noncomplex chronic disease PMCA—Pediatric Medical Complexity Algorithm PQMP—Pediatric Quality Measures Program SCH—Seattle Children’s Hospital
WA-Medicaid—Washington State Medicaid
(Continued on last page)
Healthcare Research and Quality part-nered to fund 7 Centers of Excellence that constitute the Pediatric Quality Measures Program (PQMP) mandated by the 2009 Child Health Insurance Program Reauthorization Act.1 The charge to the PQMP is to develop new quality of care measures and/or en-hance existing measures for children’s health care across the age spectrum.2,3 The Center of Excellence on Quality of Care Measures for Children with Com-plex Needs (COE4CCN) was charged with identifying and/or developing a valid method to assess disparities in care according to level of medical complexity for children with special health care needs.
COE4CCN initially considered several methods to classify children according to level of medical complexity but chose to focus on algorithms that use
International Classification of Dis-eases, Ninth Revision, Clinical Modifi -cation (ICD-9-CM), codes. Although limited by reliance on billing data,4 approaches based on ICD-9-CM codes are relatively inexpensive to use compared with survey methods, can be used on existing administrative data with relative efficiency, and are favored by states and insurance plans. Although several proprietary ICD-9-CM–based algorithms might be used for these purposes, the mandate was to identify or develop a tool that was open access and publicly available for widespread use in quality measure-ment. After reviewing and evaluating several existing algorithms,5–14 we chose to modify the Chronic Disability Payment System (CDPS) algorithm.12 The objectives of the present study were to develop the modified version of CDPS and assess its sensitivity and specificity for correctly identifying children with varying levels of medical complexity.
This development and validation re-search was undertaken in 5 stages: (1) development of consensus defi -nitions for 3 levels of medical com-plexity; (2) selection of an existing ICD-9-CM algorithm; (3) modification of the algorithm to conform to the consensus medical complexity defi -nitions; (4) selection of a gold stan-dard population of children through medical record review; and (5) eval-uation of the modified algorithm’s sensitivity and specificity when ap-plied to the gold standard pop-ulation. All study procedures were reviewed and approved by the in-stitutional review boards of Seattle Children’s Research Institute and Washington State.
Developing Consensus Definitions
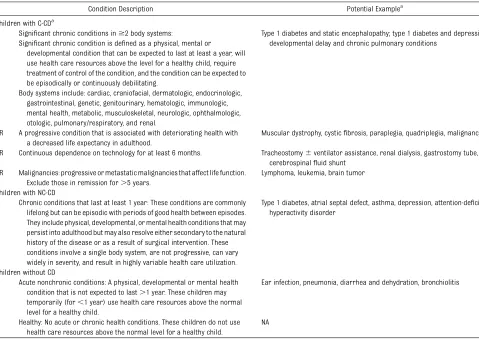
To develop an algorithm that would facilitate assessment of disparities according to special health care need status, COE4CCN developed consensus definitions for 3 levels of medical complexity: children with complex chronic disease (C-CD), children with noncomplex chronic disease (NC-CD), and children without chronic disease (CD) (Table 1). The COE4CCN Medical Complexity Working Group developed the first draft of these consensus definitions after review and discus-sion of 2 previously published care coordination conceptual frameworks and their accompanying definitions for levels of medical complexity.15,16 The working group is composed of individuals with expertise in inpatient and outpatient management of chil-dren with C-CD and/or NC-CD. The en-tire COE4CCN then provided review and feedback on the draft consensus definitions. COE4CCN includes 43 rep-resentatives from 2 state Medicaid agencies, Family Voices, pediatric nursing, hospital medicine, and out-patient primary care, as well as
pedi-porated the center-wide feedback.
Algorithm Identification
After evaluating several existing algorithms,5–14 we chose to modify CDPS,12 which is a diagnosis-based risk adjustment model that uses ICD-9-CM codes to assess risk of in-curring high costs.17 CDPS was se-lected because it has the most comprehensive listing of ICD-9-CM codes among the algorithms evalu-ated, is publicly available, and, in contrast to most other algorithms, includes important codes for mental health conditions.
Algorithm Modification
We developed and evaluated a novel algorithm for this study, the Pediatric Medical Complexity Algorithm (PMCA). PMCA represents a modification of CDPS that conforms to the COE4CCN consensus definitions for medical complexity. CDPS modification involved removing several types of ICD-9-CM codes, including those consistent with adult illness (eg, myocardial infarc-tion), related to childbirth, consistent with acute illness (eg, acute otitis media), and representing pediatric chronic conditions that are most often mild in severity (eg, eczema, myopia, iron deficiency anemia). Excluding codes for conditions with a substantial pro-portion of mild disease (eg, eczema) from PMCA reduces the potential for overestimation of disease burden in the population (ie, false-positive findings). However, this process may result in children with more severe forms of such diseases not being captured or correctly classified (ie, false-negativefindings).
deteriorating health and an increased risk of shorter life expectancy in adulthood (defined as death in the fourth tofifth decade [eg, cysticfi bro-sis, complex congenital heart disease, malignancy]) were flagged as pro-gressive; when consensus was not im-mediately reached, life expectancy data for the condition were reviewed, and a final decision was made. Body system flags were also assigned to permit body system counts and sub-sequent classification to NC-CD (1 body system) or C-CD ($2 body systems). A full list of the ICD-9-CM codes included in PMCA, and their progressive and body systemflags, is provided in Sup-plemental Table 5. SAS programming code (SAS Institute, Inc, Cary, NC) was
subsequently developed for PMCA to categorize children into the 3 levels of medical complexity based on adjudi-cated claims.
To capture data on children with C-CD based on technology dependence for
.6 months (Table 1), we adapted a previously developed set of tech-nology assistance ICD-9-CM codes18 and tested PMCA’s sensitivity and specificity with and without these ad-ditional codes.
Identifying a Gold Standard Population: Classifying Children by Medical Complexity By Using Medical Record Review
Children 0 to 18 years old, insured by Washington State Medicaid
(WA-Medicaid), and seen at Seattle Chil-dren’s Hospital (SCH) for $1 emer-gency department (ED) visit and/or inpatient stay in 2010 were potentially eligible for the study. To oversample children in the C-CD group, these children were categorized into 1 of 9 mutually exclusive risk groups by us-ing 3M Clinical Risk Group (CRG) soft-ware (St Paul, MN)19applied to 4 years (2007–2010) of SCH ED, inpatient, and day surgery administrative data. After CRG categorization, a sample of 1000 children was randomly selected, with oversampling (n = 500) for children with lifelong chronic conditions (CRG groups 5b, 6, 7, 8, and 9).
A trained nurse researcher (J.P.) blinded to CRG categorization made TABLE 1 COE4CCN Consensus Definitions of 3 Levels of Medical Complexity
Condition Description Potential Examplea
Children with C-CDa
Significant chronic conditions in$2 body systems: Type 1 diabetes and static encephalopathy; type 1 diabetes and depression; developmental delay and chronic pulmonary conditions
Significant chronic condition is defined as a physical, mental or
developmental condition that can be expected to last at least a year, will use health care resources above the level for a healthy child, require treatment of control of the condition, and the condition can be expected to be episodically or continuously debilitating.
Body systems include: cardiac, craniofacial, dermatologic, endocrinologic, gastrointestinal, genetic, genitourinary, hematologic, immunologic, mental health, metabolic, musculoskeletal, neurologic, ophthalmologic, otologic, pulmonary/respiratory, and renal.
OR A progressive condition that is associated with deteriorating health with a decreased life expectancy in adulthood.
Muscular dystrophy, cysticfibrosis, paraplegia, quadriplegia, malignancy
OR Continuous dependence on technology for at least 6 months. Tracheostomy6ventilator assistance, renal dialysis, gastrostomy tube, cerebrospinalfluid shunt
OR Malignancies: progressive or metastatic malignancies that affect life function. Exclude those in remission for.5 years.
Lymphoma, leukemia, brain tumor
Children with NC-CD
Chronic conditions that last at least 1 year: These conditions are commonly lifelong but can be episodic with periods of good health between episodes. They include physical, developmental, or mental health conditions that may persist into adulthood but may also resolve either secondary to the natural history of the disease or as a result of surgical intervention. These conditions involve a single body system, are not progressive, can vary widely in severity, and result in highly variable health care utilization.
Type 1 diabetes, atrial septal defect, asthma, depression, attention-deficit/ hyperactivity disorder
Children without CD
Acute nonchronic conditions: A physical, developmental or mental health condition that is not expected to last.1 year. These children may temporarily (for,1 year) use health care resources above the normal level for a healthy child.
Ear infection, pneumonia, diarrhea and dehydration, bronchiolitis
Healthy: No acute or chronic health conditions. These children do not use health care resources above the normal level for a healthy child.
NA
NA, not applicable.
aThe examples used in this document to illustrate definitions of medical complexity and chronicity are intended to demonstrate characteristics specified in the definition/descriptions. It is not
our intention to imply that specific diseases and conditions are by default linked to the categories that they were used to illustrate.
reviewing all available SCH electronic medical records. When level assign-ment was unclear, cases were re-viewed by a panel of physicians (T.D.S., A.Y.C., M.H., and R.M.-S.) also blinded to CRG categorization, and assignments were made by consensus. Among the sample of 1000 randomly selected children, medical records were re-viewed until the target gold standard population of 700 children was as-sembled. The target population in-cluded 350 children with C-CD, 100 with NC-CD, and 250 without CD. These sample sizes were determined a priori to allow for stable estimates of PMCA’s sensitivity and specificity for correctly classifying patients into the 3 levels of complexity.
Almost all (699 of 700) of the gold standard population children were
successfully matched in the
WA-Medicaid claims database. Twenty individuals .18 years old were ex-cluded because they were not eligible for WA-Medicaid for substantial por-tions of the study period and had in-complete claims data. One child having only secondary Medicaid coverage was also excluded. The final WA-Medicaid study sample numbered 678, whereas all 700 children were included in the SCH study sample.
teristics for the 678 study children were compared with the overall WA-Medicaid– insured child population from 2009 to 2011.
Algorithm Evaluation
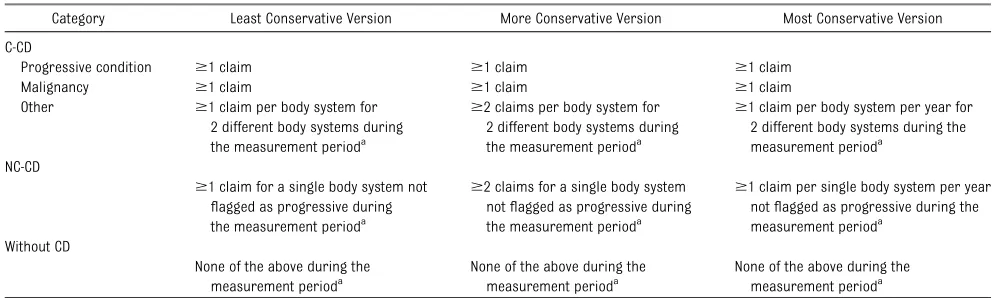
Three versions of the PMCA SAS code were developed to characterize the timing and frequency of coded con-ditions from administrative data: the least, more, and most conservative versions described in Table 2. Children in the sample had up to 3 years of data available for analysis in both the SCH and WA-Medicaid claims databases, 1 year before and 1 year after the year of their hospitalization or ED visit (ie, January 1, 2009–December 31, 2011). All children were included regardless of how much data they had available to contribute to the analysis. All children in both the SCH and WA-Medicaid samples had at least 1 claim in 2010 that represented the ED and/or in-patient encounter making them eli-gible for gold standard population selection.
We determined PMCA’s sensitivity and specificity for correctly classifying children into the 3 levels of complexity by using SCH discharge and WA-Medicaid claims data. SCH data in-cluded administrative claims from
inpatient and outpatient claims pro-vided to the state. We also evaluated the performance of 3 different ver-sions of the PMCA SAS code described in Table 2.
After applying the PMCA SAS code to SCH discharge and WA-Medicaid claims data, we examined cases misclassified by PMCA to determine if there were patterns that might inform future modifications to the algorithm.
RESULTS
Characteristics of the gold standard population were compared with the overall WA-Medicaid–insured pop-ulation of children (Table 3). The study sample was younger and more racially and ethnically diverse. A dis-proportionate number of study chil-dren had fee-for-service coverage (47% vs 20%) and prolonged Medic-aid eligibility (56% vs 46% with 36 months).
Using WA-Medicaid data, 536 (79%) of the study sample had 3 years of claims data to contribute to the analyses, 122 (18%) had 2 years, and only 20 (3%) had just 1 year. In contrast, using SCH data, 152 (22%) of the sample had 3 years, 252 (36%) had 2 years, and 296 (42%) had 1 year of claims data to contribute to analysis.
TABLE 2 Classification of Disease Complexity Based on Progressive and Body System Flags and Frequency of Encounters Observed in Administrative Data
Category Least Conservative Version More Conservative Version Most Conservative Version
C-CD
Progressive condition $1 claim $1 claim $1 claim
Malignancy $1 claim $1 claim $1 claim
Other $1 claim per body system for 2 different body systems during the measurement perioda
$2 claims per body system for 2 different body systems during the measurement perioda
$1 claim per body system per year for 2 different body systems during the measurement perioda
NC-CD
$1 claim for a single body system not
flagged as progressive during the measurement perioda
$2 claims for a single body system notflagged as progressive during the measurement perioda
$1 claim per single body system per year notflagged as progressive during the measurement perioda
Without CD
None of the above during the measurement perioda
None of the above during the measurement perioda
None of the above during the measurement perioda
Optimal performance conditions for PMCA in hospital discharge and Med-icaid claims data are shown in Table 4. Using up to 3 years of hospital
dis-charge data and the least conservative version of the PMCA code (Table 2), al-gorithm sensitivities for correctly classifying children were 84% for
chil-dren with C-CD, 41% for chilchil-dren with NC-CD, and 96% for children without CD. Using up to 3 years of WA-Medicaid claims data and the more conservative version of the PMCA code, sensitivities were 89% for children with C-CD, 45% for children with NC-CD, and 80% for children without CD. Specificity was good to excellent in both hospital (90%–92%) and Medicaid (85%–91%) data for all 3 levels of complexity according to the least and more con-servative PMCA code versions, re-spectively. The most conservative version of the PMCA code resulted in the highest rate of misclassification. Addition of the technology assistance codes did not improve PMCA’s sensi-tivity or specificity regardless of which version of the code was used (data not shown).
We identified 3 patterns of mis-classification in which PMCA (applied to either hospital discharge or Med-icaid claims data) categorized chil-dren in the gold standard population as having no CD who were determined to have NC-CD according to medical record review. The first pattern in-volved children with mild episodic conditions that were counted by the medical record reviewer as chronic but are not included in PMCA (eg, eczema, headache). The second pat-tern involved children with conditions that had largely resolved (eg, epilepsy but seizure-free for 2 years). For these cases, there was evidence for the condition in the medical record, but no health care utilization/claims for it during the study period (January 1, 2009–December 31, 2011). The third pattern involved children with mental health conditions or developmental delay, conditions that are commonly undercoded in claims data.3,20
Children determined to have NC-CD according to medical record review who were misclassified by PMCA as C-CD in both hospital and Medicaid TABLE 3 Demographic and Enrollment Characteristics of the Gold Standard Sample (n= 679) and
the Overall WA-Medicaid Population Between 2009 and 2011 (n= 829 012)
Characteristic Gold Standard Samplea
Overall Medicaid Populationb
Age as of December 31, 2010
,1 yc 54 (8%) 47 718 (6%)
1–4 yc 257 (38%) 205 469 (25%)
5–9 yc 146 (22%) 217 360 (26%)
10–14 yc 119 (17%) 191 674 (23%)
15–19 yc
103 (15%) 166 791 (20%) Male genderd
361 (53%) 416 628 (50%) Race/ethnicity
Whitec
252 (37%) 413 784 (50%)
Hispanic 145 (21%) 201 025 (24%)
Other/mixedc
170 (25%) 139 792 (17%) African Americanc
89 (13%) 48 399 (6%)
Asian 23 (3%) 26 032 (3%)
Written language
Englishc 497 (73%) 651 207 (79%)
Otherc 182 (27%) 177 805 (21%)
Coverage for majority of eligibility months
Fee-for-servicec 318 (47%) 169 708 (20%)
Managed carec 361 (53%) 659 304 (80%)
Months of medical assistance eligibility 2009–2011
,12 moc 17 (3%) 43 707 (5%)
13–24 moc 125 (18%) 185 536 (22%)
25–35 moc
158 (23%) 219 559 (27%) 36 moc
379 (56%) 380 210 (46%) PMCA more conservative approach designation
C-CDe
329 (47%) 51 851 (6%) NC-CDe
100 (14%) 134 764 (16%) Without CDe
249 (36%) 608 966 (74%) Not classifiablee
1 (0%) 33 431 (4%)
Data are presented asn(%).
aDemographic data were available for 679 children and claims data for 678, resulting in differentnvalues for the text and
table.
bWe used 3 years of claims data from 2009 to 2011 for children aged,19 years on July 1, 2010, with a minimum eligibility of 1
month in 2010 and 2 months in 2009–2011.
cStatistically significant based on the confidence interval for a proportion applied to the gold standard sample. dTwo children had missing gender data.
eStatistical tests were not performed because we deliberately oversampled children with C-CD for the gold standard
population.
TABLE 4 Sensitivity and Specificity for PMCA in SCH Discharge Data and WA-Medicaid Claims Data
Approach Algorithm C-CD NC-CD Without CD
Sensitivity Specificity Sensitivity Specificity Sensitivity Specificity SCH (n= 700) n= 350 n= 350 n= 100 n= 100 n= 250 n= 250
Least PMCAa 84 (80–88) 92 (89–94) 41 (32–51) 92 (85–96) 96 (93–98) 90 (86–93) More PMCA 73 (68–77) 96 (93–98) 19 (13–28) 94 (88–97) 100 (99–100) 72 (66–77) Most PMCA 66 (61–71) 96 (93–98) 1 (0–5) 99 (95–100) 100 (99–100) 57 (51–63) WA-Medicaid (n= 678) n= 329 n= 329 n= 100 n= 100 n= 249 n= 249
Least PMCA 91 (87–94) 79 (74–83) 37 (28–47) 88 (80–93) 69 (63–74) 94 (90–96) More PMCAa 89 (85–92) 85 (81–89) 45 (36–55) 91 (84–95) 80 (75–85) 91 (87–94) Most PMCA 78 (73–82) 90 (86–93) 16 (10–24) 95 (89–98) 95 (92–97) 75 (69–80)
Thenvalues are the number of children from the gold standard sample included in the designated category. Data are given as % (95% confidence interval).
aRecommended algorithm.
least 1 system (eg, asthma, repaired ventricular septal defect). In such cases, the resolved condition was not counted by the medical record re-viewer but did result in claims that were detected by using PMCA.
DISCUSSION
To enable assessment of disparities in care according to special health care need status, we developed a novel al-gorithm by modifying an existing ICD-9-CM–based algorithm (CDPS) to align with the COE4CCN consensus defi ni-tions for 3 levels of medical complex-ity. PMCA exhibited good sensitivity for correctly categorizing children with C-CD, excellent sensitivity for correctly categorizing children with-out CD, but poor sensitivity for correctly categorizing children with NC-CD. For optimal identification of these 3 groups of children using to Medicaid claims data, we recommend using the more conservative version of the PMCA code and up to 3 years of claims data when available. For hospi-tal discharge data (limited to ED, in-patient, and day surgery claims), we recommend using the least conserva-tive version of the PMCA code and up to 3 years of data when available. (The PMCA SAS code and documentation are available from the authors upon re-quest.)
In hospital discharge data, ICD-9-CM codes for chronic disease are rela-tively infrequent because they are assigned only at the time of an ED, inpatient, or day surgery encounter. As a result, the least conservative version of PMCA, in which only 1 use of an included ICD-9-CM code is required during a 3-year time period (Table 2), resulted in the best performance. In contrast, Medicaid claims data cap-ture far more health care utilization; therefore, the more conservative
during a 3-year time period, resulted in the best performance.
Children with NC-CD are the most dif-ficult to correctly identify by using administrative data. These conditions may be episodic for a given child and can encompass a wide range of se-verity, from mild to severe. This vari-ation results in highly fluctuating health care utilization over time within the NC-CD group. With hospital discharge data, PMCA misclassified children with NC-CD into both the without-CD and C-CD groups. Children with NC-CD who were misclassified according to PMCA as without CD in hospital data often had episodic disease, developmental con-cerns, or a resolving problem that required outpatient care. Although electronic medical records used for this study included outpatient, inpa-tient, and ED encounters, the hospital-based discharge data consisted of ED, inpatient, and day surgery claims. SCH outpatient claims were not available, thus constraining PMCA’s ability to cor-rectly detect conditions being man-aged exclusively in that setting. Due to the relative infrequency of encoun-ters in the SCH discharge data, we elected to use the least conservative version of PMCA (Table 2). However, this approach unfortunately increased the likelihood that false-positive findings would be observed in the C-CD group because only 1 claim for each of 2 separate body systems is required during the measurement period for classification into this group. This method potentially results in children who have a history of chronic disease in 2 body systems but resolved disease in at least 1 (NC-CD) being incorrectly classified according to PMCA as having C-CD.
In Medicaid claims data, PMCA more commonly misclassified children with NC-CD as having C-CD. Because our
and inpatient settings, substantial portions of a child’s care occurring in settings outside of SCH were not available to the reviewer; it is possible, therefore, that relevant conditions were not captured when categorizing children in the gold standard pop-ulation. In contrast, when PMCA was applied to Medicaid claims data, health care utilization both within and outside of SCH were available to in-form categorization. Replication of this study in a system in which all medical records data are available for review could potentially address this limitation.
We purposefully oversampled chil-dren with C-CD for the gold standard population (350 of 700); this pop-ulation therefore differs from the overall state Medicaid population. As expected with large numbers of chil-dren with C-CD, the study sample had more fee-for-service coverage and prolonged Medicaid eligibility. In ad-dition, the sample was younger and more racially and ethnically diverse than the state Medicaid population. Overall, 6% of children insured by WA-Medicaid from 2009 to 2011 were classified with C-CD, 16% with NC-CD, and 74% without CD.
experience poorer quality of care than either children with NC-CD or healthy children.
The present study had several additional limitations. Approaches relying on sec-ondary data containing ICD-9-CM codes are only as good as the completeness of the original sources. Therefore, children who do not interact with the health care system will lack the necessary in-formation to define their level of medical complexity, and children enrolled in$2 health plans will have incomplete en-counter information in both data sets. Furthermore, encounters for conditions that do not result in a claim will not be captured in administrative data. Any manual assessment of medical records data are subject to human error; how-ever, the reviewer for the present study is experienced in this type of review22 and brought cases in which she was unsure to the physician panel for
eval-uation. Assignment of the body system and progressiveflags to ICD-9-CM codes in PMCA was based on the clinical ex-perience of 2 authors; others may thus disagree with our designations of whether a condition is progressive or with body system assignments for con-ditions. Because this study targeted identification of children with C-CD, our gold standard population was drawn from a tertiary care hospital and was not representative of WA-Medicaid– insured children. Further validation work in other populations of children, including health systems in which most children primarily access out-patient care, is needed. We also an-ticipate the need for further changes to PMCA to ensure compatibility with future widespread adoption of In-ternational Classification of Diseases, 10th Revision, Clinical Modification, codes.
CONCLUSIONS
Despite its limitations and potential future revisions, PMCA is a new, publicly available algorithm that identified children with C-CD (who have accessed tertiary hospital care) with good sen-sitivity and good to excellent specificity when applied to either hospital dis-charge or Medicaid claims data. As health care reform is implemented, use of PMCA will be critical to target resources and services such as care coordination to children with the most needs.
ACKNOWLEDGMENTS
The COE4CCN Medical Complexity Work-ing Group also included Kim Arthur, Penny Knapp, Michael Murphy, Justine Nelson, Jeff Tenney, and Chuan Zhou. We appreciate feedback on the manu-script provided by Doug Opel.
REFERENCES
1. Dougherty D, Schiff J, Mangione-Smith R. The
Children’s Health Insurance Program Reau-thorization Act quality measures initiatives: moving forward to improve measurement,
care, and child and adolescent outcomes.
Acad Pediatr. 2011;11(suppl 3):S1–S10 2. Mangione-Smith R, Schiff J, Dougherty D.
Identifying children’s health care quality measures for Medicaid and CHIP: an
evidence-informed, publicly transparent expert process. Acad Pediatr. 2011;11 (suppl 3):S11–S21
3. Zima BT, Murphy JM, Scholle SH, et al. Na-tional quality measures for child mental
health care: background, progress, and next steps. Pediatrics. 2013;131(suppl 1): S38–S49
4. McCarthy EP, Iezzoni LI, Davis RB, et al. Does
clinical evidence support ICD-9-CM di-agnosis coding of complications? Med Care. 2000;38(8):868–876
5. Feudtner C, Christakis DA, Connell FA. Pe-diatric deaths attributable to complex
chronic conditions: a population-based study of Washington State, 1980-1997. Pe-diatrics. 2000;106(1 pt 2):205–209 6. Feudtner C, Hays RM, Haynes G, Geyer JR,
Neff JM, Koepsell TD. Deaths attributed to
pediatric complex chronic conditions:
na-tional trends and implications for sup-portive care services.Pediatrics. 2001;107 (6). Available at: www.pediatrics.org/cgi/
content/full/107/6/E99
7. Feudtner C, Silveira MJ, Christakis DA.
Where do children with complex chronic conditions die? Patterns in Washington State, 1980-1998. Pediatrics. 2002;109(4): 656–660
8. Feudtner C, Christakis DA, Zimmerman FJ, Muldoon JH, Neff JM, Koepsell TD. Char-acteristics of deaths occurring in chil-dren’s hospitals: implications for supportive
care services.Pediatrics. 2002;109(5):887– 893
9. Feudtner C, DiGiuseppe DL, Neff JM. Hos-pital care for children and young adults in
the last year of life: a population-based study.BMC Med. 2003;1:3
10. Perrin JM, Kuhlthau K, McLaughlin TJ, Ettner SL, Gortmaker SL. Changing patterns of conditions among children receiving
Sup-plemental Security Income disability benefits.
Arch Pediatr Adolesc Med. 1999;153(1):80–84 11. Kuhlthau KA, Beal AC, Ferris TG, Perrin JM. Comparing a diagnosis list with a survey
method to identify children with chronic
conditions in an urban health center.
Ambul Pediatr. 2002;2(1):58–62
12. University of California, San Diego. Chronic
Illness and Disability Payment System. Available at: http://cdps.ucsd.edu/index. html. Accessed April 15, 2013
13. van der Lee JH, Mokkink LB, Grootenhuis MA, Heymans HS, Offringa M. Definitions
and measurement of chronic health con-ditions in childhood: a systematic review.
JAMA. 2007;297(24):2741–2751
14. Fishman PA, Shay DK. Development and estimation of a pediatric chronic disease score using automated pharmacy data.
Med Care. 1999;37(9):874–883
15. Antonelli RC, McAllister JW, Popp J.Making Care Coordination a Critical Component of the Pediatric Health System: A Multidisci-plinary Framework. New York, NY: Common-wealth Fund; 2009
16. McDonald KM, Schultz E, Albin L, et al.Care Coordination Atlas Version 3 (Prepared by Stanford University under subcontract to Battelle on Contract N. 290-04-0020). AHRQ Publication No. 11-0023. Rockville, MD: Agency for Healthcare Research and Quality. November 2010
17. Kronick R, Gilmer T, Dreyfus T, Lee L.
18. Berry JG, Hall DE, Kuo DZ, et al. Hospital utili-zation and characteristics of patients experi-encing recurrent readmissions within children’s hospitals.JAMA. 2011;305(7):682–690 19. Hughes JS, Averill RF, Eisenhandler J, et al.
Clinical Risk Groups (CRGs): a classification
Med Care. 2004;42(1):81–90
20. Kuhlthau K, Jellinek M, White G, Vancleave J, Simons J, Murphy M. Increases in behav-ioral health screening in pediatric care for Massachusetts Medicaid patients. Arch Pediatr Adolesc Med. 2011;165(7):660–664
population for clinical and research ini-tiatives.Pediatrics. 2011;127(3):529–538 22. Neff JM, Clifton H, Park KJ, et al. Identifying
children with lifelong chronic conditions for care coordination by using hospital discharge data.Acad Pediatr. 2010;10(6):417–423
(Continued fromfirst page)
Dr Simon helped design the study, modified the Chronic Illness and Disability Payment System algorithm to develop the Pediatric Medical Complexity Algorithm, reviewed cases in developing the gold standard population, and drafted the initial manuscript; Dr Cawthon helped design the study, supervised the analyses in Medicaid data, reviewed and revised the manuscript, and takes responsibility for the integrity of the Medicaid data and accuracy of the Medicaid data analysis; Ms Stanford conducted the analyses in hospital discharge data, critically reviewed the manuscript, and takes responsibility for the integrity of the hospital data and accuracy of the hospital data analysis; Ms Popalisky performed chart review to identify the gold standard population, discussed cases with the physician panel, and critically reviewed the manuscript; Ms Lyons and Mr Woodcox conducted the analyses in Medicaid claims data and critically reviewed the manuscript; Drs Hood and Chen reviewed cases in developing the gold standard population and critically reviewed the manuscript; and Dr Mangione-Smith conceptualized and designed the study, modified the Chronic Illness and Disability Payment System algorithm to develop the Pediatric Medical Complexity Algorithm, reviewed cases in developing the gold standard population, and reviewed and revised the manuscript. All authors approved thefinal manuscript as submitted.
The contents of this article are solely the responsibility of the authors and do not necessarily represent the official view of the sponsors. None of the sponsors participated in design and conduct of the study; collection, management, analysis, and interpretation of the data; or preparation, review, or approval of the manuscript.
www.pediatrics.org/cgi/doi/10.1542/peds.2013-3875
doi:10.1542/peds.2013-3875
Accepted for publication Feb 27, 2014
Address correspondence to Tamara D. Simon, MD, MSPH, Seattle Children’s Research Institute, Building 1, M/S JMB-9, 1900 Ninth Ave, Seattle, WA 98101. E-mail: tamara.simon@seattle childrens.org
PEDIATRICS (ISSN Numbers: Print, 0031-4005; Online, 1098-4275).
Copyright © 2014 by the American Academy of Pediatrics
FINANCIAL DISCLOSURE:The authors have indicated they have nofinancial relationships relevant to this article to disclose.
FUNDING:This study was done under funding from a cooperative agreement with the Agency for Healthcare Research and Quality and Centers for Medicare and Medicaid Services, grant #U18HS020506, part of the Children’s Health Insurance Program Reauthorization Act Pediatric Quality Measures Program. Dr Simon is also supported by award K23NS062900 from the National Institute of Neurological Disorders and Stroke. Funded by the National Institutes of Health (NIH).
DOI: 10.1542/peds.2013-3875 originally published online May 12, 2014;
2014;133;e1647
Pediatrics
Mangione-Smith
Dorothy Lyons, Peter Woodcox, Margaret Hood, Alex Y. Chen and Rita
Tamara D. Simon, Mary Lawrence Cawthon, Susan Stanford, Jean Popalisky,
Medical Complexity
Pediatric Medical Complexity Algorithm: A New Method to Stratify Children by
Services
Updated Information &
http://pediatrics.aappublications.org/content/133/6/e1647
including high resolution figures, can be found at:
References
http://pediatrics.aappublications.org/content/133/6/e1647#BIBL
This article cites 18 articles, 6 of which you can access for free at:
Subspecialty Collections
g_-_development_sub
http://www.aappublications.org/cgi/collection/practice-based_learnin
Practice-Based Learning & Development
e_management_sub
http://www.aappublications.org/cgi/collection/administration:practic
Administration/Practice Management following collection(s):
This article, along with others on similar topics, appears in the
Permissions & Licensing
http://www.aappublications.org/site/misc/Permissions.xhtml
in its entirety can be found online at:
Information about reproducing this article in parts (figures, tables) or
Reprints
http://www.aappublications.org/site/misc/reprints.xhtml
DOI: 10.1542/peds.2013-3875 originally published online May 12, 2014;
2014;133;e1647
Pediatrics
Mangione-Smith
Dorothy Lyons, Peter Woodcox, Margaret Hood, Alex Y. Chen and Rita
Tamara D. Simon, Mary Lawrence Cawthon, Susan Stanford, Jean Popalisky,
http://pediatrics.aappublications.org/content/133/6/e1647
located on the World Wide Web at:
The online version of this article, along with updated information and services, is
http://pediatrics.aappublications.org/content/suppl/2014/05/08/peds.2013-3875.DCSupplemental
Data Supplement at:
by the American Academy of Pediatrics. All rights reserved. Print ISSN: 1073-0397.