O R I G I N A L R E S E A R C H
Houns
fi
eld Unit Values in ACR TI-RADS 4-5
Thyroid Nodules with Coarse Calci
fi
cations: An
Important Imaging Feature Helpful for Diagnosis
This article was published in the following Dove Press journal: Cancer Management and Research
Pei-Ying Wei1,*
Nian-Dong Jiang2,*
Jing-Jing Xiang3
Chen-Ke Xu4
Jin-Wang Ding5
Hai-Bin Wang1
Ding-Cun Luo 5
Zhi-Jiang Han1
1Department of Radiology, Affiliated
Hangzhou First People’s Hospital, Zhejiang University School of Medicine, Hangzhou, People’s Republic of China;
2Department of Radiology, Chunan
County Hospital of Traditional Chinese Medicine, Hangzhou, People’s Republic of China;3Department of Pathology,
Affiliated Hangzhou First People’s Hospital, Zhejiang University School of Medicine, Hangzhou, People’s Republic of China;4Department of Medical
Ultrasound, Affiliated Hangzhou First People’s Hospital, Zhejiang University School of Medicine, Hangzhou, People’s Republic of China;5Department of
Surgical Oncology, Affiliated Hangzhou First People’s Hospital, Zhejiang University School of Medicine, Hangzhou, People’s Republic of China
*These authors contributed equally to this work
Purpose: The purpose of this study is to investigate the diagnostic role of Hounsfield unit (HU) values on noncontrast computed tomography (CT) for differentiating benignity from malignancy in the American College of Radiology (ACR) Thyroid Imaging Reporting and Data System (TI-RADS) 4-5 nodules with coarse calcifications.
Patients and Methods: CT images of 216 ACR TI-RADS 4-5 nodules with coarse
calcifications from 207 patients who underwent surgery in our hospital between 2017 and 2019 were retrospectively reviewed. The average HU values (AHUVs) and maximum HU values (MHUVs) of the nodules were measured on noncontrast CT. The distribution of AHUVs and MHUVs in benign and malignant nodules with coarse calcifications was analyzed using the Mann–Whitney test. Receiver operating characteristic (ROC) curves were used to identify the best cut-off values. Diagnostic performances were assessed according to the area under the ROC curve (AUC), sensitivity and specificity.
Results:Of the 216 ACR TI-RADS 4-5 nodules with coarse calcifications, 170 were benign and 46 were malignant. The AHUVs of benign and malignant nodules were 791 HU [interquartile range (IQR), 543–1025 HU] and 486 HU (IQR, 406–670 HU), respectively (P< 0.001). The MHUVs of benign and malignant nodules were 1084 HU (IQR, 717–1477 HU) and 677 HU (IQR, 441–986 HU), respectively (P< 0.001). The AUCs for AHUVs and MHUVs for predict-ing benign nodules with coarse calcifications were 0.759 and 0.732, and the cut-off values were 627.5 HU and 806.0 HU, with sensitivities of 67.6% and 68.8% and specificities of 73.9% and 67.4%, respectively. The sensitivity and specificity of the combination were 68.8% and 76.1%.
Conclusion: AHUVs and MHUVs were helpful in differentiating benignity from
malig-nancy in ACR TI-RADS 4-5 nodules with coarse calcifications. This may provide an important basis for reducing misdiagnosis and unnecessary aspiration or surgical trauma.
Keywords: thyroid nodule, coarse calcification, ACR TI-RADS, computed tomography,
ultrasonography, Hounsfield unit value
Introduction
Thyroid nodules are exceedingly common, with a reported prevalence of 20–67% on ultrasound (US) examinations and up to 25% on contrast-enhanced thoracic computed tomography (CT) scans.1 Calcification is a common imaging finding observed in thyroid nodules, which accounts for 15.7–28.9% of benign nodules and 49.6–65.9% of malignant nodules on US examinations.2,3The diagnostic value of microcalcifi ca-tions for malignant nodules has been widely accepted.2–4However, coarse calcifi ca-tions often cause obvious echo attenuation, which affects the visualization of internal and posterior structures of the calcified nodules. Moreover, coarse calcifications are
Correspondence: Zhi-Jiang Han Email [email protected]
Cancer Management and Research
Dove
press
open access to scientific and medical research
Open Access Full Text Article
Cancer Management and Research downloaded from https://www.dovepress.com/ by 118.70.13.36 on 24-Aug-2020
often accompanied byfibrosis in the surrounding area, which results in uneven echo and fails to provide sufficient informa-tion for proper diagnosis. Therefore, thyroid nodules with coarse calcifications are usually classified as the American College of Radiology (ACR) Thyroid Imaging Reporting and Data System (TI-RADS) 4 or 5,5–8hence cause signifi -cant confusion among clinicians and patients, and even unne-cessary surgical trauma.
Fine-needle aspiration (FNA) is often recommended for ACR TI-RADS 4 or 5 nodules,5,9,10which is considered the most effective practical technique to reach a definitive diag-nosis for most thyroid nodules.11,12 However, for thyroid nodules with coarse calcifications, particularly those with thick-walled annular calcifications, it is difficult to penetrate the hard calcified area or obtain sufficient cytology speci-mens, even if penetration is achieved.13–15 This results in nondiagnostic and inconclusive rates on FNA up to 27.2– -53.8% and 42.2–57.7%, respectively.15,16 Compared with FNA, coarse needle biopsy (CNB) is often able to obtain adequate cytological specimens with higher specificity.15,17 However, more traumas are involved with CNB procedures. Although CT is inadequate for the diagnosis of micro-scopic and diffuse lesions in the thyroid, it is able to fully reveal the internal and surrounding structures of nodules with coarse calcifications due to the absence of echo attenuation. In our previous studies, we analyzed CT his-togram characteristics and artifacts of solitary coarse cal-cified nodules respectively. We found that both the proportion of voxels < 1150 Hounsfield units (HU) no more than 98.4% and the presence of artifacts around calcifications on noncontrast CT could contribute to the diagnosis of benign nodules.18,19 However, the operation and analysis of CT histogram is complex and requires special measurement software, while evaluating artifact is a subjective process. Therefore, both are difficult to be widely applied. We suggest that HU value, similar to CT histogram and artifact, could also reflect the internal struc-ture and density characteristics inside calcified nodules to a certain extent, from which their properties could be assessed.
To the best of our knowledge, no previous studies have investigated maximum Hounsfield unit values (MHUVs) of thyroid nodules with coarse calcifications on noncon-trast CT. Based on our previous studies,18–22 the present study aimed to explore the diagnostic role of average Hounsfield unit values (AHUVs) and MHUVs in ACR TI-RADS 4-5 nodules, so as to provide an important basis for further diagnosis and treatment in the clinic.
Patients and Methods
Patients
This study involved all patients with thyroid nodules who underwent surgery in our hospital between August 2017 and August 2019. The inclusion criteria were as follows: (1) ACR TI-RADS 4-5 thyroid nodules, (2) CT scan per-formed before surgery, (3) short diameter of the calcified area of nodule ≥ 4 mm and (4) pathological verification after surgery. The exclusion criteria were as follows: (1) nodules that were not clearly visible on CT images due to poor image quality or those with other thyroid diseases, and (2) patients with incomplete clinical and imaging data. Ultimately, a total of 207 patients (36 males and 171 females, aged 54.0 ± 11.0 years, range 28–82 years) with 216 thyroid coarse calcified nodules were included in the study. This retrospective study was approved by the Ethics Committee of the Affiliated Hangzhou First People’s Hospital, Zhejiang University School of Medicine (Hangzhou, Zhejiang Province, People’s Republic of China). Due to the retrospective nature of the study and the use of anonymized patient data, written informed con-sent for participation was not required, in accordance with the national legislation and institutional requirements.
Pathology
All 216 ACR TI-RADS 4-5 thyroid nodules with coarse calcifications from the 207 patients had a conclusive pathological diagnosis confirmed by senior pathologists. Archived tissue specimens were cut into sections (5 μm thick) andfixed in 10% neutral formalin and stained using the hematoxylin and eosin method. The tissue sections were then examined under a light microscope.
CT Examination
All patients underwent CT using a 16-slice spiral CT scanner (Lightspeed, GE Healthcare, Milwaukee, WI, USA). Patients were positioned supine and scanned from the base of the skull to the upper edge of the aortic arch. The scan parameters were as follows: power, 120 kV; current, 250 mA; collimation, 0.625 mm × l6 mm; and pitch, 0.938. The rotation time of the rack was 0.5 s and reconstruction thickness (ie, slice thickness) was 3.75 mm.
Image Analysis
CT images were reviewed independently by two radiolo-gists (PYW and NDJ) with 5 and 8 years’working experi-ence, respectively. The radiologists were blinded to clinical
Cancer Management and Research downloaded from https://www.dovepress.com/ by 118.70.13.36 on 24-Aug-2020
information, other imaging results, and pathological data of the patients. They measured the HU values of nodules on the Picture Archiving and Communication Systems Workstation. The CT value of the calcified area was mea-sured under soft tissue window width (WW) and window position (WL) (WW: 350, WL: 40). A round or elliptical area was used to delineate the region of interest (ROI). For measuring AHUV, the ROI should be as large as possible and avoid the non-calcified area. The HU values in the maximum and sub-maximal sections of the calcified area were measured, from which the larger was selected (Figure 1AandB). For measuring MHUV, the ROI should extend beyond the edge of each section of calcified area, and avoid covering other calcifications outside the nodules or the surrounding bone structure. The maximum measure-ment result was considered the MHUV of nodule (Figure 2A and B). The AHUVs and MHUVs measured by the two radiologists respectively were taken for inter-observer consistency analysis. The mean values of AHUVs
and MHUVs measured by the two radiologists were used for analysis of diagnostic performances.
Statistical Analyses
Statistical analyses were performed using SPSS 19.0 (IBM Corporation, Armonk, NY, USA) and MedCalc 15.8 (MedCalc, Ostend, Belgium). Variables with normal distri-bution were expressed as mean ± standard deviation, while variables with non-normal distribution were expressed as median [interquartile range (IQR)]. Categorical variables were analyzed using the chi-squared test or the Fisher’s exact test, while continuous variables were compared using the independent samplest-test or the Wilcoxon rank sum test. Receiver operating characteristic (ROC) curves were used to analyze the diagnostic value of AHUVs and MHUVs. The best cut-off values were obtained from ROC analyses. Diagnostic performances were assessed according to the area under the ROC curve (AUC), sensitivity, and specificity. Cohen’s kappa coefficient was used to assess the
Figure 1Method for measuring AHUV.
Notes:(A) AHUV of the nodule was 879.3 HU, and the nodule was surgically confirmed as nodular goiter. (B) AHUV of the nodule was 463.8 HU, and the nodule was surgically confirmed as papillary thyroid carcinoma.
Abbreviation:AHUV, average Hounsfield unit value.
Figure 2Method for measuring MHUV.
Notes:(A) MHUV of the nodule was 1410.0 HU, and the pathology was nodular goiter. (B) MHUV of the nodule was 805.0 HU, and the pathology was papillary thyroid carcinoma. Abbreviation:MHUV, maximum Hounsfield unit value.
Cancer Management and Research downloaded from https://www.dovepress.com/ by 118.70.13.36 on 24-Aug-2020
consistency between the two radiologists. Differences with P< 0.05 were considered to be statistically significant.
Results
During the study period, a total of 207 patients with 216 ACR TI-RADS 4-5 thyroid nodules with coarse calcifications were enrolled according to the selection criteria. The typical US images are shown in Figure 3A and B. All 170 benign nodules with coarse calcifications from 163 patients were nodular goiters, while 45 malignant nodules from 44 patients were papillary thyroid carcinomas, and 1 nodule was folli-cular carcinoma. The typical pathological images are shown inFigure 4AandB. There were 25 males and 138 females with benign nodules, and 11 males and 33 females with malignant nodules. The mean age of the male patients was 55.95 ± 12.14 years and 53.48 ± 11.02 years for females. The average lesion size of benign and malignant nodules was 10.90 mm (IQR, 7.43–14.70 mm) and 8.70 mm (IQR,
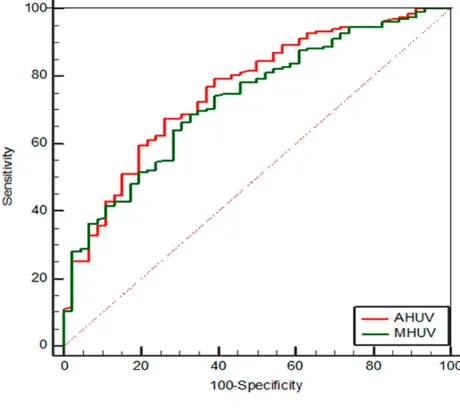
6.80–13.00 mm), respectively. The sexes, ages and lesion sizes showed no significant differences between benign and malignant nodules. The AHUV for benign nodules was 791 HU (IQR, 543–1025 HU) and for malignant nodules was 486 HU (IQR, 406–670 HU). The MHUV for benign nodules was 1084 HU (IQR, 717–1477 HU) and for malignant nodules was 677 HU (IQR, 441–986 HU).The differences were significant in terms of AHUVs and MHUVs (Table 1). For predicting the benign nodules with coarse calcifi -cations, the AUCs for AHUVs and MHUVs were 0.759 (95% confidence interval [CI], 0.697–0.815) and 0.732 (95% CI, 0.667–0.790), respectively (Figure 5). When the maximum values of Jordan index for AHUVs and MHUVs were 0.415 and 0.362, the cut-off values were 627.5 HU and 806.0 HU, with sensitivities of 67.6% and 68.8%, specificities of 73.9% and 67.4%, respectively. The sensitivity and specificity of the combination were 68.8% and 76.1%.
Figure 3Typical ultrasound images for ACR TI-RADS 4−5 nodules with coarse calcifications, which revealed calcifications were interrupted, accompanied by significant echo attenuation in the posterior area.
Notes:(A) The nodule was classified to ACR TI-RADS 4, and the pathology was nodular goiter. (B) The nodule was classified to ACR TI-RADS 5, and the pathology was papillary thyroid carcinoma.
Abbreviation:ACR TI-RADS, the American College of Radiology Thyroid Imaging Reporting and Data System.
Figure 4Typical pathological images.
Notes:(A) Pathological image (original magnification ×20) of nodular goiter revealing that calcifications (black arrow) surrounded byfibrosis (white arrow). (B) Pathological image (original magnification ×30) of papillary thyroid carcinoma revealing calcifications (black arrow) andfibrosis (white arrow) separated by cancer tissues (black pentagram).
Cancer Management and Research downloaded from https://www.dovepress.com/ by 118.70.13.36 on 24-Aug-2020
The two radiologists demonstrated good agreement regarding AHUVs (k = 0.840; 95% CI, 0.738–0.925). The MHUVs measured by the two radiologists are all consistent (k = 1).
Discussion
To our knowledge, this was the first study to use AHUVs and MHUVs on noncontrast CT to analyze ACR TI-RADS 4−5 nodules with coarse calcifications. According to our measurement method, the two radiologists demonstrated good agreement regarding AHUVs, and MHUVs mea-sured by the two radiologists are all consistent. Our results demonstrated that the AHUVs and MHUVs of benign nodules were significantly higher than those of malignant
nodules. The AUCs of AHUVs and MHUVs for predicting benign nodules with coarse calcifications were similar (0.759 and 0.732, respectively) and the cut-off values were 627.5 HU and 806.0 HU, with sensitivities of 67.6% and 68.8%, and specificities of 73.9% and 67.4%, respectively. With the increase in AHUVs and MHUVs, the specificity for benign diagnosis increased. The combi-nation of AHUV and MHUV could further improve the specificity.
Pathologically, there is significant difference between benign and malignant thyroid coarse calcifications. Most benign calcifications or ossifications are continuous and manifest as dense plates, blocks, strips, arcs, or nodules. The mechanism is associated with sufficient and mature accumulation of calcium salts. However, malignant coarse calcifications are distributed in loose, intermittent spots or dots, even in honeycomb shape. The mechanism is related to the insufficient accumulation of calcium salts and con-tinuous destruction by malignant tumor cells during the accumulation process.18,19,23Therefore, these pathological differences between benign and malignant coarse calcifi -cations are reflected as different densities on plainfilm or CT imaging.
In 1958, Holtz and Powers first proposed that the density of thyroid benign calcifications was significantly higher than that of malignant calcifications in X-ray examinations.24 However, due to the limitations of ima-ging technologies at that time, further quantitative analysis was impossible. In 2015, we estimated the diagnostic value of CT artifacts for solitary coarse calcifications in thyroid nodules, and found that the presence of artifacts was more supportive of the diagnosis of benign nodules.18 However, there are shortcomings in judging artifacts, such as strong subjectivity. Yang et al analyzed 41 cases with thyroid solitary calcified nodules and 55 cases with solely coarse calcified surrounded by a low-density focus. They found that the amplification of lesions after contrast enhancement was an independent risk factor for cancer.25 However, the delineation of ROI and judgement of lesion size were not specifically addressed, and the lesion sizes were not quantified in their study. In 2017, Kim et al analyzed 42 malignant and 19 benign coarse calcified nodules according to HU values, and found that the HU values for thyroid benign calcified nodules were higher than those for malignant calcified nodules.26 However, their sample cohort was small, and they did not further determine a cut-off HU value or analyze diagnostic effi -cacy. The sample size of benign nodules in our study was
Table 1General Data and Hounsfield Unit Values
Variable Nodules Pvalue
Benign Malignant
Sex, N (%)
Male 25 (15.24) 11 (25.00) 0.133
Female 138 (84.76) 33 (75.00)
Age, years 55.95 ± 12.14 53.48 ± 11.02 0.707 Size, mm 10.90 (7.43–14.70) 8.70 (6.80–13.00) 0.069 AHUV, HU 791 (543–1025) 486 (406–670) <0.001 MHUV, HU 1084 (717–1477) 677 (441–986) <0.001
Notes: Data are presented as N (%), mean ± standard deviation, or median (interquartile range), unless otherwise indicated.
Abbreviations:HU, Hounsfield unit; AHUV, average Hounsfield unit value; MHUV, maximum Hounsfield unit value.
Figure 5ROC curves of AHUV and MHUV.
Abbreviations: ROC, receiver operating characteristic; AHUV, average Hounsfield unit value; MHUV, maximum Hounsfield unit value.
Cancer Management and Research downloaded from https://www.dovepress.com/ by 118.70.13.36 on 24-Aug-2020
larger than that reported by Kim et al.26 We proposed MHUV for the first time and evaluated the ACR TI-RADS 4-5 thyroid coarse calcified nodules together with AHUVs. Our results demonstrated that the AHUVs and MHUVs of benign nodules were significantly higher than those of malignant nodules.
To increase the repeatability of the experiment in the present study, we defined the measurement methods for AHUVs and MHUVs. Although there was good consis-tency between the two radiologists in the process of mea-suring AHUVs, the measurement process was relatively complex, especially regarding the size of the ROI and the selection of the measurement area. However, the measure-ment of MHUVs was relatively simple, and the ROI only needed to cover the entire calcified nodule. The results show MHUVs measured by the two radiologists were all consistent. Our results demonstrated that the diagnostic efficiency of AHUVs was just slightly better than that of MHUVs when the maximum Jordan index was considered. The combination of both could further improve the speci-ficity. However, there were still some deficiencies in spe-cificity. To reduce the rate of misdiagnosis, therefore, higher specificity is needed. When the specificities of both were 91.3%, the sensitivity of MHUV (36.5%) was higher than AHUV (31.2%).
Our results showed that AHUVs and MHUVs were of great value in differentiating benignity from malignancy in ACR TI-RADS 4-5 nodules with coarse calcifications. However, it should be noted that performing noncontrast CT is not routinely feasible for all thyroid diseases, especially for microscopic and diffuse lesions, since its soft tissue resolution is limited, and it is relatively expensive and may be associated to harmful effects (ie use of ionising radiation). The present investigation had several limitations. First, selection bias was inevitable because this was a retrospective study and the data were obtained from a single medical institute. Second, the combination of multiple CT signs may be more valuable for the qualitative diagnosis of nodules with coarse calcifications. However, this investigation aimed to introduce the diagnostic role of AHUV and MHUV on noncontrast CT, and further study will be done in combina-tion with other CT signs. Finally, because the slice thickness in the CT scans was 3.75 mm, to avoid the influence of partial volume effect, ACR TI-RADS 4-5 nodules with a short diameter of calcified area < 4 mm were not included. Hence, whether our results are applicable to these nodules needs further study with a larger sample size.
Conclusion
AHUVs and MHUVs were helpful in differentiating benignity from malignancy in ACR TI-RADS 4-5 nodules with coarse calcifications. The former demonstrated greater AUC and specificity, while the latter had higher sensitivity and was more convenient in operation. The combination of both could further improve the specificity. This may provide an important basis for reducing mis-diagnosis and unnecessary aspiration or surgical trauma.
Ethics and Consent Statement
Ethics Committee of the Affiliated Hangzhou First People’s Hospital, Zhejiang University School of Medicine approved this study. Due to the retrospective nature of the study and the use of anonymized patient data, informed consent for participation was not required, in accordance with the national legislation and institutional requirements.
Acknowledgments
This work was supported by Medical Science Research Program of Zhejiang Province (2020369811), Hangzhou Social Development Project of Science and Technology Commission (20180533B39), Applied Research Project of Commonweal Technology in Zhejiang Province (2017C 33180), the Key Project of Scientific and Technological Innovation in Hangzhou (20131813A08), and Medicine Research Center, Key Laboratory of Clinical Cancer Pharmacology and Toxicology Research of Zhejiang Province (2020E10021), for which the authors are grateful. We are very grateful to the editor and reviewers.
Author Contributions
All authors made substantial contributions to conception and design, acquisition of data, analysis and interpretation of data, drafting or revising the article, gavefinal approval of the version to be published, and agree to be accountable for all aspects of the work.
Disclosure
The authors report no conflicts of interest in this work.
References
1. Fisher SB, Perrier ND. The incidental thyroid nodule.CA Cancer J Clin.2018;68:97−105.
2. Lu Z, Mu Y, Zhu H, et al. Clinical value of using ultrasound to assess calcification patterns in thyroid nodules. World J Surg.2011;35:122
−127. doi:10.1007/s00268-010-0827-3
Cancer Management and Research downloaded from https://www.dovepress.com/ by 118.70.13.36 on 24-Aug-2020
3. Shi C, Li S, Shi T, et al. Correlation between thyroid nodule calcifi -cation morphology on ultrasound and thyroid carcinoma.J Int Med Res.2012;40:350−357. doi:10.1177/147323001204000136
4. Ning CP, Ji QL, Fang SB, et al. Distribution patterns of
microcalci-fications in suspected thyroid carcinoma: a classification method helpful for diagnosis. Eur Radiol. 2018;28:1−8. doi:10.1007/ s00330-017-5212-2
5. Tessler FN, Middleton WD, Grant EG, et al. ACR Thyroid Imaging, Reporting and Data System (TI-RADS): white paper of the ACR TI-RADS committee. J Am Coll Radiol. 2017;14:587−595. doi:10.1016/j.jacr.2017.01.046
6. Tappouni RR, Itri JN, McQueen TS, et al. ACR TI-RADS: pitfalls, solutions, and future directions.Radiographics.2019;39:2040−2052. doi:10.1148/rg.2019190026
7. Grant EG, Tessler FN, Hoang JK, et al. Thyroid ultrasound reporting lexicon: white paper of the ACR thyroid imaging, reporting and data system (TIRADS) committee. J Am Coll Radiol. 2015;12:1272
−1279. doi:10.1016/j.jacr.2015.07.011
8. Lyu YJ, Shen F, Yan Y, et al. Ultrasound-guidedfine-needle aspira-tion biopsy of thyroid nodules <10 mm in the maximum diameter: does size matter? Cancer Manag Res. 2019;11:1231–1236. doi:10.2147/CMAR.S189358
9. Shen Y, Liu M, He J, et al. Comparison of different risk-stratification systems for the diagnosis of benign and malignant thyroid nodules. Front Oncol.2019;9:378. doi:10.3389/fonc.2019.00378
10. Castellana M, Castellana C, Treglia G, et al. Performance of five ultrasound risk stratification systems in selecting thyroid nodules for FNA. A meta-analysis.J Clin Endocrinol Metab.2019.
11. Singh Ospina N, Brito JP, Maraka S, et al. Diagnostic accuracy of ultrasound-guided fine needle aspiration biopsy for thyroid malig-nancy: systematic review and meta-analysis.Endocrine.2016;53:651
−661. doi:10.1007/s12020-016-0921-x
12. Lee J, Lee SY, Cha SH, et al. Fine-needle aspiration of thyroid nodules with macrocalcification. Thyroid. 2013;23:1106−1112. doi:10.1089/thy.2012.0406
13. Wu CW, Dionigi G, Lee KW, et al. Calcifications in thyroid nodules identified on preoperative computed tomography: patterns and clin-ical significance. Surgery. 2012;151:464−470. doi:10.1016/j. surg.2011.07.032
14. Choi SH, Baek JH, Lee JH, et al. Thyroid nodules with initially non-diagnostic, fine-needle aspiration results: comparison of core-needle biopsy and repeatedfine-needle aspiration.Eur Radiol. 2014;24:2819−2826. doi:10.1007/s00330-014-3325-4
15. Yi KS, Kim JH, Na DG, et al. Usefulness of core needle biopsy for thyroid nodules with macrocalcifications: comparison with
fine-needle aspiration. Thyroid. 2015;25:657−664. doi:10.1089/ thy.2014.0596
16. Na DG, Kim DS, Kim SJ, et al. Thyroid nodules with isolated macrocalcification: malignancy risk and diagnostic efficacy of
fine-needle aspiration and core needle biopsy. Ultrasonography. 2016;35:212–219. doi:10.14366/usg.15074
17. Ha EJ, Baek JH, Lee JH, et al. Core needle biopsy can minimise the non-diagnostic results and need for diagnostic surgery in patients with calcified thyroid nodules. Eur Radiol. 2014;24:1403−1409. doi:10.1007/s00330-014-3123-z
18. Zhu D, Chen W, Xiang J, et al. Diagnostic value of CT artifacts for solitary coarse calcifications in thyroid nodules.Int J Clin Exp Med. 2015;8:5800−5805.
19. Zhang LX, Xiang JJ, Wei PY, et al. Diagnostic value of computed tomography (CT) histogram analysis in thyroid benign solitary coarse calcification nodules. J Zhejiang Univ Sci B. 2018;19:211−217. doi:10.1631/jzus.B1700119
20. Han ZJ, Shu YY, Lai XF, et al. Value of computed tomography in determining the nature of papillary thyroid microcarcinomas: evalua-tion of the computed tomographic characteristics. Clin Imaging. 2013;37:664−668. doi:10.1016/j.clinimag.2012.12.005
21. Han ZJ, Lei ZK, Li MK, et al. Differential diagnosis value of the ultrasound gray scale ratio for papillary thyroid microcarcinomas and micronodular goiters. Quant Imaging Med Surg. 2018;8:507−513. doi:10.21037/qims.2018.06.04
22. Lei ZK, Li MK, Luo DC, et al. The clinical significance of ultrasound grayscale ratio in differentiating markedly hypoechoic and anechoic minimal thyroid nodules.J Cancer Res Ther.2018;14:1567−1571. 23. Park M, Shin JH, Han BK, et al. Sonography of thyroid nodules with
peripheral calcifications. J Clin Ultrasound. 2009;37:324−328. doi:10.1002/jcu.20584
24. Holtz S, Powers WE. Calcification in papillary carcinoma of the thyroid. Am J Roentgenol Radium Ther Nucl Med.1958;80:997–1000. 25. Yang TT, Huang Y, Jing XQ, et al. CT-detected solitary thyroid
calcification: an important imaging feature for papillary carcinoma. Onco Targets Ther.2016;9:6273−6279. doi:10.2147/OTT.S113369 26. Kim D, Kim DW, Heo YJ, et al. Computed tomography features of
benign and malignant calcified thyroid nodules: a single-center study. J Comput Assist Tomogr. 2017;41:937−940. doi:10.1097/RCT. 0000000000000618
Cancer Management and Research
Dove
press
Publish your work in this journal
Cancer Management and Research is an international, peer-reviewed open access journal focusing on cancer research and the optimal use of preventative and integrated treatment interventions to achieve improved outcomes, enhanced survival and quality of life for the cancer patient.
The manuscript management system is completely online and includes a very quick and fair peer-review system, which is all easy to use. Visit http://www.dovepress.com/testimonials.php to read real quotes from published authors.
Submit your manuscript here:https://www.dovepress.com/cancer-management-and-research-journal
Cancer Management and Research downloaded from https://www.dovepress.com/ by 118.70.13.36 on 24-Aug-2020