Neurodevelopment in Children Born Small for Gestational Age: A
Randomized Trial of Nutrient-Enriched Versus Standard Formula and
Comparison With a Reference Breastfed Group
Ruth Morley, FRCPCH*‡; Mary S. Fewtrell, FRCPCH*; Rebecca A. Abbott, PhD§; Terence Stephenson, FRCPCH储; Una MacFadyen, FRCPCH¶; and Alan Lucas, FRCP*
ABSTRACT. Objective. Many studies have shown that children born small for gestational age (SGA) are at a neurodevelopmental disadvantage. We have shown that nutrient enrichment of formula fed to term SGA infants improves their growth and hypothesized that it also would improve their neurodevelopmental outcome. Design. A randomized, controlled trial of standard term-infant (nⴝ147) or nutrient-enriched (nⴝ152) for-mula for the first 9 months. A reference group of 175 breastfed SGA infants was also recruited.
Setting. Subjects were recruited in 5 maternity hospi-tals in Cambridge, Nottingham, and Leicester, all in the United Kingdom.
Participants. Healthy, term infants (gestation: >37 weeks) with birth weight<10th centile.
Outcome Measures. Bayley mental and psychomotor scores at 18 months (primary) and developmental scores from Knobloch, Pasamanick, and Sherrard’s develop-mental screening inventory at 9 months (secondary).
Results. There was no significant intergroup differ-ence in Bayley Mental Development Index (MDI) or Psychomotor Development Index (PDI) scores at 18 months. However, at 9 months, children fed the enriched formula had a significantly lower developmental quo-tient (99.5 vs 102.0; 95% confidence interval [CI] for dif-ference:ⴚ4.6,ⴚ0.4). A significant disadvantage was seen in girls (ⴚ5.1; 95% CI:ⴚ7.8, ⴚ2.4) but not in boys (0.9; 95% CI:ⴚ2.4, 4.2).
Breastfed infants had significantly higher MDI and PDI scores at 18 months than formula-fed infants. Con-founding factors accounted for ⬃34% of the observed association between breastfeeding and MDI score and
none of the association between breastfeeding and PDI score.
Conclusions. The previously reported enhanced lin-ear growth in SGA children fed enriched formula was not matched by a neurodevelopmental advantage. At 9 months, girls fed the enriched formula had a significant developmental disadvantage, although this was not seen at 18 months. Later follow-up will determine any long-term effects on health or development. Meanwhile, use of enriched formula for term SGA children should not be promoted.
It seems that breastfeeding may be especially benefi-cial for neurodevelopment in children born SGA. Pedi-atrics2004;113:515–521;term infant, small for gestational age, postnatal nutrition, neurodevelopment, randomized trial.
ABBREVIATIONS. SGA, small for gestational age; MDI, Mental Development Index; PDI, Psychomotor Development Index; SD, standard deviation; IQ, intelligence quotient; CI, confidence inter-val.
M
any studies have shown that mean psycho-metric or academic test scores of children born small for gestational age (SGA) are lower than those of children with “appropriate” birth weight for gestational age. Among 8 different studies during the first 6 years of life, the majority demon-strated a disadvantage for those born SGA, although most of the studies were relatively small.1 Some studies have confirmed a similar disadvantage in late childhood or adolescence, when scores are more pre-dictive of adult cognitive performance,2–7 although others did not.8 –10 In a large British birth cohort study, subjects born SGA had significantly lower scores on a number of different cognitive tests at ages 8, 11, and 15 years. At age 26 they had poorer reading comprehension11and were less likely to have profes-sional or managerial jobs12 than those born with appropriate birth weight for gestational age. These differences remained after adjustment for social, de-mographic, and fetal or neonatal factors.A suboptimal supply of nutrients in utero (whether because of suboptimal maternal nutrition or placental transfer of nutrients) is a cause of re-duced fetal somatic and brain growth.13,14 In hu-mans, the so-called critical brain growth spurt is between the third trimester and 2 years postterm13; thus, as Dobbing pointed out,15 this period repre-sents an “opportunity actively to promote the proper From the *Medical Research Council Childhood Nutrition Research Centre,
Institute of Child Health, London, United Kingdom; ‡Clinical Epidemiol-ogy and Biostatistics Unit and Murdoch Children’s Research Institute, Royal Children’s Hospital, Melbourne, Australia; §Department of Public Health and Primary Care, Institute of Public Health, University of Cam-bridge, CamCam-bridge, United Kingdom;储Academic Division of Child Health, University Hospital, Nottingham, United Kingdom; and ¶Paediatric De-partment, Stirling Royal Infirmary National Health Service Trust, Stirling, United Kingdom.
Received for publication Dec 16, 2002; accepted Jun 4, 2003.
All authors were involved in study design; Drs Morley and Fewtrell ana-lyzed the data; and all authors contributed to the final manuscript. All the authors have at some time benefited from funding from the nutrition industry for research. All the authors other than Drs Abbott and MacFadyen also have benefited from funding for giving invited lectures. Dr Lucas has benefited from consultancies to the nutrition industry.
Dr Morley is now supported by VicHealth (the Victorian Health Promotion Foundation).
Reprint requests to (R.M.) University of Melbourne Department of Paedi-atrics, Royal Children’s Hospital, Flemington Rd, Parkville, Victoria 3052, Australia. E-mail: [email protected]
growth of the human brain, by providing the best possible environmental conditions.”
The strategy of providing extra protein with only sufficient extra energy for protein utilization has al-ready been adopted in the design of special formulas to improve growth rate in preterm infants both in hospital and postdischarge,16,17 and we now extend the use of the same formula, with almost 30% more protein than most standard formulas, for the nutri-tion of term SGA infants.
In this randomized trial in children born at term and SGA, we tested 2 primary hypotheses. The first was that children fed the nutrient-enriched formula would have improved growth. This proved to be the case; infants receiving enriched formula showed greater gains in length and head circumference than those fed term formula, not only during the 9-month intervention period but also up to 18 months.18
The other primary hypothesis was that children randomized to a nutrient-enriched formula from birth to 9 months would have Bayley Mental Devel-opment Index (MDI) and Psychomotor DevelDevel-opment Index (PDI) scores one third of a standard deviation (SD) higher, at 18 months, than those fed a standard formula. Our secondary hypothesis was that chil-dren fed a nutrient-enriched formula would have one third of a SD advantage in developmental quo-tient at 9 months (score derived from the develop-mental screening inventory by Knobloch, Pasaman-ick, and Sherrard). Our findings are presented here. We also studied a breastfed reference group and report associations between feeding practice and de-velopmental scores.
SUBJECTS AND METHODS Recruitment
Infants born in 1993, 1994, and 1995 were recruited into the randomized trial from 5 hospitals in Cambridge, Nottingham, and Leicester (all in the United Kingdom); in each, the study was approved by the local ethics committee. All infants were born at
ⱖ37 weeks’ gestation and had a birth weight⬍10th centile for gestation and gender. This definition is similar to that used by the World Health Organization,19 although we used centiles from
current United Kingdom growth charts.20Infants with congenital
abnormalities known to affect growth or development were inel-igible. Mothers were approached only after they had unequivo-cally decided not to breastfeed and had commenced formula feeding.
A reference group of breastfed infants meeting the same birth-weight and gestation criteria was recruited, but infants were with-drawn if their mother stopped breastfeeding within 2 weeks of delivery. The duration of exclusive and partial breastfeeding was recorded.
Milk-Formula Assignment
Formula-fed infants were randomized to a standard versus nutrient-enriched formula. They commenced the trial diet within the first week of life, and it was supplied in powdered form until they were 9 months of age. The randomization schedule was prepared by a staff member who was not involved in any subse-quent aspects of the study. It was generated in random permuted blocks and stratified by race (white/Asian) and birth-weight cen-tile (⬍5th centile vsⱖ5th centile for gestation and gender). The assignments were sealed in consecutively numbered, opaque en-velopes.
Blinding
The formulas were color-coded; the code was held by Farley Health Products and was not revealed to the investigators until after preliminary data analysis.
Trial Formulas
The nutrient-enriched formula (PremCare, Farley Health Prod-ucts, a division of H.J. Heinz Co Ltd, Stockley Park, Uxbridge, United Kingdom) contained 301 kJ of energy per 100 mL, with 1.85 g of protein, 7.24 g of carbohydrate, and 3.96 g of fat. The enriched formula contained nearly 20% more protein in relation to energy than the standard formula (OsterMilk, also from Farley Health Products). This standard formula contained 284 kJ energy per 100 mL, with 1.45 g of protein, 6.96 g of carbohydrate, and 3.82 g of fat. Calcium, phosphorus, trace elements, and vitamins were also increased in the nutrient-enriched formula to support the projected increased growth performance. A full description of formula compositions is published elsewhere.18
Baseline Data
We collected extensive sociodemographic data, as well as ob-stetric and neonatal data. Social class was coded into 6 categories by using the United Kingdom Registrar General’s Classification of Occupations and based on the occupation of the main family income earner. The mother’s education was coded according to categories published previously.21This coding is based on
educa-tional attainment and, because there is a common public exami-nation system in England, is likely to be more closely related to maternal intelligence quotient (IQ) scores than educational mea-sures in most other countries.
Outcome Measures
The primary outcome measures, at 18 months, were the mental and motor scales of the Bayley Scales of Infant Development II, from which were derived the MDI and PDI.22The MDI evaluates
memory, habituation, problem solving, and language. The PDI tests control of gross muscle groups including movements asso-ciated with standing, walking, running, and jumping and also tests fine motor manipulations involved in prehension, adaptive use of writing implements, and imitation of hand movements. All items on both scales are scored on the basis of behavior elicited and observed by the assessor and not on the basis of parental report. The secondary outcome measure, at 9 months, was the developmental screening inventory of Knobloch et al.23Using this,
a developmental age is recorded for each of 5 subscales (adaptive, gross motor, fine motor, language, and personal-social). These ages were converted to quotients ([developmental age/chronolog-ical age]⫻100). The overall developmental quotient was calcu-lated as the mean of the 5 subscale quotients. This test was scored largely on the basis of assessor-observed behavior, although pa-rental report was used for some items that were difficult to elicit at this age (eg, early language development).
Infant growth was also an outcome measure, and the results (reported elsewhere18) included weight, length, and head
circum-ference at 9 and 18 months.
Sample Size
The primary hypothesis in respect to development was that there would be a one-third SD difference in Bayley MDI and PDI scores at 18 months between the 2 randomized groups. We calcu-lated that, with 144 infants per group, we had 80% power at 5% significance to detect this difference, and a similar one-third SD difference in developmental scores at 9 months.
Statistical Analyses
Mean scores in the randomized groups were compared by using the 2-sided Student’sttest.
Differences between the formula-fed and breastfed reference groups were compared bytand2tests. Linear regression models
RESULTS
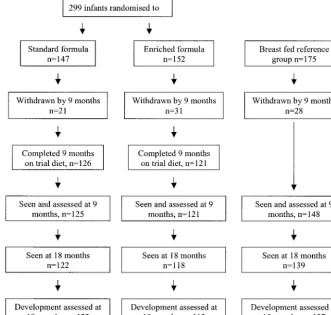
Altogether, 299 infants were recruited into the ran-domized trial; 147 were allocated the standard for-mula (42% boys) and 152 the nutrient-supplemented formula (51% boys). There were 175 breastfed infants (53% boys). The trial profile, with the number of subjects seen at each stage and information about withdrawals, is shown in Fig 1. Baseline characteris-tics of the study groups are shown in Table 1.
Randomized Trial
There were no evident differences in baseline char-acteristics between children randomized to standard
versus enriched formula (Table 1), although among the former group there were less boys (41.5% vs 50.7%). Values for baseline characteristics of children who were assessed at 9 or 18 months differed little from those shown.
There were no significant differences in the pro-portion of infants withdrawn from each formula group nor the numbers withdrawn by their parents or clinicians, and 18 of 147 (12%) control infants versus 25 of 152 (16%) of enriched formula-fed in-fants did not complete 9 months on the trial diet. Only 5 of the noncompliant subjects agreed to fol-low-up; 3 were in the control group and 2 were in the
Fig 1. Infants with birth weight⬍10th centile, gestation ⱖ37 weeks, and no congenital abnormalities known to af-fect growth or development.
TABLE 1. Baseline Characteristics of Trial Participants and Breastfed Reference Group
Randomized Groups Formula Breastfed Reference Group
95% CI for Difference Between
Breastfed and Formula Fed Standard Enriched
N 147 152 175
Male, % (n) 41.5 (61) 50.7 (77) 53.1 (93) ⫺2.3, 16.3
Gestation, wks 39.4 (1.39) 39.0 (1.26) 39.2 (1.45) ⫺0.3, 0.2
Birth weight, kg 2.60 (0.28) 2.53 (0.30) 2.57 (0.29) ⫺0.05, 0.06
% First child 51.7 52.6 70.9 ⫺4.1, 32.4
Maternal age, y 26.4 (4.9) 26.8 (5.4) 29.5 (4.7) 2.0, 3.8
% Mothers with university education 4.1 5.9 35.6 23.0, 38.1
% Social class 1 or 2* 14.2 12.7 56.3 34.6, 51.3
Maternal smoking during second and third trimester of pregnancy, %
48.3 44.7 16.1 38.3, 22.5
Maternal height, cm 160.0 (6.0) 159.4 (11.8) 161.5 (6.6) 0.1, 3.4
Maternal head circumference, cm 54.4 (1.9) 54.5 (2.4) 54.9 (1.9) 0.002, 0.8
Values are mean (SD) unless otherwise indicated.
enriched-formula group. We followed up 125 (85%) of the control group and 121 (80%) of the enriched-formula group at 9 months and 122 (83%) and 118 (78%), respectively, at 18 months. In 5 of the children (all allocated the enriched formula and 4 of them boys), we were unable to complete the developmen-tal assessment because they were uncooperative. Mean age (SD) at 9- and 18-month follow-up was the same in both groups (40 [2] vs 40 [3] weeks at 9 months and 80 [4] vs 80 [4] weeks at 18 months).
Mean values for developmental scores at 9 and 18 months, by randomized diet group, are shown in Table 2. At 18 months, mean MDI and PDI scores did not differ significantly between the 2 diet groups.
Mean overall developmental quotient at 9 months was significantly lower (by 2.5 [⫺4.6,⫺0.4] points) in the group fed nutrient-enriched formula, as were quotients on the gross motor and language subscales. Findings at both 9 and 18 months were unchanged after exclusion of the 5 children (3 controls and 2 on enriched formula) who stopped having the assigned diet before 9 months but agreed to follow-up.
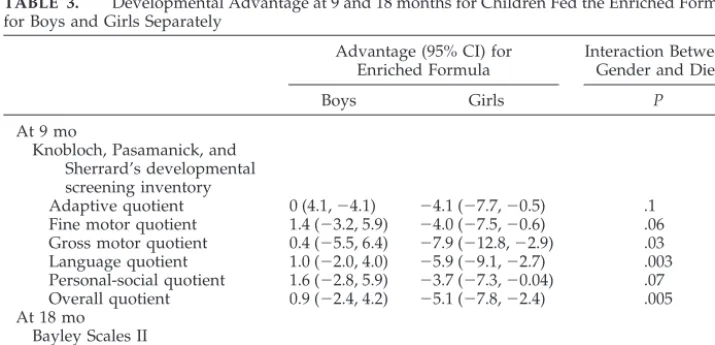
We tested for interaction between gender and diet to determine whether the influence of diet on devel-opmental scores differed significantly according to gender (Table 3). In regression models with
develop-mental scores as dependent variables and including gender, dietary allocation, and an interaction term (gender⫻diet), there was no evidence of significant statistical interaction between diet and gender for either Bayley MDI or PDI scores at 18 months. How-ever, the interaction term was significant for overall quotient (P ⫽ .005) and gross motor (P ⫽ .03) and language (P ⫽ .003) subscale scores at 9 months of age. Girls fed the enriched formula had a significant 5.1-point disadvantage (⫺7.8,⫺2.4) in overall devel-opmental quotient at 9 months, as well as significant disadvantages in all of the 5 individual subscales. After exclusion of children who did not remain on the assigned diet until 9 months, these findings were largely unchanged, although the disadvantage for girls fed enriched formula in the personal-social scale at 9 months was no longer statistically significant (95% confidence interval [CI]:⫺7.2, 0.1).
Comparison of Formula-Fed Infants With Breastfed Reference Group
Originally recruited as a reference group were 175 SGA breastfed infants, and 139 (79%) were seen at 18 months (Fig 1). Of these, 137 were developmentally assessed; 2 children (a boy and a girl) were uncoop-erative.
TABLE 2. Developmental Scores According to Randomized Group at 9 and 18 Months
Standard Formula
Enriched Formula
Advantage (95% CI) for Enriched Formula
Breastfed Reference Group
At 9 mo
n 125 121 148
Knobloch, Pasamanick, and Sherrard’s developmental screening inventory
Adaptive quotient 103.4 (10.9) 101.2 (10.5) ⫺2.2 (⫺4.9, 0.5) 109.9 (9.4) Fine motor quotient 100.7 (11.9) 98.8 (10.5) ⫺1.9 (⫺4.7, 0.9) 105.2 (11.2) Gross motor quotient 104.5 (15.6) 100.6 (14.5) ⫺4.0 (⫺7.7,⫺0.1) 107.6 (14.8) Language quotient 96.3 (10.0) 93.3 (7.5) ⫺3.0 (⫺5.2,⫺0.8) 95.2 (7.8) Personal-social quotient 105.1 (11.8) 103.7 (10.2) ⫺1.4 (⫺4.1, 1.4) 113.8 (8.9) Overall quotient 102.0 (9.0) 99.5 (7.6) ⫺2.5 (⫺4.6,⫺0.4) 106.3 (7.2) At 18 mo
n 122 113 137
Bayley Scales II
MDI 88.6 (14.6) 87.0 (13.2) ⫺1.5 (⫺5.1, 2.0) 99.5 (11.3)
PDI 90.4 (13.2) 90.7 (10.8) 0.3 (3.4,⫺2.8) 96.5 (9.6)
Values are mean (SD) unless otherwise indicated. Data are also shown for the breastfed reference group.
TABLE 3. Developmental Advantage at 9 and 18 months for Children Fed the Enriched Formula, for Boys and Girls Separately
Advantage (95% CI) for Enriched Formula
Interaction Between Gender and Diet
Boys Girls P
At 9 mo
Knobloch, Pasamanick, and Sherrard’s developmental screening inventory
Adaptive quotient 0 (4.1,⫺4.1) ⫺4.1 (⫺7.7,⫺0.5) .1 Fine motor quotient 1.4 (⫺3.2, 5.9) ⫺4.0 (⫺7.5,⫺0.6) .06 Gross motor quotient 0.4 (⫺5.5, 6.4) ⫺7.9 (⫺12.8,⫺2.9) .03 Language quotient 1.0 (⫺2.0, 4.0) ⫺5.9 (⫺9.1,⫺2.7) .003 Personal-social quotient 1.6 (⫺2.8, 5.9) ⫺3.7 (⫺7.3,⫺0.04) .07 Overall quotient 0.9 (⫺2.4, 4.2) ⫺5.1 (⫺7.8,⫺2.4) .005 At 18 mo
Bayley Scales II
MDI 2.6 (8.1,⫺2.9) ⫺3.4 (1.2,⫺8.1) .09
As expected, baseline characteristics of breastfed infants and their families differed from those of for-mula-fed infants (Table 1). Mothers of breastfed in-fants were more likely to have a university degree, come from higher social-class groups, and be hyper-tensive during this pregnancy and were significantly older and less likely to smoke. Mothers of breastfed infants had a greater head circumference and were taller than those of formula-fed children.
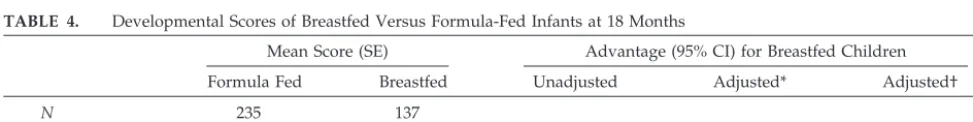
Mean values for developmental scores at 9 and 18 months in the breastfed group are shown in Table 2. Children who were breastfed had higher MDI and PDI scores at 18 months than those fed either for-mula. However, as indicated above and in Table 1, there were major sociodemographic differences be-tween the breastfed and formula-fed groups that could account for these findings. We therefore con-structed regression models to determine whether the significant difference between scores of breastfed versus formula-fed children was independent of po-tentially confounding factors that we measured. In these models we combined both formula groups, because their scores differed little at 18 months. Re-sults are shown in Table 4. Without adjustment, breastfed children had an 11.7-point advantage in MDI score and a 6.0-point advantage in PDI score. Independent factors that were tested in the models were child’s gender and birth order, maternal age and education score, social class, maternal head cir-cumference and height, and whether the mother smoked during her pregnancy.
We used the method advocated by Greenland24 and used in the final model only those factors that (if included) changed the regression coefficient by
ⱖ10%. In the case of Bayley MDI, factors retained in the model were social class and maternal education, and there was a significant 7.7-point advantage for the breastfed children. If we included all the above-mentioned factors in the model, the regression coef-ficient for this advantage was 8.2.
None of the potentially confounding factors men-tioned above changed the regression coefficient for the difference in Bayley PDI scores byⱖ10%. Inclu-sion of all the above-mentioned factors in the model reduced the regression coefficient from 6.0 to 5.8 points.
There was no evidence of interaction between gen-der and whether the child was breastfed (in respect to MDI or PDI scores) either before or after adjust-ment as described above.
Information on duration of exclusive and partial breastfeeding was available for 93 of 137 (68%)
breastfed subjects assessed at 18 months. The median duration of exclusive breastfeeding was 12 weeks (8, 16 [25th and 75th percentiles, respectively]) and of partial breastfeeding was 28 weeks (15, 51). Mothers for whom duration of breastfeeding data were avail-able did not differ significantly from those for whom these data were not available. We found no evidence of an association between duration of exclusive or partial breastfeeding and developmental scores at 18 months.
At 9 months, breastfed children performed signif-icantly better than those fed the enriched formula for each subscore and for overall quotient. They also performed better than those on the control formula in all but the gross motor and language scores. For the overall quotient, there was a 4.3-point (95% CI: 2.4, 6.3) advantage for breastfed versus control for-mula-fed children before adjustment; the advantage reducing to 3.7 points (1.3, 6.0) after adjustment for maternal education and to 3.8 points (1.5, 6.2) with all the above-mentioned factors in the model. In the comparison between breastfed and enriched formu-la-fed children, the unadjusted advantage in overall 9-month quotient for breastfed children was 6.8 points (5.0, 8.6), reducing to 5.8 points (3.8, 7.9) after adjustment for maternal education, and 6.1 points (3.9, 8.3) after adjustment for all the above-men-tioned factors. There was no evidence of a diet-gen-der interaction in either case.
DISCUSSION
Randomized Trial of Nutrient-Enriched Versus Standard Formula
Children who were born SGA and fed the nutri-ent-enriched formula had no significant advantage in terms of the primary outcome measures, the Bayley MDI and PDI scores at 18 months, over those fed the standard formula. However, they did have a signif-icantly lower mean developmental quotient (by 2.5 points [⬃0.3 observed SD]), at 9 months than chil-dren fed the standard formula. Nine-month scores were a secondary outcome measure, and the devel-opmental screening inventory of Knobloch et al23 was not designed or standardized as a robust re-search tool. Nevertheless, when trained observers tested children using this screening instrument, we found significant intergroup differences. There was a modest but significant correlation between 9-month overall quotient and Bayley MDI (correlation coeffi-cient: 0.45; P ⬍ .0001) and PDI (correlation coeffi-cient: 0.37;P⬍ .0001) scores.
TABLE 4. Developmental Scores of Breastfed Versus Formula-Fed Infants at 18 Months
Mean Score (SE) Advantage (95% CI) for Breastfed Children
Formula Fed Breastfed Unadjusted Adjusted* Adjusted†
N 235 137
Bayley MDI 87.8 99.5 11.7 (9.1, 14.3) 8.2 (5.0, 11.4) 7.7 (4.5, 10.9)
Bayley PDI 90.5 96.5 6.0 (3.6, 8.4) 5.8 (2.8, 8.7) 6.0 (3.6, 8.4)
* Adjusted for child’s gender and birth order, maternal age, education score, social class, maternal head circumference, and height and whether the mother smoked during pregnancy.
† Adjusted for factors that changed the regression coefficient byⱖ10%25: for the MDI, only social class and maternal education fulfilled
Our subgroup analyses according to gender were planned because of our finding that feeding preterm infants nutrient-enriched rather than standard for-mula in the neonatal unit conferred a long-term ad-vantage in males but not females.25 We found no significant interaction between diet and gender in respect of Bayley MDI or PDI scores at 18 months (Table 3), but there was a significant interaction be-tween gender and diet for the overall developmental quotient at 9 months. Girls fed the enriched formula had significantly lower scores in all subscales and in overall developmental quotient.
Infants receiving enriched formula had a greater gain in occipitofrontal head circumference by 9 and 18 months than those fed standard formula, and the differences were larger in girls,18 suggesting better brain growth in children fed the enriched formula, especially in girls. It was surprising therefore to find that girls born SGA at term who were fed the en-riched formula had lower developmental scores at 9 months.
We do not understand the reason for this finding, and because we did not use a robust, validated test at this age, we do not wish to overstate its importance. Nevertheless, our findings are not without prece-dent. A previous randomized trial suggested that increasing protein intake in the neonatal unit could increase risk of neurodevelopmental disadvantage in low birth weight infants, particularly in girls.26 Gold-man et al27randomized 304 infants to diets contain-ing either 2% or 4% protein, and 234 of 293 survivors were followed up at age 3. Those on the 4% protein milk had a significantly higher prevalence of strabis-mus, and among those children with birth weights ⬍10th centile, 47% on the higher-protein diet versus 23% on the lower-protein diet had Stanford Binet IQ scores⬍90 at 3 years of age (P⫽ .05).
Interestingly, 46% of boys on the higher- versus 41% on the lower-protein diet had IQ scores ⬍90, whereas, in girls, 37% on the higher- versus 20% on the lower-protein diet had scores⬍90. However, this latter difference was not statistically significant. We calculated the proportion of children with Bayley MDI scores⬍90 in our study. Among girls, 56% of those on the enriched formula had MDI scores⬍90% vs 40% on the standard formula, but this difference was not statistically significant (95% CI for differ-ence: ⫺0.2; 34.0%). Among boys, 67% on enriched milk versus 63% on standard milk had low scores.
However, the diets in the 2 studies are not strictly comparable. The difference in protein content in our study (1.85% vs 1.45%) was not nearly as extreme as in the study by Goldman et al,27 and indeed both formulas in our study had a total protein content below that of the low-protein formula in the study by Goldman et al. Furthermore, in the earlier study, protein was increased without providing additional energy so it could be used,27whereas, in our study, fat and carbohydrate content was also higher in the enriched formula.
More importantly, and regardless of whether our findings at 9 months are reliable, we have shown that neither boys nor girls born SGA at term derived a
neurodevelopmental advantage from receiving a nu-trient-enriched milk for the first 9 months.
Future follow-up of this cohort will determine whether there are any longer-term neurodevelop-mental effects of feeding enriched formula to SGA infants.
Breastfeeding Versus Formula Feeding Comparison There is now a large body of evidence demonstrat-ing that breastfed children have a cognitive or devel-opmental advantage over formula-fed children, but this is only the second study to investigate this issue in children born SGA, a group at increased risk of neurodevelopmental disadvantage.
Anderson et al28recently reviewed studies, includ-ing ours in preterm infants,29that could adjust for at least 5 potentially confounding factors and found that the advantage generally remained after such adjustment. There have also been 2 published studies involving subjects born at a time when infants from the least-advantaged strata of society were more likely to be breastfed. Hoeffer and Hardy30 studied children born in the United States between 1915 and 1921 and showed that breastfed children performed better than those who were fed artificially, although children who were exclusively breastfed beyond 9 months did less well. A study of elderly subjects born in the United Kingdom in the 1930s showed that, despite lower socioeconomic status, those who were breastfed had higher unadjusted IQ scores.31 Additional evidence comes from a large study in Hong Kong, recruiting children born between 1967 and 1976.
As we and others have pointed out,28,29,33 the re-maining advantage after adjustment could be at least partly due to residual confounding, and we almost certainly failed to identify and accurately measure all confounding factors. In this study, adjustment for confounding factors that we measured accounted for ⬃34% of the observed association between breast-feeding and MDI score. Thus in this group of chil-dren born SGA, residual confounding would have to account for 66% of the association between breast-feeding and MDI score. This is not impossible, but we consider it unlikely.
The advantage in terms of Bayley PDI scores was not at all reduced by similar adjustment. PDI scores were not significantly related to factors associated with maternal choice to breastfeed, thus we can be reasonably confident that this finding is not because of residual confounding. The only other study to report a motor advantage for breastfed infants was that of Ounsted et al,34which, like ours, was a study of infants born SGA. They assessed 137 infants born SGA at 12 months of age and found that breastfed infants had significantly higher motor scores, whereas there was no difference in social scores.
CONCLUSIONS
sig-nificant intergroup difference in Bayley MDI or PDI scores at 18 months, and at 9 months children fed the enriched formula had a significantly lower mean developmental quotient than those fed standard for-mula. The difference was especially marked in girls. Additional evidence is needed before we can rec-ommend feeding nutrient-enriched formula to chil-dren born SGA. Our findings here suggest that the enhancement in linear growth using enriched for-mula might be offset by reduced developmental scores at 9, although not 18, months. Later follow-up is needed to determine whether such an intervention would have a long-term effect on health or develop-ment.
Breastfeeding conferred a neurodevelopmental ad-vantage, as well as an advantage in terms of growth.18In this study of SGA children we demon-strated a substantial 6-point advantage in the Bayley motor scale as well an advantage in the mental scale. Breastfeeding is recommended for all infants, and it seems that it may be especially beneficial in those born SGA.
ACKNOWLEDGMENTS
Farley Health Products, a division of H.J. Heinz Company Ltd (Stockley Park, Uxbridge, United Kingdom), contributed funding and supplied the trial formulas.
We thank the Research Staff who collected data in the study (Corina Adams, Helena Clements, Helen Clough, Ann Humphries, Catherine Leeson-Payne, Geraldine McHugh, Julie Owen, Mary Quinn, Dawn Rodd, and Emma Sutton) and the parents who allowed their infants to participate.
REFERENCES
1. Grantham-McGregor SM. Small for gestational age, term babies, in the first six years of life.Eur J Clin Nutr. 1998;52(suppl 1):S59 –S64 2. Rantakallio P. A 14-year follow-up of children with normal and
abnor-mal birth weight for their gestational age. A population study.Acta Paediatr Scand. 1985;74:62– 69
3. Pryor J, Silva PA, Brooke M. Growth, development and behaviour in adolescents born small-for-gestational-age.J Paediatr Child Health. 1995; 31:403– 407
4. Low JA, Handley-Derry MH, Burke SO, et al. Association of intrauter-ine growth retardation and learning deficits at age 9 to 11 years.Am J Obstet Gynecol. 1992;167:1499 –1505
5. Lagerstrom M, Bremme K, Eneroth P, Janson CG. School marks and IQ test score for low birth weight children at the age of 13.Eur J Obstet Gynecol Reprod Biol. 1991;40:129 –136
6. Paz I, Gale R, Laor A, et al. The cognitive outcome of full-term small for gestational age infants at late adolescence. Obstet Gynecol. 1995;85: 452– 456
7. Westwood M, Kramer MS, Munz D, Lovett JM, Watters GV. Growth and development of full-term nonasphyxiated small-for-gestational-age newborns: follow-up through adolescence.Pediatrics. 1983;71:376 –382 8. Douglas JW, Gear R. Children of low birthweight in the 1946 national
cohort. Behaviour and educational achievement in adolescence.Arch Dis Child. 1976;51:820 – 827
9. Nilsen ST, Bergsjo P, Nome S. Male twins at birth and 18 years later.Br J Obstet Gynaecol. 1984;91:122–127
10. Hawdon JM, Hey E, Kolvin I, Fundudis T. Born too small–is outcome still affected?Dev Med Child Neurol. 1990;32:943–953
11. Richards M, Hardy R, Kuh D, Wadsworth ME. Birth weight and cog-nitive function in the British 1946 birth cohort: longitudinal population based study.BMJ. 2001;322:199 –203
12. Strauss RS. Adult functional outcome of those born small for gestational age: twenty-six-year follow-up of the 1970 British Birth Cohort.JAMA. 2000;283:625– 632
13. Dobbing J. Nutritional growth restriction and the nervous system. In: Davison AN, Thompson RHS, eds.The Molecular Basis of Neuropathology. London: Edward Arnold, 1981:221–223
14. Bedi KS. Effects of undernutrition during early life on granule cell numbers in the rat dentate gyrus.J Comp Neurol. 1991;311:425– 433 15. Dobbing J. Nutrition and the developing brain.Lancet. 1973;1(7793):48 16. Lucas A, Gore SMG, Cole TJ, et al. A multicentre trial on the feeding of low birthweight infants: effects of diet on early growth.Arch Dis Child. 1984;59:722–730
17. Lucas A, Fewtrell MS, Morley R, et al. Randomized trial of nutrient-enriched formula versus standard formula for postdischarge preterm infants.Pediatrics. 2001;108:703–711
18. Fewtrell MS, Morley R, Abbott RA, et al. Catch-up growth in small-for-gestational-age term infants: a randomized trial.Am J Clin Nutr. 2001; 74:516 –523
19. de Onis M, Habicht JP. Anthropometric reference data for international use: recommendations from a World Health Organization Expert Com-mittee.Am J Clin Nutr. 1996;64:650 – 658
20. Cole TJ, Freeman JV, Preece MA. British 1990 growth reference centiles for weight, height, body mass index and head circumference fitted by maximum penalized likelihood.Stat Med. 1998;17:407– 429
21. Morley R, Cole TJ, Powell R, Lucas A. Mother’s choice to provide breast milk and developmental outcome.Arch Dis Child. 1988;63:1382–1385 22. Bayley N.Bayley Scales of Infant Development. 2nd ed. San Antonio, TX:
The Psychological Corporation; 1993
23. Knobloch H, Pasamanick B, Sherard ES Jr. A developmental screening inventory for infants.Pediatrics. 1966;38:1095–1108
24. Greenland S. Modeling and variable selection in epidemiologic analy-ses.Am J Public Health. 1989;79:340 –349
25. A Lucas, R Morley, TJ Cole. Randomised trial of early diet in preterm babies and later intelligence quotient.BMJ. 1998;317:1481–1487 26. Goldman HI, Liebman OB, Freudenthal R, Reuben R. Effects of early
dietary protein intake on low-birth-weight infants: evaluation at 3 years of age.J Pediatr. 1971;78:126 –129
27. Goldman HI, Freudenthal R, Holland B, Karelitz S. Clinical effects of two different levels of protein intake on low-birth-weight infants.J Pe-diatr. 1969;74:881– 889
28. Anderson JW, Johnstone BM, Remley DT. Breast-feeding and cognitive development: a meta-analysis.Am J Clin Nutr. 1999;70:525–535 29. Lucas A, Morley R, Cole TJ, Lister G, Leeson Payne C. Breast milk and
subsequent intelligence quotient in children born preterm.Lancet. 1992; 339:261–264
30. Hoefer C. Hardy MC. Later development of breast fed and artificially fed infants.JAMA. 1929;92:615– 619
31. Gale CR, Martyn CN. Breastfeeding, dummy use, and adult intelli-gence.Lancet. 1996;347:1072–1075
32. Golding J, Rogers IS, Emmett PM. Association between breast feeding, child development and behaviour. Early Hum Dev. 1997;49(suppl): S175–S184
DOI: 10.1542/peds.113.3.515
2004;113;515
Pediatrics
MacFadyen and Alan Lucas
Ruth Morley, Mary S. Fewtrell, Rebecca A. Abbott, Terence Stephenson, Una
Reference Breastfed Group
Trial of Nutrient-Enriched Versus Standard Formula and Comparison With a
Neurodevelopment in Children Born Small for Gestational Age: A Randomized
Services
Updated Information &
http://pediatrics.aappublications.org/content/113/3/515
including high resolution figures, can be found at:
References
http://pediatrics.aappublications.org/content/113/3/515#BIBL
This article cites 31 articles, 10 of which you can access for free at:
Subspecialty Collections
sub
http://www.aappublications.org/cgi/collection/fetus:newborn_infant_
Fetus/Newborn Infant following collection(s):
This article, along with others on similar topics, appears in the
Permissions & Licensing
http://www.aappublications.org/site/misc/Permissions.xhtml
in its entirety can be found online at:
Information about reproducing this article in parts (figures, tables) or
Reprints
http://www.aappublications.org/site/misc/reprints.xhtml
DOI: 10.1542/peds.113.3.515
2004;113;515
Pediatrics
MacFadyen and Alan Lucas
Ruth Morley, Mary S. Fewtrell, Rebecca A. Abbott, Terence Stephenson, Una
Reference Breastfed Group
Trial of Nutrient-Enriched Versus Standard Formula and Comparison With a
Neurodevelopment in Children Born Small for Gestational Age: A Randomized
http://pediatrics.aappublications.org/content/113/3/515
located on the World Wide Web at:
The online version of this article, along with updated information and services, is
by the American Academy of Pediatrics. All rights reserved. Print ISSN: 1073-0397.