O R I G I N A L R E S E A R C H
Is Handgrip Strength a Useful Measure to Evaluate
Lower Limb Strength and Functional Performance
in Older Women?
This article was published in the following Dove Press journal: Clinical Interventions in Aging
Andre Luiz Felix
Rodacki 1
Natália Boneti Moreira 2 Arthur Pitta 1
Renata Wolf 1 Jarbas Melo Filho 1 Cintia de Lourdes Nahhas Rodacki 1,3
Gleber Pereira 1
1Department of Physical Education,
Federal University of Parana, Curitiba,
Brazil;2Department of Physiotherapy
Prevention and Rehabilitation, Federal University of Parana, Curitiba, Brazil;
3Department of Physical Education,
Paraná Technological Federal University, Paraná, Curitiba, Brazil
Aim:This study aimed to determine the association of handgrip strength with isometric and isokinetic strength (hip, knee and ankle extensor/flexor muscles), and functional capacity in older women.
Methods:The handgrip strength and lower limb strength of 199 older women (60–86 years) were measured using JAMAR and BIODEX dynamometers, respectively. Time Up and Go, Five-times-sit-to-stand and 6m-walk functional tests were evaluated. Pearson correlations were used to determine the relationship between variables. Regression analysis was applied to identify if HS was able to predict TUG performance. The effect of age was analyzed by splitting the participants in a group of older women (OLD; from 60 to 70 years old) and very old women (from 71 to 86 years old).
Results:The HS and isometric/isokinetic strength correlations were negligible/low and, in most cases, were non-significant. The correlation between handgrip strength and functional tests also ranged predominantly from negligible (r=0.0 to 0.3) to low (r=0.3 to 0.5), irrespective of the group age. The handgrip strength was not able to explain the variance of the TUG performance.
Conclusion: Generalizing handgrip strength as a practical and straightforward measure to determine lower limbs and overall strength, and functional capacity in older women must be viewed with caution. Handgrip strength and standard strength measures of the lower limbs and functional tests present a negligible/low correlation.
Keywords:aged, muscle strength, handgrip, functional capacity
Introduction
Aging has been related to a decline in muscle mass and strength, which may reduce functional capacity and increase disability, risk of fall and mortality in older adults.1,2These aged-related changes increase the dependence in performing activ-ities of daily living that substantially add to the healthcare costs.3 Thus, the assessment of muscle strength in older adults is relevant to determine muscle functioning and its related consequences.
Identifying the best muscle strength assessment in older adults is challenging, as a paramount of measures and protocols have been proposed. However, dynamo-metric handgrip and knee extension strength measures have predominated in older adult assessments.4 Isometric and isokinetic muscle contraction assessments have been preferred to reduce force-velocity influences. Although isokinetic dynam-ometer is the gold-standard evaluation of strength, its use is limited due to Correspondence: Andre Luiz Felix
Rodacki
Centro de Estudos do Comportamento Motor (CECOM), Universidade Federal do Paraná. Centro Politécnico, Jardim Botânico, Curitiba, PR, Brasil Tel\Fax +55 041 3360-4322 Email [email protected]
Clinical Interventions in Aging
Dove
press
open access to scientific and medical research
Open Access Full Text Article
Clinical Interventions in Aging downloaded from https://www.dovepress.com/ by 118.70.13.36 on 27-Aug-2020
portability and costs. Therefore, muscle strength assess-ments have often been limited to the use of handgrip strength (HS) measure (ie, via handheld devices), which is reported to present good reproducibility,5 inter-rater repeatability6and validity.7
Several studies have concluded that HS is a representative measure of overall body strength8,9 that predicts essential clinical outcomes,10–13although a number of issues are still unclear. For instance, HS measure is restricted to the upper segment muscles, which may not directly represent the strength status of the lower limbs. It seems mandatory to determine the strength of the lower limbs when predictions are related to functional capacity and risk of falling rather than measuring strength in dissociated sites. Besides, the validity of the HS test is underexplored, since most studies have focused on the relationship between the HS and the isometric/isoki-netic strength of kneeflexor/extensor muscles.14–16There is a paucity of studies correlating the HS with the strength of the ankle and hip joints, as they are also related to functional capacity and risk of falls.17Furthermore, most studies have included a reduced number of participants, ranging from 2014,16to 3917older adults, which is a significant methodolo-gical limitation.
Handgrip strength and isometric strength of the knee extensor muscles are highly correlated (r = 0.91);16 how-ever, isometric measurements are poor predictors of dynamic performance.18 Isometric tests are little specific when considering functional tests, as they encompass dynamic demands. The HS has been proposed as a valid measurement based on its correlation with dynamic lower limb strength measured by functional tests (eg, Time Up and Go and Timed walk tests), presenting moderate to high coefficients (ranging from 0.63 to 0.94).7 However, conclusions must be viewed with caution since they assessed a limited number of participants (n = 10).
The participants’ age is an additional aspect that has been relatively neglected in the literature. Older adults are expected to experience less pronounced HS and functional performance effects in comparison to very old counterparts, as age significantly impacts on strength. It has been recently demonstrated that HS predicts falls among young and older adults (from 60 to 79 years old), whereas, it fails to identify fall prevalence in very old adults (eg, ≥80 years old).19 Thus, it is not known whether the relationship between HS and the isometric/isokinetic strength among old and very old adults is influenced to the same extent.
Therefore, this study was designed to determine: i) the association between HS and the isometric and isokinetic
strength of the lower limb joints in older women; ii) the association between HS and functional capacity in older women; and iii) whether the relationships between HS and isometric and isokinetic strength, and functional capacity are influenced by age. These results are of interest for those involved in epidemiological studies regarding strength and functional capacity measurements, especially those that rely on HS to determine clinical outcomes in old and very old adults. It was hypothesized that HS and the performance of isometric and isokinetic will present small correlations. It was also hypothesized that HS and func-tional capacity are not correlated and that HS measures are unable to explain functional capacity. Finally, it was the expected age to influence the strength of the correlations between HS and isometric and isokinetic strength and functional performance. These results are also of clinical interest as a large number of intervention protocols, patient classifications, and outcome assessments involving the lower limbs are based on HS measurements.
Methods
Participants and Participants
’
Involvement
The data for this cross-sectional study were obtained between 2016 and 2018 from older women recruited from the local community (via flyers, folders and social networks) in Curitiba, Brazil, a city of 197,965 individuals aged 60 or older. Sample size was calculated using the Epi info calculator developed by Center of Disease Control and Prevention20 using the following parameters: (i) the population of older adults from Curitiba; (ii) 80% confi -dence level; (iii) sampling error of 5%; (iv) 50% of antici-pated frequency, considering the maximum variance; and (v) 10% margin for possible losses and refusals. Therefore, the initial sample size estimated was 182 older adults.
Thus, our data were obtained from participants involved in five different studies, previously performed in the same laboratory that has included HS, isometric/isokinetic and functional capacity tests. Data collection was conducted by trained researchers, with at least three years of experience, who attended a training program designed to standardize all procedures and measurements performed in each study. Although participants were recruited from different studies based on the following inclusion criteria: 60 years or older, did not suffer from cognitive or medical problems that limited their ability to perform the tests and were able to conclude all procedures. The individuals did not participate in any training program and lived independently. All
Clinical Interventions in Aging downloaded from https://www.dovepress.com/ by 118.70.13.36 on 27-Aug-2020
participants responded to the validated and adapted Portuguese version of the Mini Mental test21 and were deemed as able to understand all instructions and demands involved in the experiments in all studies. The exclusion criteria were as follows: individuals with unstable cardio-vascular disease, acute infections and tumors, with knee or hip prostheses. The data from 199 older women were ana-lyzed; however, not all participants were involved in all tests as some studies had different purposes. The number of participants in each test is reported accordingly. The effect of age was verified by dividing the sample into two halves (using the median as a criterion) to obtain a group of old (OLD, from 60 to 70 old, n = 97; 66.15 ± 2.19 years-old; 1.57 ± 0.07 m; 68.1± 13.0 kg) and very old adults (VOD, from 71 to 86 years-old, n = 107; 74.26 ± 4.21; 1.56 ± 0.07 m; 69.8 ± 12.4 kg). The data of all participants are also provided (ALL). The University Ethics Committee approved the procedures of all experiments and all partici-pants gave written consent to participate in each study.
Instruments and Procedures
Muscle Strength
As a general rule, the assessments ranged from one to three sessions and followed identical procedures. Participants went through a preliminary face-to-face interview to collect personal and anthropometric data. The HS was assessed in the first session (Jamar® dynamometer), while the other assessments were conducted in the remaining sessions. The HS measure was assessed in the dominant hand and, while the individuals were seated in an upward position with the elbow in 90° of flexion.22 The average obtained from three trials was used for analysis purposes. The Jamar hand dynamometer is the most widely used instrument to evaluate HS, presenting 0.5 kg of accuracy and high level of test-retest, inter-rater and intra-rater reliability to older adults (ICC≥0.85).23
The isometric tests of the lower limbs (ankle, knee and hip joints) were followed by the isokinetic dynamic tests, which are considered as the gold-standard for muscle strength assessments [Liberatori 24], at two speeds (60°.s−1and 180°.s−1) (Biodex Medical Systems, Inc. Shirley, NY, USA). The joint angle for the isometric test of the knee joint was set at 60°, the hip joint at 105° and the ankle joint in a neutral position, according to the manufacturer guidelines.25 During the isometric test, the dynamometer maintains zero velocity at any selected point in the range of motion in such a way that changes in joint angle and overall muscle length do not occur.
Joint and speed were randomly tested with an interval of 3–5 min imposed between trials. Prior testing, a period of familiarization for the HS and isometric/isokinetic tests was allowed, which included 3–5 repetitions to minimize learning effects. Familiarization was discontin-ued when differences between the last two measurements were smaller than 5%. The intraclass correlation coeffi -cients of isokinetic test-retest are high (hipflexion≥0.89; hip extension≥0.88; kneeflexion≥0.94 and knee exten-sion ≥0.88 and dorsiflexion≥0.8).26,27
Functional Capacity
The functional tests were generally performed in the last session and included the Time Up and Go (TUG, walking 3 m around a cone and returning to a seated position at their normal gait speed),25 the Five-times-sit-to-stand test (5STS, five times sit to stand test from an armless chair and having both hands crossed against the chest)28and the 6m-walk test (W6M).29Reliability and validity have been reported as high to moderate in older adults, from 0.75 to 0.99 in the TUG,30from 0.63 to 0.9531 in the 5STS,7and from 0.52 to 0.95 in the W6M.30 A comprehensive description of these tests can be found elsewhere.25,28,29
Statistical Analyses
Descriptive statistics were presented as means ± SD and comparisons between age groups were performed using unpaired t-tests. The Pearson correlation coefficient was calculated to determine the HS relationship with isometric and isokinetic strength and functional capacity. The corre-lation coefficients between 0 and 0.3 were considered negligible; >0.3 and 0.5, low; >0.5 and 0.7, moderate, >0.7 and 0.9, high; >0.9 and 1.0, very high.32 The Benjamini-Hochberg procedure33 was applied to reduce the false discovery rate and the p values refer to the adjusted p values. In addition, Effect size (ES), Power and Minimal Detectable Change (MDC) were calculated.
A multiple linear regression analysis was performed having the TUG (a functional measure) as the dependent variable and the strength measures as the dependent vari-ables. The TUG was selected as a dependent variable as it has been described as one of the most representative functional measures. The isometric and the hip isokinetic measures were not included because the reduced number of data (missing values) would compromise the power of the analysis. Therefore, the HS and the isokinetic measures of the ankle and knee joints at 60°.s−1 and 180.s−1were included in the multiple linear regression analysis using
Clinical Interventions in Aging downloaded from https://www.dovepress.com/ by 118.70.13.36 on 27-Aug-2020
a“forced entry”approach. The multiple linear regression was performed separately for all participants (ALL) and for each group (OLD and VOD) to determine the contri-bution of each dependent variable in the regression model. All statistical tests were performed with the Wizard Pro Software (version 1.9.21). The significance level to the was set at p<0.05.
Results
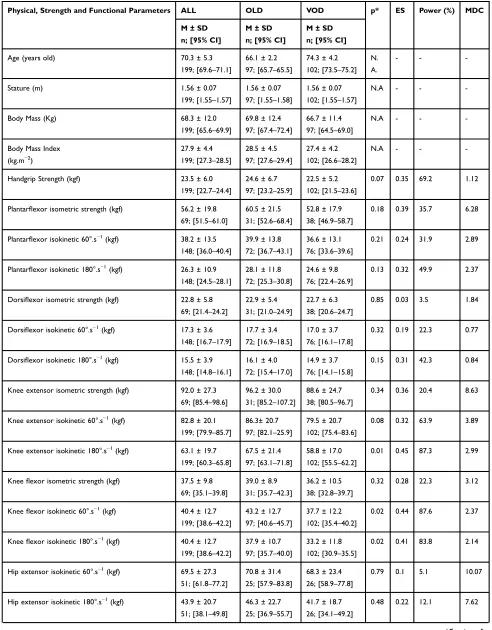
The results indicated that HS of the VOD was 8.5% lower than the OLD group (n.s; p=0.07). There were no differ-ences between groups in the ankle and hip muscles, irre-spective of the test (isometric, 60°.s−1 or 180°.s−1). The isometric strength of the knee muscles did not differ between groups. On the other hand, the performance of the knee muscles in the isokinetic tests was lower in the VOD in comparison to the OLD group, especially for the knee flexor muscles, irrespective of the test speed. The 5STS test did not differ between groups. However, the OLD group presented a better performance in the TUG test (10%; p<0.02). The performance of the VOD was worse than in the OLD group in the W6M test (15% slower), although the significance level was borderline (p=0.08). The HS, lower limb isometric and isokinetic strength and functional tests of both groups are presented inTable 1.
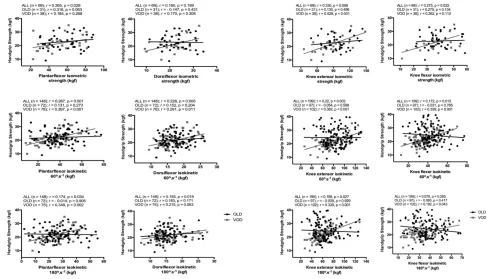
The correlation coefficients between HS and isometric and isokinetic strength of the ankle muscles tested are presented in Figure 1. The HS was positively correlated with the isokinetic strength of the ankle muscles, although the magnitudes ranged from low to moderate. Such corre-lations revealed that HS explains a small fraction of the variation of the isokinetic torque (ie, <16%), irrespective of the test speed or age.
The HS was positively correlated with the isokinetic strength of the knee muscles (Figure 2); however, in most cases, the correlation coefficients varied from negligible to low (r < 0.4). Therefore, the HS explained a small fraction of the knee strength variance. The largest correlation was found between HS and isometric strength of the knee extensors, which explains approximately 25% of the HS variance.
The negative association between HS and isokinetic strength of hip muscles was observed, irrespective of the test speed. On the other hand, the isokinetic strength of the hip flexors test showed a non-significant and negligible correlation with the HS (from 0.014 to 0.053). The iso-kinetic strength of the hip flexors at 180°.s−1 presented
a moderate correlation with the HS (r = 0.55; p < 0.001). The HS and the functional tests presented negligible and non-significant correlations (ie, <0.13), irrespective of the age group (Figure 2). Age was negatively correlated with HS (p<0.05). It is interesting to note that age explains less than 10% of the HS variance in OLD and VOD groups (Table 2).
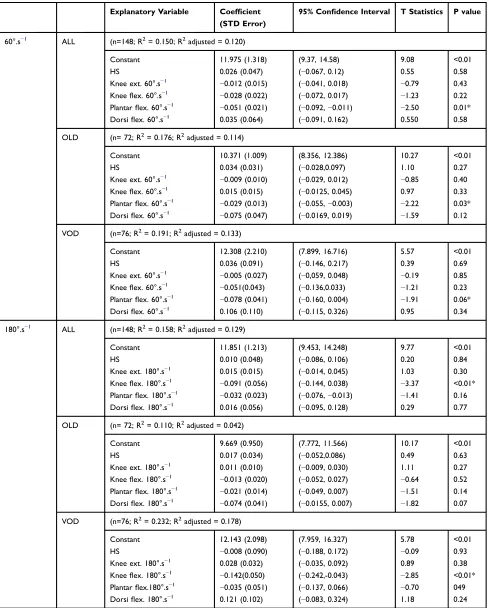
The linear multiple regression analyses (see Table 3) revealed a low ability of the strength measurements to predict the TUG performance (R2 ranging from 0.18 to 0.23), irrespective of the age group or isokinetic test speed. The torque of the plantar flexor muscles was the only significant measure to explain TUG performance when the test was set at 60°.s−1. The plantarflexor torque at 60°. s−1 was significant for ALL, OLD and borderline for the VOD group. The regression equation, including HS and the ankle and knee isokinetic tests performed at 180°.s−1, indi-cated a small but significant contribution of the kneeflexor muscles peak torque for ALL and VOD groups. It is inter-esting to note that HS failed to significantly explain TUG performance, irrespective of the age of the participants. The detailed regression models are presented inTable 3.
Discussion
The HS was similar to the normative data34 and corre-sponded to the percentile 70 in the group aged 60–69 years old (ie, 24.6 kg). Small variations between studies may be attributed to several factors such as device calibration, postural variance and functional status. However, the VOD group corresponded to the percentile 90 of the nor-mative data34to the group aged 70 or older (ie, 23.8 kg). The statistics did not confirm the existence of significant differences between age groups, as the HS was only 8.5% smaller in the VOD. However, as expected, HS reduced with age,35 which was negatively and poorly correlated with age (r=−0.23–0.29).3It may be the case that age, as a chronological marker, explains no more than 10.0% of the HS, whereas overall physicalfitness may play a more relevant contribution. Indeed, not all individuals have reduced strength as they age.36It seems that muscle func-tioning in the upper limbs has a less steep decline than lower limbs muscle groups and a less pronounced differ-ence between age groups may have occurred.
The correlation between HS and lower limb strength ranged from negligible to low and was predominantly non-significant. These results are contrasting with others that have reported positive, but low (r = 0.44)4and moderate correlations (r = 0.67; r = 0.67),3,37while assessing HS and
Clinical Interventions in Aging downloaded from https://www.dovepress.com/ by 118.70.13.36 on 27-Aug-2020
Table 1 Physical Characteristics, Handgrip Strength, Isometric and Isokinetic Strength of the Ankle, Knee and Hip Flexor, and Extensor Muscles, and Functional Tests of All (ALL), Older (OLD) and Very Old (VOD) Participants
Physical, Strength and Functional Parameters ALL OLD VOD p* ES Power (%) MDC
M ± SD
n; [95% CI]
M ± SD
n; [95% CI]
M ± SD
n; [95% CI]
Age (years old) 70.3 ± 5.3
199; [69.6–71.1]
66.1 ± 2.2
97; [65.7–65.5]
74.3 ± 4.2
102; [73.5–75.2] N.
A.
- -
-Stature (m) 1.56 ± 0.07
199; [1.55–1.57]
1.56 ± 0.07
97; [1.55–1.58]
1.56 ± 0.07
102; [1.55–1.57]
N.A - -
-Body Mass (Kg) 68.3 ± 12.0
199; [65.6–69.9]
69.8 ± 12.4
97; [67.4–72.4]
66.7 ± 11.4
97; [64.5–69.0]
N.A - -
-Body Mass Index
(kg.m−2)
27.9 ± 4.4
199; [27.3–28.5]
28.5 ± 4.5
97; [27.6–29.4]
27.4 ± 4.2
102; [26.6–28.2]
N.A - -
-Handgrip Strength (kgf) 23.5 ± 6.0
199; [22.7–24.4]
24.6 ± 6.7
97; [23.2–25.9]
22.5 ± 5.2
102; [21.5–23.6]
0.07 0.35 69.2 1.12
Plantarflexor isometric strength (kgf) 56.2 ± 19.8
69; [51.5–61.0]
60.5 ± 21.5
31; [52.6–68.4]
52.8 ± 17.9
38; [46.9–58.7]
0.18 0.39 35.7 6.28
Plantarflexor isokinetic 60°.s−1(kgf) 38.2 ± 13.5
148; [36.0–40.4]
39.9 ± 13.8
72; [36.7–43.1]
36.6 ± 13.1
76; [33.6–39.6]
0.21 0.24 31.9 2.89
Plantarflexor isokinetic 180°.s−1(kgf) 26.3 ± 10.9
148; [24.5–28.1]
28.1 ± 11.8
72; [25.3–30.8]
24.6 ± 9.8
76; [22.4–26.9]
0.13 0.32 49.9 2.37
Dorsiflexor isometric strength (kgf) 22.8 ± 5.8
69; [21.4–24.2]
22.9 ± 5.4
31; [21.0–24.9]
22.7 ± 6.3
38; [20.6–24.7]
0.85 0.03 3.5 1.84
Dorsiflexor isokinetic 60°.s−1(kgf) 17.3 ± 3.6
148; [16.7–17.9]
17.7 ± 3.4
72; [16.9–18.5]
17.0 ± 3.7
76; [16.1–17.8]
0.32 0.19 22.3 0.77
Dorsiflexor isokinetic 180°.s−1
(kgf) 15.5 ± 3.9
148; [14.8–16.1]
16.1 ± 4.0
72; [15.4–17.0]
14.9 ± 3.7
76; [14.1–15.8]
0.15 0.31 42.3 0.84
Knee extensor isometric strength (kgf) 92.0 ± 27.3
69; [85.4–98.6]
96.2 ± 30.0
31; [85.2–107.2]
88.6 ± 24.7
38; [80.5–96.7]
0.34 0.36 20.4 8.63
Knee extensor isokinetic 60°.s−1(kgf) 82.8 ± 20.1
199; [79.9–85.7]
86.3± 20.7
97; [82.1–25.9]
79.5 ± 20.7
102; [75.4–83.6]
0.08 0.32 63.9 3.89
Knee extensor isokinetic 180°.s−1(kgf) 63.1 ± 19.7
199; [60.3–65.8]
67.5 ± 21.4
97; [63.1–71.8]
58.8 ± 17.0
102; [55.5–62.2]
0.01 0.45 87.3 2.99
Kneeflexor isometric strength (kgf) 37.5 ± 9.8
69; [35.1–39.8]
39.0 ± 8.9
31; [35.7–42.3]
36.2 ± 10.5
38; [32.8–39.7]
0.32 0.28 22.3 3.12
Kneeflexor isokinetic 60°.s−1(kgf) 40.4 ± 12.7
199; [38.6–42.2]
43.2 ± 12.7
97; [40.6–45.7]
37.7 ± 12.2
102; [35.4–40.2]
0.02 0.44 87.6 2.37
Kneeflexor isokinetic 180°.s−1(kgf) 40.4 ± 12.7
199; [38.6–42.2]
37.9 ± 10.7
97; [35.7–40.0]
33.2 ± 11.8
102; [30.9–35.5]
0.02 0.41 83.8 2.14
Hip extensor isokinetic 60°.s−1(kgf) 69.5 ± 27.3
51; [61.8–77.2]
70.8 ± 31.4
25; [57.9–83.8]
68.3 ± 23.4
26; [58.9–77.8]
0.79 0.1 5.1 10.07
Hip extensor isokinetic 180°.s−1(kgf) 43.9 ± 20.7
51; [38.1–49.8]
46.3 ± 22.7
25; [36.9–55.7]
41.7 ± 18.7
26; [34.1–49.2]
0.48 0.22 12.1 7.62
(Continued)
Clinical Interventions in Aging downloaded from https://www.dovepress.com/ by 118.70.13.36 on 27-Aug-2020
knee extensor strength in frail elderly. Norman and colleagues38 have reported a high correlation between HS and isometric strength of the knee extensor in cancer patients (r = 0.75). Felicio and colleagues39 presented
negligible to low correlation coefficients (r = 0.09 to 0.26) between HS and the knee peak torques (n = 221), while others40 found only a low correlation (r = 0.43). These
findings do not endorse that HS can be used as a surrogate Table 1(Continued).
Physical, Strength and Functional Parameters ALL OLD VOD p* ES Power (%) MDC
M ± SD
n; [95% CI]
M ± SD
n; [95% CI]
M ± SD
n; [95% CI]
Hipflexor isokinetic 60°.s−1(kgf) 58.5 ± 12.1
51; [55.1–61.9]
61.5 ± 13.1
25; [56.1–66.9]
55.6 ± 10.5
26; [51.3–59.8]
0.15 0.49 42.5 4.45
Hipflexor isokinetic 180°.s−1(kgf) 46.6 ± 10.7
51; [43.5–49.7]
50.1 ± 10.8
25; [45.6–54.5]
43.2 ± 9.7
26; [39.3–47.1]
0.13 0.67 66.9 3.95
5STS (s) 11.5 ± 3.42
196; [11.0–11.98]
11.1 ± 3.21
96; [10.5–11.8]
11.83 ± 3.6
100; [11.1–12.5]
0.47 0.21 32.3 0.64
TUG (s) 9.32 ± 2.58
198; [8.95–9.68]
8.63 ± 1.33
97; [8.35–8.89]
9.97± 3.23
102; [9.33–10.65]
0.02 0.54 97.1 0.48
W6M (s) 7.68 ± 1.67
199; [7.44–7.97]
7.30 ± 1.27
97; [7.04–7.55]
8.05 ± 1.91
102; [7.62–8.24]
0.08 0.46 90.6 0.31
Notes:OLD = 60 to 70 years old; VOD = 71 to 86 years old. p* = adjusted Benjamini-Hochberg Procedure.
Abbreviations:M, mean; S.D., standard deviation; n, number of participants assessed; 95%CI, 95% confidence interval; 5STS,five times sit-to-stand test; TUG, time up and go test; W6M, 6-meter walk test; p, significance level; N.A., not applicable; ES, effect size; MDC, minimal detectable change.
Figure 1Handgrip strength correlations with isometric and isokinetic strength at 60°.s−1and 180°.s−1of the plantarflexor and dorsiflexor muscles (left panel) and of the extensor andflexor muscles of the knee (right panel). Correlation coefficient (r) and number of participants (n) for all individuals (ALL) and divided by group (OLD: 60–70 years-old; VOD: 71–86 years-old).
Clinical Interventions in Aging downloaded from https://www.dovepress.com/ by 118.70.13.36 on 27-Aug-2020
for quadriceps strength measurements, irrespective of the test speed (60°.s−1or 180°.s−1). The data from the ankle and hip joints for both muscle group pairs (flexors and exten-sors) also suggest a negligible or low association between HS and isometric or isokinetic strength.
The argument that an unequivocal relationship subsists between HS and lower segment strength, it was not sup-ported in any of the lower limb joints, irrespective of age and test speed. Although a positive correlation has been reported and some advantages are advocated in favor of
Figure 2Handgrip strength correlations with isokinetic strength at 60°.s−1and 180°.s−1of hip extensor andflexor muscles (left panel) and with the functional tests (right panel). Correlation coefficient (r) and number of participants (n) for all individuals (ALL) and divided by group (OLD: 60–70 years-old; VOD: 71–86 years-old).
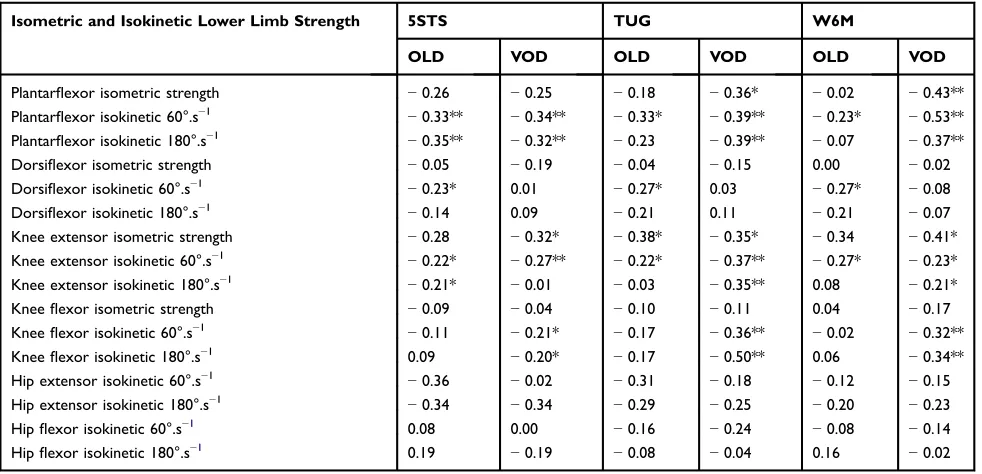
Table 2Correlations of Isometric and Isokinetic Strength at 60°.s−1and 180°.s−1of Plantar Flexor, Dorsiflexor, Extensor and Flexor
Muscles of the Knee and Hip Joints with Functional Tests and Age Groups
Isometric and Isokinetic Lower Limb Strength 5STS TUG W6M
OLD VOD OLD VOD OLD VOD
Plantarflexor isometric strength −0.26 −0.25 −0.18 −0.36* −0.02 −0.43**
Plantarflexor isokinetic 60°.s−1 −0.33** −0.34** −0.33* −0.39** −0.23* −0.53**
Plantarflexor isokinetic 180°.s−1 −0.35** −0.32** −0.23 −0.39** −0.07 −0.37**
Dorsiflexor isometric strength −0.05 −0.19 −0.04 −0.15 0.00 −0.02
Dorsiflexor isokinetic 60°.s−1 −0.23* 0.01 −0.27* 0.03 −0.27* −0.08
Dorsiflexor isokinetic 180°.s−1 −0.14 0.09 −0.21 0.11 −0.21 −0.07
Knee extensor isometric strength −0.28 −0.32* −0.38* −0.35* −0.34 −0.41*
Knee extensor isokinetic 60°.s−1 −0.22* −0.27** −0.22* −0.37** −0.27* −0.23*
Knee extensor isokinetic 180°.s−1 −0.21* −0.01 −0.03 −0.35** 0.08 −0.21*
Kneeflexor isometric strength −0.09 −0.04 −0.10 −0.11 0.04 −0.17
Kneeflexor isokinetic 60°.s−1 −0.11 −0.21* −0.17 −0.36** −0.02 −0.32**
Kneeflexor isokinetic 180°.s−1 0.09 −0.20* −0.17 −0.50** 0.06 −0.34**
Hip extensor isokinetic 60°.s−1 −0.36 −0.02 −0.31 −0.18 −0.12 −0.15
Hip extensor isokinetic 180°.s−1 −0.34 −0.34 −0.29 −0.25 −0.20 −0.23
Hipflexor isokinetic 60°.s−1 0.08 0.00 −0.16 −0.24 −0.08 −0.14
Hipflexor isokinetic 180°.s−1 0.19 −0.19 −0.08 −0.04 0.16 −0.02
Notes:OLD: 60–70 years old; VOD: 71–86 years old. *p < 0.05, **p < 0.01.
Abbreviations:5STS,five-times-sit-to-stand; TUG, time up and go; W6M, 6m-walk test.
Clinical Interventions in Aging downloaded from https://www.dovepress.com/ by 118.70.13.36 on 27-Aug-2020
Table 3Linear Multiple Regression Analysis to Predict TUG Performance Using Strength Measurements (HS, Isokinetic Torque of the Ankle and Knee Joints) for All Participants (ALL), Old Adults (OLD) and Very Old Adults (VOD)
Explanatory Variable Coefficient (STD Error)
95% Confidence Interval T Statistics P value
60°.s−1 ALL (n=148; R2= 0.150; R2adjusted = 0.120)
Constant 11.975 (1.318) (9.37, 14.58) 9.08 <0.01
HS 0.026 (0.047) (−0.067, 0.12) 0.55 0.58
Knee ext. 60°.s−1 −0.012 (0.015) (−0.041, 0.018) −0.79 0.43
Kneeflex. 60°.s−1 −0.028 (0.022) (−0.072, 0.017) −1.23 0.22
Plantarflex. 60°.s−1 −0.051 (0.021) (−0.092,−0.011) −2.50 0.01*
Dorsiflex. 60°.s−1 0.035 (0.064) (−0.091, 0.162) 0.550 0.58
OLD (n= 72; R2= 0.176; R2adjusted = 0.114)
Constant 10.371 (1.009) (8.356, 12.386) 10.27 <0.01
HS 0.034 (0.031) (−0.028,0.097) 1.10 0.27
Knee ext. 60°.s−1 −0.009 (0.010) (−0.029, 0.012) −0.85 0.40
Kneeflex. 60°.s−1 0.015 (0.015) (−0.0125, 0.045) 0.97 0.33
Plantarflex. 60°.s−1 −0.029 (0.013) (−0.055,−0.003) −2.22 0.03*
Dorsiflex. 60°.s−1 −0.075 (0.047) (−0.0169, 0.019) −1.59 0.12
VOD (n=76; R2= 0.191; R2adjusted = 0.133)
Constant 12.308 (2.210) (7.899, 16.716) 5.57 <0.01
HS 0.036 (0.091) (−0.146, 0.217) 0.39 0.69
Knee ext. 60°.s−1 −0.005 (0.027) (−0,059, 0.048) −0.19 0.85
Kneeflex. 60°.s−1 −0.051(0.043) (−0.136,0.033) −1.21 0.23
Plantarflex. 60°.s−1 −0.078 (0.041) (−0.160, 0.004) −1.91 0.06*
Dorsiflex. 60°.s−1 0.106 (0.110) (−0.115, 0.326) 0.95 0.34
180°.s−1 ALL (n=148; R2= 0.158; R2adjusted = 0.129)
Constant 11.851 (1.213) (9.453, 14.248) 9.77 <0.01
HS 0.010 (0.048) (−0.086, 0.106) 0.20 0.84
Knee ext. 180°.s−1 0.015 (0.015) (−0.014, 0.045) 1.03 0.30
Kneeflex. 180°.s−1 −0.091 (0.056) (−0.144, 0.038) −3.37 <0.01*
Plantarflex. 180°.s−1 −0.032 (0.023) (−0.076,−0.013) −1.41 0.16
Dorsiflex. 180°.s−1 0.016 (0.056) (−0.095, 0.128) 0.29 0.77
OLD (n= 72; R2= 0.110; R2adjusted = 0.042)
Constant 9.669 (0.950) (7.772, 11.566) 10.17 <0.01
HS 0.017 (0.034) (−0.052,0.086) 0.49 0.63
Knee ext. 180°.s−1 0.011 (0.010) (−0.009, 0.030) 1.11 0.27
Kneeflex. 180°.s−1 −0.013 (0.020) (−0.052, 0.027) −0.64 0.52
Plantarflex. 180°.s−1 −0.021 (0.014) (−0.049, 0.007) −1.51 0.14
Dorsiflex. 180°.s−1 −0.074 (0.041) (−0.0155, 0.007) −1.82 0.07
VOD (n=76; R2= 0.232; R2adjusted = 0.178)
Constant 12.143 (2.098) (7.959, 16.327) 5.78 <0.01
HS −0.008 (0.090) (−0.188, 0.172) −0.09 0.93
Knee ext. 180°.s−1 0.028 (0.032) (−0.035, 0.092) 0.89 0.38
Kneeflex. 180°.s−1 −0.142(0.050) (−0.242,-0.043) −2.85 <0.01*
Plantarflex.180°.s−1 −0.035 (0.051) (−0.137, 0.066) −0.70 049
Dorsiflex. 180°.s−1 0.121 (0.102) (−0.083, 0.324) 1.18 0.24
Note:*Indicates significant differences.
Clinical Interventions in Aging downloaded from https://www.dovepress.com/ by 118.70.13.36 on 27-Aug-2020
HS tests (reliable, valid, noninvasive, inexpensive measure-ment, etc.) the magnitude of the correlation coefficients ranged from negligible to low and explained only a minor fraction of the variance of the lower limb strength. There are arguments that HS is of limited use since it does not provide a sensitive measure of strength after a period of training, although it has been widely used as a primary outcome in exercise-training interventions.41It may be the case that HS provides an accurate strength measure for the upper limbs, more specifically for the muscles involved in grip or pinch demands, but of little contribution to explaining the strength of other muscle sites. Therefore, the hypothesis that HS and the performance of isometric and isokinetic strength present small correlations was accepted.
Muscle strength is essential in many daily-life activ-ities that allow us to walk, stand from a chair, climb stairs and perform a paramount number of movements. Many researchers have used the HS as an overall strength measure4,35 and a predictor of disability in very old adults.42 Indeed, activities of daily living (eg, taking a bath, eating, dressing up) have been correlated to HS,42 as the use of upper limbs is far more required than in the functional tests used in the present study. Thus, replacing tests designed to determine the strength and the perfor-mance of the lower limbs by HS measures may neglect the specificity of the motor tasks involved in functional tests. Some studies have demonstrated such a negligibility, low, or no correlation between HS and functional tests.40,43 Therefore, HS may be only considered assessing upper body functional tests, due to it fails to explain changes in lower limb strength performance and functional tests.
On the other hand, the variance of lower limb func-tional tests, such as 5STS, TUG and W6M tests, can be partially explained by the strength of the lower limbs. Previous analyses have presented a low correlation between functional capacity and isometric knee extension strength.44The isometric and dynamic lower limb torque presented low to moderate correlations with functional tests. It seems that strength measures can not fully explain functional performance as it also relies on other character-istics such as muscle coordination, agility, flexibility and balance.45Besides, physical capacity and the performance to perform activities of daily living may not be remarkably influenced when strength is above to a certain minimum threshold.46 McGrath and colleagues47 have shown that decreased HS was related to increased odds for several daily life activities, which were associated with a higher hazard for mortality in older adults.
It is interesting to note a large number of significant correlations between the strength of the plantarflexor mus-cles and the functional tests in comparison to knee and hip joint muscles. For instance, there was no significant correla-tion between hip joint strength and funccorrela-tional tests. It is necessary to consider that most functional tests selected in the present study included gait, which has been considered to change in the presence of hip and knee extensor muscle weakness.48 In addition, it has been demonstrated that the plantar flexor muscles are primer movers and more demanded (ie, present a large mechanical demand) than the hip muscles.49The contribution of the plantarflexor muscles is advantageous to generate a large propulsive impulse at the end of the stance phase,50which increases the upward forces to rise and rotate the hip to improve pelvic gait.17Therefore, the strength of the plantar flexor muscles seemed to have a more prominent role during the gait and may partially explain the correlations between strength and functional tests. Indeed, the regression analysis revealed that the greater the peak torque of the ankle muscles (measured at 60°.s−1) the shorter was the TUG time.
On the other hand, when the speed of the force tests was set at 180°.s−1, the knee flexor muscles presented signifi -cance to explain TUG performance. Despite the significance level, only a small amount of the variance of the kneeflexors peak torque (9.0% and 14% for ALL and VOD groups, respectively) explains the functional outcome in the TUG test. This is in line with the idea that the rate of torque development of the knee flexors plays an important role when the walking speed increases.51 Therefore, it seems that the test speed is relevant as walking as fast as possible demands more fast and powerful actions of the muscles than strength itself.51
The W6M and TUG functional tests, selected in the present study, demonstrated a large dependence on the participants’ ability to walk at faster speeds. It has been shown that gait depends less on soleus muscle activation to push off at faster walking speeds,52 which is not a common characteristic among VOD individuals. Therefore, it may be assumed that very old adults rely more on the ankle muscles than their younger counter-parts, as declines in muscle strength are likely to present a more pronounced impact on the long-living senescence. This may explain why the VOD group showed a larger number of correlations between the ankle strength mea-sures and functional capacity than the OLD group.
The multiple regression revealed that force, as a stand-alone measure (ie, peak torque or HS), does not explain
Clinical Interventions in Aging downloaded from https://www.dovepress.com/ by 118.70.13.36 on 27-Aug-2020
the TUG performance, as it encompasses a plethora of complex components (eg, balance, coordination, agility, etc.) that are not fully captured while assessing a binary single-joint movement (ie, flexion/extension). In this con-text, it is not surprising that HS – a static measure per-formed in an unrelated body limb–was not able to explain functional capacity, irrespective of the participants’ age. Therefore, the hypothesis that HS is unable to explain functional capacity was accepted. On the other hand, the hypothesis that HS and strength measures and functional performance are influenced by age was not confirmed.
This study has some limitations to be considered while interpreting the results. First, the reduced period of familiarization (2–3 sessions on different days) may be not sufficient to reduce learning effects. Second, measurements performed in one lower limb may be influenced by the measurements obtained from both limbs. The good health status of our participants may have influenced our results and limit comparisons across studies that have assessed older adults with several comorbidities (eg, cancer, diabetes and cardiovascular diseases), as sedentarism is a coadjutant factor. Finally, no body mass correction was performed. As a general rule, correcting strength by body mass is performed to take into account differences in the amount of muscle mass, which is not the case as the fat content (infiltrated fat) is more likely to influence performance than muscle mass itself. In addition, differences in the body mass between groups were almost negligible (2.1 kg; ~3.0%).
Conclusions
In the present study, most correlations of HS with strength and functional tests were non-significant and the magnitudes ranged from negligible to low and, in a few cases, moderate. Although several studies have used the HS as a practical and straightforward measure to determine overall strength, and as a useful tool for screening large samples to predict falls and functional capacity in the dwelling-elderly women com-munity, our data do not support such findings. It may be related to the use of the small number of participants ana-lyzed in other studies. Furthermore, the correlation of HS and lower limb strength (isometric and isokinetic) with functional capacity was not influenced by age.
Data Sharing Statement
Data are available upon request.
Ethics Approval
All studies were approved by the Dom Bosco University Ethical Committee and were in accordance with the Declaration of Helsinki.
Consent to Participate
All participants signed an informed consent form.
Consent for Publication
All authors are aware that if accepted the Journal will have all rights regarding the publication.
Acknowledgments
The authors thank all researchers (Anna R. S. Gomes, Audrin S. Vojciechowski, Elisângela V. Rodrigues, Luiza H. Gallo, Paulo C. B. Bento, Sabrine N. Costa, Simone Biesek and Ryelen N. S. A. Garcia) who provided the data from their studies. All these studies were financed in part by the Coordenação de Aperfeiçoamento de Pessoal de Nível Superior–Brasil (CAPES) –Finance Code 001–PGPTA project.
Author Contributions
All authors contributed to data analysis, drafting or revising the article, gavefinal approval of the version to be published, and agree to be accountable for all aspects of the work.
Funding
This study derives from a number of studies in which some of them were funded by CAPES (Coordenação de Aperfeiçoamento de Pessoal de Nível Superior–Brazil).
Disclosure
The authors report no conflicts of interest in this work.
References
1. Briggs AM, Cross MJ, Hoy DG, et al. Musculoskeletal health conditions represent a global threat to healthy aging: a report for the 2015 world health organization world report on ageing and health.Gerontologist.
2016;56(Suppl 2):S243–55. doi:10.1093/geront/gnw002
2. Björk S, Juthberg C, Lindkvist M, et al. Exploring the prevalence and variance of cognitive impairment, pain, neuropsychiatric symptoms and ADL dependency among persons living in nursing homes; a cross-sectional study.BMC Geriatr.2016;16(1):154. doi:10.1186/s12877-016-0328-9 3. Martien S, Delecluse C, Boen F, et al. Is knee extension strength
a better predictor of functional performance than handgrip strength among older adults in three different settings?Arch Gerontol Geriatr.
2015;60(2):252–258. doi:10.1016/j.archger.2014.11.010
4. Buckley C, Stokes M, Samuel D. Muscle strength, functional endur-ance, and health-related quality of life in active older female golfers.
Aging Clin Exp Res.2017. doi:10.1007/s40520-017-0842-4
Clinical Interventions in Aging downloaded from https://www.dovepress.com/ by 118.70.13.36 on 27-Aug-2020
5. Mathiowetz V. Comparison of Rolyan and Jamar dynamometers for measuring grip strength. Occup Ther Int. 2002;9(3):201–209. doi:10.1002/oti.165
6. Peolsson RH, Birgitta Ob A. Intra- and inter-tester reliability and reference values for hand strength.J Rehabil Med.2001;33(1):36–41. doi:10.1080/165019701300006524
7. Schaubert KL, Bohannon RW. Reliability and validity of three strength measures obtained from community-dwelling elderly persons.
J Strength Cond Res.2005;19(3):717. doi:10.1519/R-15954.1 8. Everett PW, Sills FD. The relationship of grip strength to stature,
somatotype components, and anthropometric measurements of the hand. Res Quart Am Assoc Health Phys Educ Recreat. 1952;23 (2):161–166. doi:10.1080/10671188.1952.10761971
9. Frederiksen H, Hjelmborg J, Mortensen J, Mcgue M, Vaupel JW, Christensen K. Age trajectories of grip strength: cross-sectional and longitudinal data among 8,342 danes aged 46 to 102.Ann Epidemiol.
2006;16(7):554–562. doi:10.1016/j.annepidem.2005.10.006 10. Barbosa JF, Deshpande N, Gomez Monters J, et al. Handgrip strength
points associated with slowness for the identification of clinically relevant weakness may not be universal. Gerontologist. 2015;55 (Suppl_2):193. doi:10.1093/geront/gnv550.29
11. Bohannon RW. Hand-grip dynamometry predicts future outcomes in aging adults.J Geriatric Phys Ther.2008;31(1):3–10. doi:10.1519/ 00139143-200831010-00002
12. Kemp GJ, Birrell F, Clegg PD, et al. Developing a toolkit for the assessment and monitoring of musculoskeletal ageing.Age Ageing.
2018;47(suppl_4):1–19. doi:10.1093/ageing/afy143
13. Sargent-Cox KA, Butterworth P, Anstey KJ. Role of physical activity in the relationship between mastery and functional health.
Gerontologist.2015;55(1):120–131. doi:10.1093/geront/gnu042 14. Bohannon RW. Hand-held compared with isokinetic dynamometry
for measurement of static knee extension torque (Parallel reliability of dynamometers). Clin Phys Physiolog Measure. 1990;11 (3):217–222. doi:10.1088/0143-0815/11/3/004
15. Li RC, Jasiewicz JM, Middleton J, et al. The development, validity, and reliability of a manual muscle testing device with integrated limb position sensors. Arch Phys Med Rehabil. 2006;87(3):411–417. doi:10.1016/j.apmr.2005.11.011
16. Martin HJ, Yule V, Syddall HE, Dennison EM, Cooper C, Aihie Sayer A. Is hand-held dynamometry useful for the measurement of quadriceps strength in older people? A comparison with the gold standard biodex dynamometry. Gerontology. 2006;52(3):154–159. doi:10.1159/000091824
17. Casey KD, Lee LW, Collins JJ, Riley PO, Lipsitz LA. Reduced hip extension during walking: healthy elderly and fallers versus young adults. Arch Phys Med Rehabil. 2001;82(1):26–30. doi:10.1053/ apmr.2001.18584
18. Murphy AJ, Wilson GJ. Poor correlations between isometric tests and dynamic performance: relationship to muscle activation.Eur J Appl Physiol Occup Physiol. 1996;73(3–4):353–357. doi:10.1007/ BF02425498
19. Moreira NB, Rodacki ALF, Pereira G, Bento PCB. Does functional capacity, fall risk awareness and physical activity level predict falls in older adults in different age groups?Arch Gerontol Geriatr.2018;77. doi:10.1016/j.archger.2018.04.002
20. Sullivan KM, Dean A. OpenEpi: a web-based epidemiologic and statistical calculator for public health.Public Health Rep.2009;124 (June):471–474. doi:10.2307/25682255
21. Folstein MF, Folstein SE, McHugh PR. ‘Mini-mental state’. A practical method for grading the cognitive state of patients for the clinician. J Psychiatr Res. 1975;12(3):189–198. doi:10.1016/ 0022-3956(75)90026-6
22. Roberts HC, Denison HJ, Martin HJ, et al. A review of the measure-ment of grip strength in clinical and epidemiological studies: towards a standardised approach. Age Ageing.2011;40(4):423–429. doi:10. 1093/ageing/afr051
23. Wang CY, Chen LY. Grip strength in older adults: test-retest relia-bility and cutoff for subjective weakness of using the hands in heavy tasks.Arch Phys Med Rehabil.2010;91(11):1747–1751. doi:10.1016/ j.apmr.2010.07.225
24. Junior L, Marcos R, Netto WA, et al. Concurrent validity of handheld dynamometer measurements for scapular protraction strength.Braz J Phys Ther.2018;22(4):328–335. doi:10.1016/j.bjpt.2018.08.002 25. Podsiadlo D, Richardson S. The timed ‘up & go’: a test of basic
functional mobility for frail elderly persons. J Am Geriatr Soc.
1991;39(2):142–148. doi:10.1111/j.1532-5415.1991.tb01616.x 26. Hasegawa R, Islam MM, Lee SC, Koizumi D, Rogers ME,
Takeshima N. Threshold of lower body muscular strength necessary to perform ADL independently in community-dwelling older adults.Clin Rehabil.2008;22(10–11):902–910. doi:10.1177/0269215508094713 27. Webber SC, Porter MM. Reliability of ankle isometric, isotonic, and
isokinetic strength and power testing in older women. Phys Ther.
2010;90(8):1165–1175. doi:10.2522/ptj.20090394
28. Whitney SL, Wrisley DM, Marchetti GF, Gee MA, Redfern MS, Furman JM. Clinical measurement of sit-to-stand performance in people with balance disorders: validity of data for thefi ve-times-sit-to-stand test. Phys Ther. 2005;85(10):1034–1045. doi:10.1191/ 026921598673062266
29. Rogers ME, Rogers NL, Takeshima N, Islam MM. Methods to assess and improve the physical parameters associated with fall risk in older adults.Prev Med.2003;36(3):255–264. doi:10.1016/S0091-7435(02) 00028-2
30. Steffen TM, Hacker T, Mollinger L. Age- and gender-related test performance in community-dwelling elderly people: six-minute walk test, berg balance scale, timed up & go test, and gait speeds.Phys Ther.2002;82(2):128–137. doi:10.1093/ptj/82.2.128
31. Bohannon RW. Reference values for thefive-repetition sit-to-stand test: a descriptive meta-analysis of data from elders. Percept Mot Skills.2006;103(1):215–222. doi:10.2466/PMS.103.5.215-222 32. Witz K, Hinkle DE, Wiersma W, Jurs SG. Applied statistics for the
behavioral sciences. J Educ Stat. 1990;15(1):84. doi:10.2307/ 1164825
33. Benjamini Y, Hochberg Y. Controlling the false discovery rate -a pr-actic-al -and powerful -appro-ach to multiple testing.J R Stat Soc Ser B.1995;57(1):289–300.
34. Schlüssel MM, Antonio Dos Anjos L, Leite de Vasconcellos MT, Kac G. Reference values of handgrip dynamometry of healthy adults: a population-based study.Clin Nutri.2008;27(4):601–607. doi:10.1016/ j.clnu.2008.04.004
35. Bohannon RW, Magasi SR, Bubela DJ, Wang Y-C, Gershon RC. Grip and knee extension muscle strength reflect a common construct among adults.Muscle Nerve.2012;46(4):555–558. doi:10.1002/mus.23350 36. Kallman DA, Plato CC, Tobin JD. The role of muscle loss in the
age-related decline of grip strength: cross-sectional and longitudinal perspectives. J Gerontol. 1990;45(3):M82–88. doi:10.1093/geronj/ 45.3.M82
37. Tieland M, Verdijk LB, De Groot LCPGM, Van Loon LJC. Handgrip strength does not represent an appropriate measure to evaluate changes in muscle strength during an exercise intervention program in frail older people. Int J Sport Nutr Exerc Metab. 2015;25 (1):27–36. doi:10.1123/ijsnem.2013-0123
38. Norman K, Stobäus N, Smoliner C, et al. Determinants of hand grip strength, knee extension strength and functional status in cancer patients.
Clin Nutri.2010;29(5):586–591. doi:10.1016/j.clnu.2010.02.007 39. Felicio DC, Pereira DS, Assumpção AM, et al. Poor correlation
between handgrip strength and isokinetic performance of kneeflexor and extensor muscles in community-dwelling elderly women.Geriatr Gerontol Int.2014;14(1):185–189. doi:10.1111/ggi.12077
40. Alonso AC, Ribeiro SM, Silva Luna NM, et al. Association between handgrip strength, balance, and kneeflexion/extension strength in older adults. PLoS One. 2018;13(6):1–9. doi:10.1371/journal. pone.0198185
Clinical Interventions in Aging downloaded from https://www.dovepress.com/ by 118.70.13.36 on 27-Aug-2020
41. Straight CR, Dorfman LR, Cottell KE, Krol JM, Lofgren IE, Delmonico MJ. Effects of resistance training and dietary changes on physical function and body composition in overweight and obese older adults. J Phys Act Health. 2012;9(6):875–883. doi:10.1123/jpah.9.6.875
42. Taekema DG, Gussekloo J, Maier AB, Westendorp RGJ, de Craen AJM. Handgrip strength as a predictor of functional, psycho-logical and social health. A prospective population-based study among the oldest old. Age Ageing. 2010;39(3):331–337. doi:10. 1093/ageing/afq022
43. Dulac MC, Carvalho LP, Aubertin-Leheudre M. Functional capacity depends on lower limb muscle strength rather than on abdominal obesity in active postmenopausal women. Menopause. 2018;25 (2):176–181. doi:10.1097/GME.0000000000000970
44. Barbat-Artigas S, Rolland Y, Cesari M, Abellan van Kan G, Vellas B, Aubertin-Leheudre M. Clinical relevance of different muscle strength indexes and functional impairment in women aged 75 years and older. J Gerontol a Biol Sci Med Sci. 2013;68(7):811–819. doi:10.1093/gerona/gls254
45. Rolland Y, Czerwinski S, Abellan Van Kan G, et al. Sarcopenia: its assessment, etiology, pathogenesis, consequences and future perspectives. J Nutr Health Aging. 2008;12(7):433–450. doi:10. 1007/BF02982704
46. Rantanen T. Muscle strength, disability and mortality.Scand J Med Sci Sports.2003;13(1):3–8. doi:10.1034/j.1600-0838.2003.00298.x 47. McGrath RP, Kraemer WJ, Snih SA, Peterson MD. Handgrip strength
and health in aging adults. Sports Med. 2018;48(9):1993–2000. doi:10.1007/s40279-018-0952-y
48. Krogt MM, Delp SL, Schwartz MH. How robust is human gait to muscle weakness?Gait Posture.2012;36(1):113–119. doi:10.1016/j. gaitpost.2012.01.017
49. Requião LF, Nadeau S, Milot MH, Gravel D, Bourbonnais D, Gagnon D. Quantification of level of effort at the plantarflexors and hip extensors andflexor muscles in healthy subjects walking at different cadences. J Electromyography Kinesiol. 2005;15 (4):393–405. doi:10.1016/j.jelekin.2004.12.004
50. Kuo AD. Energetics of actively powered locomotion using the sim-plest walking model.J Biomech Eng.2001;124(1):113. doi:10.1115/ 1.1427703
51. Neptune RR, Sasaki K, Kautz SA. The effect of walking speed on muscle function and mechanical energetics. Gait Posture. 2008;28 (1):135–143. doi:10.1016/j.gaitpost.2007.11.004
52. Schmitz A, Silder A, Heiderscheit B, Mahoney J, Thelen DG. Differences in lower-extremity muscular activation during walking between healthy older and young adults. J Electromyography Kinesiol.2009;19(6):1085–1091. doi:10.1016/j.jelekin.2008.10.008
Clinical Interventions in Aging
Dove
press
Publish your work in this journal
Clinical Interventions in Aging is an international, peer-reviewed journal focusing on evidence-based reports on the value or lack thereof of treatments intended to prevent or delay the onset of maladaptive correlates of aging in human beings. This journal is indexed on PubMed Central, MedLine, CAS, Scopus and the Elsevier
Bibliographic databases. The manuscript management system is completely online and includes a very quick and fair peer-review system, which is all easy to use. Visit http://www.dovepress.com/ testimonials.php to read real quotes from published authors.
Submit your manuscript here:https://www.dovepress.com/clinical-interventions-in-aging-journal
Clinical Interventions in Aging downloaded from https://www.dovepress.com/ by 118.70.13.36 on 27-Aug-2020