Language And Gender Influence On The
Consumer’s Choice Of Branded
Meat Attributes
Theuns Pelser, North-West University, South Africa Anita Groenewald, North-West University, South AfricaHein Prinsloo, North-West University, South Africa
ABSTRACT
The feedlot industry is the main beef producer in South Africa and falls in the category of ‘Small Businesses.’ For these small business enterprises to be successful in an industry subjected to fierce competition, it is necessary to be innovative in a market where high quality beef serves as just another commodity. Previous research has shown that demographic factors can influence brand preferences. The objective of this study was to investigate the relationships between language and gender with brand attribute preference. Another objective was to identify opportunities that will differentiate and position branded meat products that will create consumer equity and build strong brand names. The case study approach was used and included quantitative and qualitative research. The population consisted of consumers buying meat products at the different retailers in Middelburg, Mpumalanga, under the brand names Kanhym Fresh Meat, Farm Inn Meat, and Frank’s Meat. A sample of 612 was conveniently selected for the study. A total of 588 questionnaires were completed. This study confirmed the interrelationship of the demographic variables gender and language that may affect consumers’ preferences. This means consumers will try different products with specific attributes. The results of this study identify opportunities of implementing strategies to maintain and enhance the competitiveness of branded meat retailers. It is finally recommended that brand retailers determine the demographic and psychographic profile of their target market for a specific product when producing or marketing products.
Keywords: Branding; Brand Retail Owner; Branded Meat; Small Businesses; Language; Gender; Consumer Choice
INTRODUCTION
randed meat of consistently high quality has earned a reputation worldwide as a means to increase beef consumption. The feedlot industry is the main beef producer in South Africa and falls in the category of ‘Small Businesses.’ For these small business enterprises to be successful in an industry subjected to fierce competition, it is necessary to be innovative in a market where high quality beef serves as just another commodity (Prinsloo, 2006). In researching the marketing approach to branded meat products, the assumption was made that the elements of the marketing mix; namely, price, product, and distribution, were already established. However, the majority of research on brand attributes has been done on large multinational brands and comparatively little research has been done on small business branding (Wong & Merrilees, 2005).
South Africa is a multi-lingual country with a population of about 40.5 million people. South Africa has more official languages at a national level than any other country in the world. Over and above English and Afrikaans, the eleven official languages include the indigenous languages - Southern Sotho, Northern Sotho, Tswana, Zulu, Xhosa, Swati, Ndebele, Tsonga, and Venda. In addition to this, the latest Global Gender Gap Report from the World Economic Forum (WEF, 2013) indicates that South Africa has the 17th narrowest gender gap in the
world. The annual gender gap index assesses 136 countries, representing more than 93% of the world's population, on how well resources and opportunities are divided among male and female populations (WEF, 2013).
The challenge meat producers face in building a strong meat brand name is to ensure that customers, first and foremost, have a positive experience when the product is purchased and that their marketing programs create the desired knowledge structures for the brand. The importance to establish a link between brand variables and consumers’ perception regarding the importance of these variables are thus critical in the success of branded meat products.
LITERATURE REVIEW
There are certain unwritten rules when it comes to making a brand successful and having customers become loyal followers. According to Ries & Ries (2003), there are four rules that must be discussed. First, one needs to get the brand to stand for something when the customer sees or thinks about it. It is all about maintaining a word in the customer’s mind. When people start using a brand name generically, it means that that brand owns the category name. To become generic, one needs to be the first to sell something and establish a category. Secondly, after successfully establishing the associations of this word, the brand owner decides whether to expand or contract the scope of its focus so as to make more money. Although it seems logical to expand the scope to increase sales, this is a common mistake. As Ries and Ries (2003) explains: “By far the most successful brands are those that kept a narrow focus and then expanded the category as opposed to those brands that tried to expand their names into other categories.” The third and fourth aspects to consider when building a successful brand are quality and credentials. Quality exists in the mind of the customer, but it is only a perception. “There is almost no correlation between success in the marketplace and success in comparative testing of brands,” claim Ries and Ries (2003). Credentials are needed to claim authenticity or validity and have people believe almost anything being said by the brand owner about the performance of the brand. Having a high price is also a factor when building a perception of high quality in a brand. To a customer, a high price means good quality, even if this is not true (Ries & Ries, 2003).
For branding strategies to be successful and brand value to be created, consumers must be convinced that there are meaningful differences among brands in the specific product or service category. Brand differences are often related to attributes or benefits of the product itself. Gillette, 3M, and others have been leaders in their product categories for decades due, in part, to continual innovation. Furthermore, brands like Gucci, Chanel, Louis Vuitton, and others have become leaders in their product categories by understanding consumer motivation and desires and creating relevant and appealing images around their products (Kotler & Keller, 2009). Successful brands are those which are the focus of a coherent blending of marketing resources and represent valuable marketing assets. A successful brand delivers sustainable competitive advantage and invariably results in superior profitability and market performance (De Chernatony et al., 2011).
Brand Definition
A more recent definition from De Chernatony, et al. (2011) states that, “A brand is a cluster of functional and emotional values that enables organisations to make a promise about a unique and welcomed experience.” Companies make a promise about their brands and brands succeed because companies meet the promise made to their customers. This definition goes further and adopts a strategic perspective. Unless the values and experiences received by the customer are unique and sustainable against competitive activity, the lifetime of the brand will be short (De Chernatony, et al., 2011).
Brand Attributes
Brand image reflects consumers’ perceptions of a brand’s characteristics and is evaluated by the associations they hold in their memory. The different types of brand associations can be grouped according to their level of abstraction, the amount of information held, whether they are product related or non-product related, and whether they refer to attributes considered essential by consumers (De Chernatony et al., 2011). Understanding brand meaning involves understanding the symbolism and associations that create brand image - the mental impression consumers construct for a product. The richness of the brand image determines the quality of the relationship and the strength of the associations and emotional connections that link a customer to a brand. Advertising researchers call this connection or association brand linkage (Moriarty, Mitchell, & Wells, 2009).
Brand elements are those characteristics that identify and differentiate the brand. Most strong brands employ multiple brand elements. Nike has the distinctive ‘swoosh’ logo, the empowering ‘Just Do It’ slogan, and the ‘Nike’ name based on the winged goddess of victory. Brand elements can play a number of brand-building roles (Wheeler, 2006). Kotler & Keller (2009) expanded on this statement by Wheeler (2006) and stated that there are three ‘brand building’ criteria and three ‘defensive’ criteria that deal with how to influence and preserve the equity in a brand element in the face of opportunities and limitations. Marketers should select brand elements to build as much brand equity as possible. The fundamental role of brand elements is to contribute to the formation and development of consumer confidence and trust. Brand elements by themselves do not create trust. If the story conveyed by the brand elements is coherent, consumers would more likely be receptive and then more willing to trust, but trust comes only through positive experience (Ind & Bjerke, 2007).
Language and Gender Influence on the Consumer’s Choice
Research concluded by Baltas and Argouslidis (2007) confirms that demographic factors can influence brand preferences. The relationships between language and brand attribute preference had been indicated in literature stating cultural, regional and ethnic group differences (Veloutsou et al., 2004). A recent study (Wyma et al., 2012) that investigated the relationship between selected demographic and psychographic variables and consumers’ brand preferences for selected food products in a South African context revealed that consumers’ choice of brands is probably associated with the product category. Although the study could not expose significant relationships with psychographics for different grocery products, certain demographic factors seemed noteworthy. Home language and education level seemed to be more significant indicators of brand preference, which suggests that consumers’ ability to interpret label information may be influential. This study further concluded that brand preference depends on specific demographics for each product and that psychographic factors were not significant in terms of product choice. Brand preference research therefore seems to be product and region specific and related to specific demographic variables (Wyma et al.,2012).
According to Ye (2008), the relationship between gender and brand has a substantial effect on consumer brand choices. Since gender identities may become blurred over time, consumers often use brands that fit their own gendered image while showing others a gendered self beyond just sex and traditional gender roles (Ye, 2008). In other words, how consumers perceive themselves and their brands under various usage conditions may have substantial influence on their brand attitudes and behaviour (Fischer & Arnold, 1990).
Adrian-Robertson, 2012) reports it may be important to have different positioning strategies for differing products and brands. Because feminine males and females tend to be more profitable targets for personal care products, managers should consider positioning personal care products as an expressive, emotional, and nurturing experience for the consumer. On the other hand, masculine consumers may emphasis brand images that are closely linked with masculine gender identity - a personal care product targeted at masculine males should likely focus on building a masculine brand image rather than on product features. According to Sahay et al. (2012), it is important for marketers to manage their communications and product development and use based on gender differences in brand relationships. Since building brand relationships is important and there are gender differences in the way consumers make decisions, marketers would need to evolve gender specific messaging and relationship building activities (Ye, 2008).
PROBLEM STATEMENT AND OBJECTIVE
This study explored the marketing efforts of meat producers in Middelburg, Mpumalanga, by drawing tangent planes between effective marketing and the knowledgeable consumer. According to the researchers, there is a difference between the meat retail owners brand building variables and consumer’s variables to establish brand equity. It is of importance to establish a link between brand variables and consumers’ perception regarding the importance of these variables. The research problem centres on the fact that meat retail brand owners have to implement strategies of branding and positioning to maintain and enhance their competitiveness. Furthermore, meat retail brand owners need to develop a competitive advantage based on a set of unique brand attributes. From this, the analogy can be drawn that meat retail brand owners need to establish how to market the meat brand attributes to achieve brand equity by differentiating the brand from competitors and developing a competitive advantage. Therefore, the objective of this study was to investigate the relationships between language and gender with brand attribute preference; and to identify opportunities that will differentiate and position branded meat products that will create consumer equity and build strong brand names.
RESEARCH METHODOLOGY
This research study sought to gain a better understanding of what role brand attributes play in the consumer’s decision-making process when buying branded meat. Most research on brand attributes has been done on large multinational brands and comparatively little research has been done on small business branding (Wong & Merrilees, 2005). The research method used in this research was the case study and included quantitative and qualitative research, which is descriptive (where the objective was restricted to describing current practices) and explanatory (where existing theory was used to understand and explain what was happening) in nature. For the purpose of this study, exploratory research was used to obtain information about the consumer preferences on attributes for branded meat.
The population relevant to this research consisted of consumers buying meat products at the different outlets in Middelburg, Mpumalanga, which include only those retail shops that sell branded meat products within the mentioned region; namely, Kanhym Fresh Meat, Farm Inn Meat, and Frank’s Meat. Within this population group, the effort was to obtain a sample size that represents the chosen population. A recommendation that exists to provide researchers with guidance regarding the amount of participants required in a sample size is called ‘the sample to variable ratio’ (N:p ratio) where N refers to the number of participants and p refers to the number of variables (Williams et al., 2010). The sample size for quantitative Mall survey research is normally determined by the number of variables in the questionnaire, the sample size of similar studies, and resource constraints. The common ‘rule of thumb’ is to suggest that the researcher has at least 10-15 participants per variable (Field & Miles, 2010). The target was a sample size of approximately 600 questionnaires and more were printed to have questionnaires available in the different languages and to compensate for uncompleted questionnaires. A sample of 612 was conveniently selected for the study. The sample size imitates and exceeds the recommendation by Hair et al. (2010) in that the number of respondents should be a ratio of 14 observations to each variable in order to perform factor analysis. When the 12 variables identified in three categories are multiplied by the suggested 14 observations, a sample of 504 is recommended.
classification is qualitative and the reasoning is inductive. This case study research focused on three meat retailers in Middelburg, Mpumalanga; namely, Kanhym Fresh Meat, Farm Inn Meat, and Frank’s Meat. The unit of analysis used in this study is represented by these three small business branded meat retailers and their consumers.
In the initial phase of the research study - semi-structured interviews - were done with the brand owners of the three identified retail outlets - Kanhym Fresh Meat, Farm Inn Meat, and Frank’s Meat. According to Cooper & Schindler (2006), the interview serves as a data collection methodology for research methods falling within the context of the phenomenological research paradigm. After establishing, inter alia, the brand variables as portrayed by the brand owners, this was then used as scaled questions in a quantitative questionnaire. Respondents could then rate the indicated variables which were used as feedback during the perceptual positioning stage of the empirical study. The questionnaire was then first pilot-tested and afterwards, modifications were made to this data collection instrument to increase its ease of use. The final questionnaire was issued at the different retail outlets where consumers buy the branded meat products. A total of 588 questionnaires were completed of which 24 were not taken into consideration due to incomplete or inconclusive questionnaires.
Data Reduction Techniques
Cluster analysis on the variables using Ward’s method on Euclidean distances yielded two main clusters in each Question (1 and 2) which could be interpreted. In Question 1, the first cluster - competence - consisted of the following variables: competent staff, service, value-added products, consistent quality, healthy wholesome products, quality products, variety of products, and a clean store. This cluster groups the variables that consumers find important when they consider the process of delivering the meat to the consumer. It is important that the staff know exactly how the meat cuts should be done, together with the added value, the wholesomeness, and product variety as they are all important factors in the final quality assessment of the product. The second cluster in Question 1 - valuable - consisted of the following variables: traceability, value for money, price, and convenience. This cluster groups the variables that consumers find important to consider the value of the product. Traceability and convenience are valued as attributes that can have a price tag associated with it. In Question 2, the first cluster - quality - consisted of the following variables: packaging, tasty meat products, quality products, hygienic products, healthy wholesome organic products, good service, price, and convenience. This cluster groups the variables that consumers find important when they consider the quality of a product. From the first impression that the packaging of the product contributes, the hygienic store environment, the in-store service, and, lastly, the good taste of the product, will give an overall perception of quality to the consumer. The second cluster in Question 2 - added product value - consisted of the following variables: traceable origin, marbled meat, unique customized product, and added value. This cluster groups the variables that consumers do not usually find at all retail outlets.
Reliability of Clusters
Cronbach alpha was used to test the reliability of variables in each of the clusters defined for Question 1 and Question 2 (see Table 1). The recommendations of Nunnally (1978) and Field (2007) are used in that an alpha coefficient 0.7 or above is generally accepted as a good indication of reliability.
Table 1: Reliability Analysis of Cluster Data
Construct Cronbach’s Alpha Mean Item Correlation
Question 1 - ‘Competence’ cluster .86 .42
Question 1 - ‘Valuable’ cluster .58 .28
Question 2 - ‘Quality’ cluster .79 .31
Question 2 - ‘Added product value’ cluster .75 .43
ANALYSIS OF RESULTS
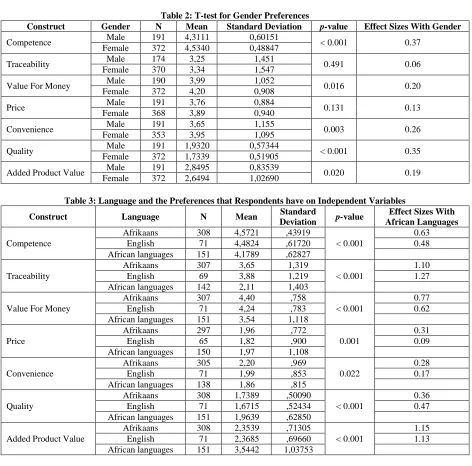
t-test was used to measure the differences in gender preferences. The effect sizes, as illustrated in Table 1, indicated a medium effect on the response of gender preferences. As indicated in Table 2, the highest mean values were measured with male respondents for the ‘Quality’ construct, where the mean and standard deviation was 1,932 ± 0,573. The females also responded very high for the same construct at 1,733 ± 0,519. Another high score was measured for the ‘Competence’ construct where the score of the female respondents was higher than that of the males and the mean and standard deviation were 4,534 ± 0,488 and 4,311 ± 0,601, respectively. ‘Traceability,’ which was one of the variables that was reported individually, and the male respondents had the lowest mean score measured at 3,25 ± 1,451.
Table 2: T-test for Gender Preferences
Construct Gender N Mean Standard Deviation p-value Effect Sizes With Gender
Competence Male 191 4,3111 0,60151 < 0.001 0.37
Female 372 4,5340 0,48847
Traceability Male 174 3,25 1,451 0.491 0.06
Female 370 3,34 1,547
Value For Money Male 190 3,99 1,052 0.016 0.20
Female 372 4,20 0,908
Price Male 191 3,76 0,884 0.131 0.13
Female 368 3,89 0,940
Convenience Male 191 3,65 1,155 0.003 0.26
Female 353 3,95 1,095
Quality Male 191 1,9320 0,57344 < 0.001 0.35
Female 372 1,7339 0,51905
Added Product Value Male 191 2,8495 0,83539 0.020 0.19
Female 372 2,6494 1,02690
Table 3: Language and the Preferences that Respondents have on Independent Variables
Construct Language N Mean Standard
Deviation p-value
Effect Sizes With African Languages
Competence
Afrikaans 308 4,5721 ,43919
< 0.001
0.63
English 71 4,4824 ,61720 0.48
African languages 151 4,1789 ,62827
Traceability
Afrikaans 307 3,65 1,319
< 0.001
1.10
English 69 3,88 1,219 1.27
African languages 142 2,11 1,403
Value For Money
Afrikaans 307 4,40 ,758
< 0.001
0.77
English 71 4,24 ,783 0.62
African languages 151 3,54 1,118
Price
Afrikaans 297 1,96 ,772
0.001
0.31
English 65 1,82 ,900 0.09
African languages 150 1,97 1,108
Convenience
Afrikaans 305 2,20 ,969
0.022
0.28
English 71 1,99 ,853 0.17
African languages 138 1,86 ,815
Quality
Afrikaans 308 1,7389 ,50090
< 0.001
0.36
English 71 1,6715 ,52434 0.47
African languages 151 1,9639 ,62850
Added Product Value
Afrikaans 308 2,3539 ,71305
< 0.001
1.15
English 71 2,3685 ,69660 1.13
African languages 151 3,5442 1,03753
‘Traceability,’ as a branded meat attribute, is thus more important to English- and Afrikaans-speaking respondents than Black African language-speaking respondents. The attribute ‘Value for money’ was rated the highest with Afrikaans-speaking respondents, while Black African language-speaking respondents rated the importance of ‘Value for money’ attribute as the lowest. This was also a practical significant difference (d = 0.77). Furthermore, the ‘Added product value’ cluster indicated a statistically significant difference interaction between the different language groups. The ‘Added product value’ attribute is most important for the Afrikaans- and English-speaking respondents. Afrikaans- and English-speaking respondents vary in their opinion of ‘Added product value’ with a large effect size of 1.15 and 1.13, respectively, in relation to the Black African language-speaking respondents. This means that we can conclude that ‘Added product value,’ as a branded meat attribute, is more important to English- and Afrikaans-speaking respondents than Black African language-speaking respondents. These large effect sizes clearly indicate that there are differences between the expectations and opinions of different language groups with regard to brand variables and attributes.
To determine whether a relationship exists between the variables used in this study, the Spearman rank order correlation method was used to measure this relationship. As codes were used to classify the information obtained in the survey, the responses were given ordinal numerical values. No Spearman rank order correlations of large magnitude (0.4 or larger) could be determined for age, income or level of education and the clusters individual items. For this reason, these demographic factors were examined further. Furthermore, the association of work status and marital status of respondents on variables will not be tested because most respondents were married and permanently employed.
Statistical significance tests have the tendency to yield small p-values as the size of the data set increases. The effect size, however, is independent of sample size and is a measure of practical significance (Ellis & Steyn, 2003), where Cohen’s d-values will be interpreted according to the following guidelines: d ≈ 0.2 small, indicates no practically significant difference, d ≈ 0.5 medium, indicates practically visible difference, d ≈ 0.8 large displays practically significant difference. Although only large effect sizes are of practical significance toward demographics in identifying meat brand attribute preferences, medium effect sizes may indicate tendencies which might be further explored in future studies. A three-way ANOVA was conducted to determine if there is a significant difference in brand preferences when language and gender are also considered. According to the data in Table 4, it is evident that there is a statistically significant effect (p = 0.039) on the interaction of gender, language, and brand. At this point in the research, it will now be determined where the differences lie.
Table 4: Gender, Language Groups, and Brand Preference for ‘Competence’
Source Type III Sum of
Squares df Mean Square F p-value Partial Eta Squared
Corrected Model 39.262a 18 2,181 8,786 ,000 ,258
Intercept 1250,433 1 1250,433 5036,525 ,000 ,917
Household income 4,308 1 4,308 17,352 ,000 ,037
Gender 4,829 1 4,829 19,452 ,000 ,041
Language 4,934 2 2,467 9,937 ,000 ,042
Which brand ,629 2 ,315 1,268 ,283 ,006
Gender * Language 2,706 2 1,353 5,449 ,005 ,023
Gender * Which brand ,438 2 ,219 ,883 ,414 ,004
Language * Which brand 2,268 4 ,567 2,284 ,060 ,020
Gender * Language * Which
brand 2,519 4 ,630 2,537 ,039 ,022
Error 112,716 454 ,248
Total 9464,983 473
Corrected Total 151,978 472
a R Squared = .258 (Adjusted R Squared = .229)
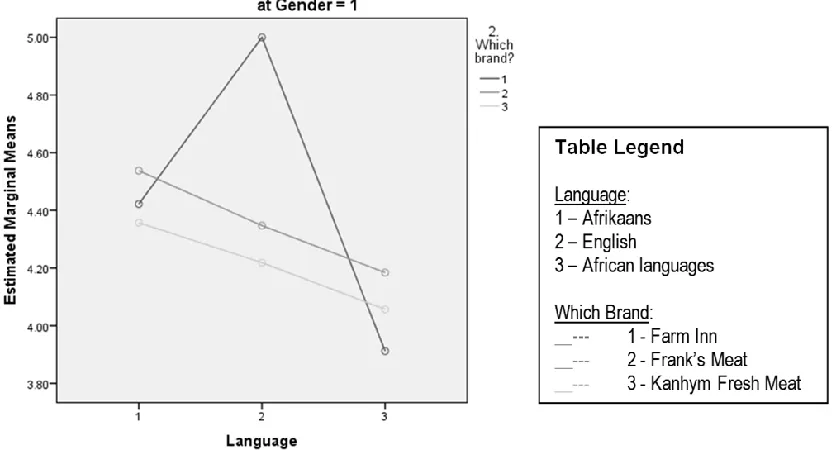
customers rated the ‘Competency’ variables higher for Farm Inn, e.g. Black African language-speaking women, Afrikaans-speaking men and women, as well as English-Afrikaans-speaking men and women, differ with large effect sizes from the Black African language-speaking men (d = 2.53, 2.06, 2.81, 3.09, and 2.49, respectively).
Table 5: Confidence Intervals for ‘Competency’
Gender Language Brand Mean Std. Error 95% Confidence Interval
Lower Bound Upper Bound
Male
Afrikaans
Farm Inn 4,360 ,125 4,113 4,607
Frank’s 4,412 ,100 4,215 4,608
Kanhym 4,282 ,083 4,119 4,444
English
Farm Inn 4,877 ,354 4,182 5,572
Frank’s 4,222 ,188 3,852 4,593
Kanhym 4,226 ,249 3,736 4,716
African
Farm Inn 3,336 ,191 2,961 3,712
Frank’s 4,241 ,104 4,037 4,445
Kanhym 3,899 ,106 3,691 4,108
Female
Afrikaans
Farm Inn 4,736 ,080 4,578 4,894
Frank’s 4,612 ,057 4,500 4,725
Kanhym 4,533 ,054 4,427 4,639
English
Farm Inn 4,578 ,138 4,307 4,850
Frank’s 4,438 ,130 4,183 4,692
Kanhym 4,447 ,106 4,238 4,656
African
Farm Inn 4,596 ,206 4,191 5,001
Frank’s 4,433 ,091 4,254 4,611
Kanhym 4,367 ,092 4,186 4,548
With regard to the Frank’s Meat brand, Afrikaans-speaking females rated their ‘Competency’ attributes the highest, while Black African language-speaking men rated the importance of ‘Competency’ attributes the lowest (see Figure 1). This was the only practical significant difference (d = 0.74). With regard to the Kanhym Fresh Meat brand, the Black African language-speaking men rated ‘Competency’ lowest. While Black African language-speaking women, Afrikaans-speaking men and women, as well as English-Afrikaans-speaking men and women, rated ‘Competency’ higher with large effect sizes (d = 0.94, 0.77, 1.27, 0.66, and 1.10, respectively).
In Table 6, a significant interaction (p = 0.011) was noted between language and which brand are preferred by the respondents, with regard to convenience.
Table 6: Gender, Language Groups, and Brand Preference for ‘Convenience’
Source Type III Sum of
Squares df
Mean
Square F Sig.
Partial Eta Squared
Corrected Model 37.490a 18 2,083 1,898 ,015 ,072
Intercept 855,866 1 855,866 779,796 ,000 ,638
Household income 2,191 1 2,191 1,996 ,158 ,004
Gender 5,808 1 5,808 5,292 ,022 ,012
Language 6,394 2 3,197 2,913 ,055 ,013
Which brand 3,897 2 1,949 1,775 ,171 ,008
Gender * Language 4,352 2 2,176 1,983 ,139 ,009
Gender * Which brand 3,099 2 1,549 1,412 ,245 ,006
Language * Which brand 14,426 4 3,606 3,286 ,011 ,029
Gender * Language * Which
brand 5,931 4 1,483 1,351 ,250 ,012
Error 485,118 442 1,098
Total 7543,000 461
Corrected Total 522,607 460
a R Squared = .072 (Adjusted R Squared = .034)
According to the results in Table 7, English-speaking people who prefer Farm Inn as their brand of choice had the lowest score with regard to convenience; they tend to feel neutral toward convenience as a brand attribute. The Afrikaans- and Black African language-speaking people considered Farm Inn as more convenient with a medium effect size (p = 0.51 and 0.41, respectively). For Frank’s Meat, there were no significant differences between language groups. Afrikaans- and English-speaking people consider Kanhym Fresh Meat as more convenient, but Black African language-speaking people differ with effect sizes of 0.54 and 0.52, respectively.
Table 7: Confidence Intervals for ‘Convenience’
Language Brand Mean Std. Error 95% Confidence Interval
Lower Bound Upper Bound
Afrikaans
Farm Inn 3,952 ,157 3,643 4,262
Frank’s 3,878 ,123 3,637 4,120
Kanhym 4,045 ,105 3,840 4,251
English
Farm Inn 2,991 ,399 2,206 3,775
Frank’s 3,642 ,240 3,170 4,113
Kanhym 4,021 ,285 3,461 4,580
African
Farm Inn 3,422 ,426 2,585 4,259
Frank’s 4,069 ,154 3,767 4,371
Kanhym 3,479 ,156 3,172 3,785
According to the results in Table 8, there is a significant interaction (p < 0.001) between gender and language when the attribute of ‘Traceability’ is considered.
Table 8: Gender, Language Groups, and Brand Preference for ‘Traceability’
Source Type III Sum of
Squares df
Mean
Square F Sig.
Partial Eta Squared
Corrected Model 307.227a 18 17,068 10,463 ,000 ,295
Intercept 695,587 1 695,587 426,410 ,000 ,487
Household income ,216 1 ,216 ,133 ,716 ,000
Gender ,310 1 ,310 ,190 ,663 ,000
Language 106,611 2 53,305 32,677 ,000 ,127
Which brand 3,079 2 1,540 ,944 ,390 ,004
Gender * Language 40,576 2 20,288 12,437 ,000 ,052
Gender * Which brand ,862 2 ,431 ,264 ,768 ,001
Table 8 cont.
Gender * Language * Which brand 1,800 4 ,450 ,276 ,894 ,002
Error 734,069 450 1,631
Total 6013,000 469
Corrected Total 1041,296 468
a R Squared = .295 (Adjusted R Squared = .267)
According to Table 9, the effect size of gender and language group on ‘Traceability’ indicates that in these gender and language groups, ‘Traceability’ is most important for the English-speaking women. It is evident that Afrikaans-speaking men and women do not vary much in their opinion of traceability of branded meat (d = 0.24), whereas English-speaking men regard it as less of an attribute than English-speaking women, with an effect size of 0.85, and Black African language-speaking men as more of an attribute than Black African-language-speaking women who vary with a large effect size of 0.90.
Table 9: Confidence Intervals for ‘Traceability’
Gender Language Mean Std. Error 95% Confidence Interval
Lower Bound Upper Bound
Male
Afrikaans 3,417 ,159 3,105 3,728
English 3,09 ,403 2,299 3,881
African 2,57 ,216 2,146 2,993
Female
Afrikaans 3,721 ,098 3,529 3,913
English 4,182 ,186 3,816 4,548
African 1,417 ,218 ,988 1,846
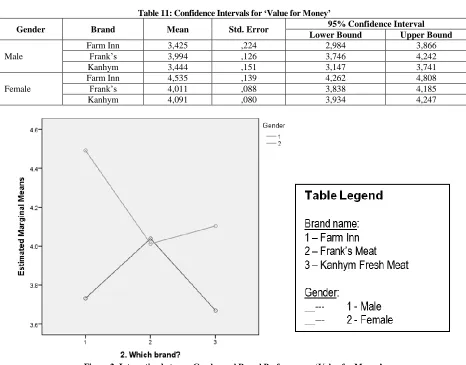
Table 10 indicates a significant interaction (p = 0.001) between gender and which brand are preferred by the respondents with regard to their perception of ‘Value for money.’
Table 10: Gender, Language Groups, and Brand Preference for ‘Value for Money’
Source Type III Sum of
Squares Df
Mean
Square F Sig.
Partial Eta Squared
Corrected Model 146.769a 18 8,154 12,697 ,000 ,335
Intercept 1123,267 1 1123,267 1749,080 ,000 ,794
Household Income ,093 1 ,093 ,145 ,703 ,000
Gender 16,435 1 16,435 25,591 ,000 ,053
Language 41,111 2 20,556 32,008 ,000 ,124
Which Brand 2,910 2 1,455 2,266 ,105 ,010
Gender * Language 2,070 2 1,035 1,612 ,201 ,007
Gender * Which Brand 9,910 2 4,955 7,716 ,001 ,033
Language * Which Brand 3,074 4 ,769 1,197 ,311 ,010
Gender * Language * Which
Brand 3,153 4 ,788 1,227 ,298 ,011
Error 291,561 454 ,642
Total 8387,000 473
Corrected Total 438,330 472
a R Squared = .335 (Adjusted R Squared = .308)
Table 11: Confidence Intervals for ‘Value for Money’
Gender Brand Mean Std. Error 95% Confidence Interval
Lower Bound Upper Bound
Male
Farm Inn 3,425 ,224 2,984 3,866
Frank’s 3,994 ,126 3,746 4,242
Kanhym 3,444 ,151 3,147 3,741
Female
Farm Inn 4,535 ,139 4,262 4,808
Frank’s 4,011 ,088 3,838 4,185
Kanhym 4,091 ,080 3,934 4,247
Figure 2: Interaction between Gender and Brand Preference on ‘Value for Money’
Table 12 indicates a significant interaction (p < 0.001) between gender and language when the attribute of ‘Price’ is considered.
Table 12: Gender, Language Groups, and Brand Preference for ‘Price’
Source Type III Sum of
Squares df
Mean
Square F Sig.
Partial Eta Squared
Corrected Model 52.643a 18 2,925 4,146 ,000 ,142
Intercept 939,386 1 939,386 1331,549 ,000 ,747
Household income ,095 1 ,095 ,135 ,714 ,000
Gender 10,998 1 10,998 15,590 ,000 ,033
Language 14,351 2 7,176 10,171 ,000 ,043
Which brand ,972 2 ,486 ,689 ,503 ,003
Gender * Language 4,401 2 2,201 3,119 ,045 ,014
Gender * Which brand 4,891 2 2,445 3,466 ,032 ,015
Language * Which brand 1,549 4 ,387 ,549 ,700 ,005
Gender * Language * Which
brand 5,329 4 1,332 1,889 ,111 ,017
Error 317,467 450 ,705
Total 7179,000 469
Corrected Total 370,111 468
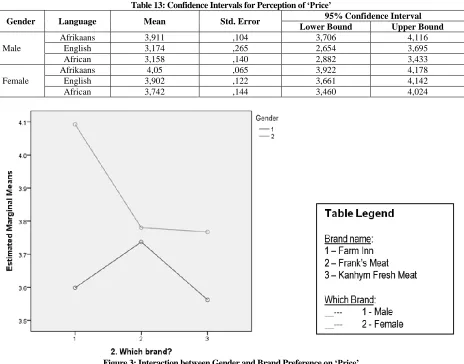
In Table 13, men and women and the different language groups are compared with each other and it can be seen that, according to the effect size, there is a large difference between men and women in English-speaking and Black African language-speaking respondents on the issue of ‘Price,’ d = 0.87 and 0.7, respectively, with women rating ‘Price’ higher than men. From the data and Figure 3, it appears that ‘Price’ is a more important factor for women than for men to consider when buying branded meat, and for Afrikaans-speaking women, it was the most important as they had the highest mean score (4.05). The Afrikaans-speaking male and females did not differ significantly with regards to ‘Price.’
Table 13: Confidence Intervals for Perception of ‘Price’
Gender Language Mean Std. Error 95% Confidence Interval
Lower Bound Upper Bound
Male
Afrikaans 3,911 ,104 3,706 4,116
English 3,174 ,265 2,654 3,695
African 3,158 ,140 2,882 3,433
Female
Afrikaans 4,05 ,065 3,922 4,178
English 3,902 ,122 3,661 4,142
African 3,742 ,144 3,460 4,024
Figure 3: Interaction between Gender and Brand Preference on ‘Price’
Table 14: Confidence Intervals for Perception of ‘Price’ of Branded Meat Products
Gender Brand Mean Std. Error 95% Confidence Interval
Lower Bound Upper Bound
Male
Farm Inn 3,215 ,235 2,753 3,677
Frank’s 3,651 ,132 3,391 3,911
Kanhym 3,377 ,158 3,066 3,688
Female
Farm Inn 4,167 ,146 3,880 4,453
Frank’s 3,763 ,093 3,581 3,945
Kanhym 3,764 ,084 3,599 3,928
Table 15 shows a significant interaction (p = 0.039) between consumer perception of quality and which brands are preferred by the respondents.
Table 15: Gender, Language Groups, and Brand Preference for ‘Quality’
Source Type III Sum of
Squares df
Mean
Square F Sig.
Partial Eta Squared
Corrected Model 12.481a 18 ,693 2,286 ,002 ,083
Intercept 241,378 1 241,378 795,694 ,000 ,637
Gender ,527 1 ,527 1,737 ,188 ,004
Language ,139 2 ,069 ,229 ,796 ,001
Which brand 1,989 2 ,994 3,278 ,039 ,014
Gender * Language 1,703 2 ,852 2,807 ,061 ,012
Gender * Which brand ,373 2 ,187 ,616 ,541 ,003
Language * Which brand 1,733 4 ,433 1,428 ,223 ,012
Gender * Language * Which
brand 1,314 4 ,329 1,083 ,364 ,009
Error 137,723 454 ,303
Total 1652,273 473
Corrected Total 150,204 472
a R Squared = .083 (Adjusted R Squared = .047)
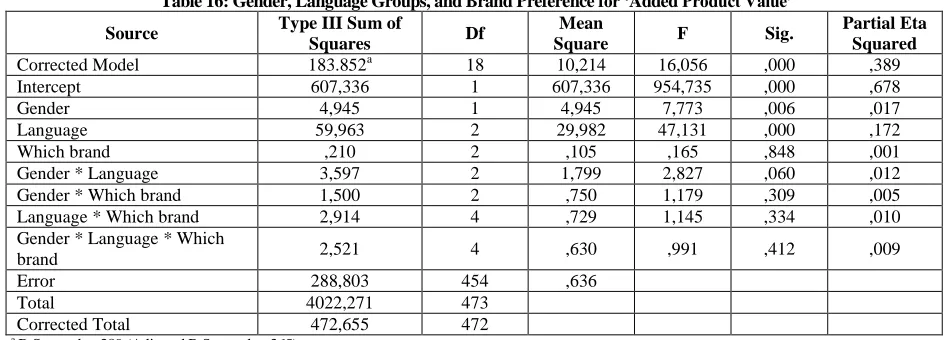
Finally, from Table 16, it can be concluded that “Added product value” was more important for Afrikaans and English-speaking customers than for Black African language-speaking respondents.
Table 16: Gender, Language Groups, and Brand Preference for ‘Added Product Value’
Source Type III Sum of
Squares Df
Mean
Square F Sig.
Partial Eta Squared
Corrected Model 183.852a 18 10,214 16,056 ,000 ,389
Intercept 607,336 1 607,336 954,735 ,000 ,678
Gender 4,945 1 4,945 7,773 ,006 ,017
Language 59,963 2 29,982 47,131 ,000 ,172
Which brand ,210 2 ,105 ,165 ,848 ,001
Gender * Language 3,597 2 1,799 2,827 ,060 ,012
Gender * Which brand 1,500 2 ,750 1,179 ,309 ,005
Language * Which brand 2,914 4 ,729 1,145 ,334 ,010
Gender * Language * Which
brand 2,521 4 ,630 ,991 ,412 ,009
Error 288,803 454 ,636
Total 4022,271 473
Corrected Total 472,655 472
RECOMMENDATIONS
The following recommendations, if implemented, can assist the meat retailers to develop a market brand positioning strategy and enhance their brands in becoming even stronger:
Recommendation 1: It is important that the brand retail owner focus the marketing program on one or two key attributes that affect gender or language directly. The brand retailer can further concentrate on attributes that make its brand different from the competitors. Focus on these key associations and reinforce it across the marketing program over time.
Recommendation 2: Due to the growing aversion to advertising, the increasing importance of channels, such as ‘word of mouth,’ Facebook and consumer blogs, is opening up an entirely new world of practical marketing possibilities for the successful marketers of the future. The meat retail business must be able to design creative brand building push campaigns toward acknowledging specific demographic variables. Recommendation 3: Maximise the contribution of each brand attribute preference used to build brand
equity. It is important to focus on the areas where respondents rated values indifferent; for example, in this study, attributes like ‘added product value’ and ‘traceablilty’ because it is in these areas that improvements can be affected to ensure a better understanding and building of a stronger meat brand.
CONCLUSION
Branding is about being different and for a branded product to be considered superior, it is necessary that brand meat retailers focus on the attributes that can make their product different and better than the competition. The results from the study returned that although the attributes that construct brand equity tested positively, the brand meat retailer should react on the indifferences found of the respondents and which importance they attached to the different brand attributes.
With regard to the brand Kanhym Fresh Meat, the Black African language-speaking men rated ‘Competency’ lowest and all the other gender and language groups rated ‘Competency’ higher. The English-speaking customers tend to feel neutral toward convenience as a brand attribute for the Farm Inn brand. The Afrikaans and Black African-language-speaking people considered Farm Inn as more convenient. For the brand Frank’s Meat, there were no significant differences between language groups. Afrikaans- and English-speaking people consider the Kanhym Fresh Meat brand as more convenient, but Black African language-speaking people differ significantly. The study indicated that the ‘Traceability’ attribute is most important for the English-speaking women, whereas English-speaking men regard it as less of an attribute than English-speaking women and Black African language-speaking men as more of an attribute than Black African-speaking women. Afrikaans-speaking men and women do not vary much in their opinion of traceability of branded meat. A practical significant difference occurred in opinions, with regard to ‘Value for money’ as an attribute, between men and women who prefer Farm Inn and between men and women who prefer Kanhym Fresh Meat. It may be concluded that 'Value for money' is a more important attribute for women than for men who buy from Farm Inn or Kanhym Fresh Meat. When ‘Price’ as an attribute was measured, men and women in English- and Black African language-speaking respondents differed on the issue of ‘Price’, with women rating ‘Price’ more important than men.
The objective of this study was to investigate the relationships between language and gender with brand attribute preference and to identify opportunities that will differentiate and position branded meat products that will create consumer equity and build strong brand names. This study confirmed the interrelationship of demographic variables like gender and language, which may affect consumers’ preferences. This means that consumers can try different products with specific attributes. For marketing, in general, it is important to know how the consumer views a brand according to its brand attributes. It is recommended that brand retailers determine the demographic and psychographic profile of their target market for a specific product when producing or marketing products.
AUTHOR INFORMATION
(RBS) and Strategy Manager at Sasol, a petro-chemical multinational company. He holds a PhD in Strategic Management from the Potchefstroom University. His academic interest focuses on strategic management, within an international business and small business development context. E-mail: [email protected] (Corresponding author)
Mrs. Anita Groenewald obtained her Bachelor’s degree from North West University, Potchefstroom in 1988 and completed a Master’s degree at North West University, Mafikeng in 2013. She also successfully completed a Certificate in Public Relations Practice at The Public Relations Institute of Southern Africa in 1992. She has more than 15 years’ experience in the field of Integrated Marketing Communications. She received the SANDF National Award Silver for Excellence in Communication in 1997. More recently she worked as a Consultant on the development of two new meat brand names. Her interest is in Small Business Communication strategies.
Professor Hein Prinsloo is the Marketing Professor at the Graduate School of Business and Government Leadership, North-West University, South Africa. His research focuses on both Sport Marketing and Adventure Tourism. In Sport Marketing he concentrates on individual (professional) sportsmen and -women regarding their sponsorship difficulties and negotiation process problems. His interest in adventure tourism involves adventure motorcycling, using a qualitative approach in determining expectations, and realizations of adventure trips.
REFERENCES
1. Baltas, G., & Argouslidis, P. C. (2007). Consumer characteristics and demand for store brands. International Journal of Retail and Distribution Management, 35(5), 328-341.
2. Batey, M. (2008). Brand meaning. New York: Routledge.
3. Belch, G. E., & Belch, M. A. (2007). Advertising and promotion: An integrated marketing communications perspective (7th ed.). New York: McGraw-Hill/Irwin.
4. Clow, K. E., & Baack, D. (2010). Integrated advertising, promotion, and marketing communications (4th ed.). New Jersey: Pearson Prentice Hall.
5. Cooper, D. R., & Schindler, P. S. (2006). Business research methods.Boston: McGraw-Hill.
6. De Chernatony, L., McDonald, M., & Wallace, E. (2011). Creating powerful brands. (4th ed.). Oxford: Butterworth-Heinemann.
7. Ellis, S. M., & Steyn, H. S. (2003). Practical significance (effect sizes) versus or in combination with statistical significance (p-values), Management Dynamics, 12(4), 51-53.
8. Field, A. (2007). Discovering statistics using SPSS (2nd ed.). London: Sage. 9. Field, A., & Miles, J. (2010). Discovering statistics using SAS. London: Sage.
10. Fischer, E., & Arnold, S. J. (1990). More than a labor of love: gender roles and christmas gift shopping. Journal of Consumer Research,17(1), 333-345.
11. Hair, J. F. Jnr, Black, W. C, Babin, B. J., & Anderson, R. E. (2010). Multivariate data analysis: A global perspective (7th ed.). Upper Saddle River: Pearson Prentice Hall.
12. Ind, N., & Bjerke, R. (2007). Branding governance: A participatory approach to the brand building process. West Sussex: Wiley.
13. Kotler, P., & Keller, K. L. (2009). Marketing management (13th ed.). New Jersey: Pearson Prentice Hall. 14. Moriarty, S. E., Mitchell, N., & Wells, W. (2009). Advertising principles and practice (8th ed.). Upper
Saddle River: Pearson Education.
15. Nunnally, J. C. (1978). Psychometric theory (2nd ed.). New York: McGraw-Hill. 16. Prinsloo, T. L. (2006). Kanhym lewer voortreflike vleis. Middelburg Observer, 3. 5 Oct. 17. Ries, A., & Ries, L. (2003). The 22 immutable laws of branding. London: Profile Books.
18. Sahay, A., Sharma, N., & Mehta, K. (2012). Role of affect and cognition in consumer brand relationship: exploring gender differences. Journal of Indian Business Research,4(1), 36-60.
19. Veloutsou, C., Gioulistanis, E., & Moutinho, L. (2004). Own labels choice criteria and perceived
characteristics in Greece and Scotland: Factors influencing willingness to buy. Journal of Product & Brand Management, 13(4), 228-241.
21. Ye, L., & Adrian-Robertson T. M. (2012). Gender identity: Does it matter for consumers’ perceptions? Journal of Business Diversity, 12(3), 81-92.
22. Wheeler, A. (2006). Designing brand identity: A complete guide to creating, building, and maintaining strong brands. Haboken: Wiley.
23. Williams, B., Onsman, A., & Brown, T. (2010). Exploratory factor analysis: A five-step guide for novices. Journal of Emergency Primary Health Care, 8(3), 1-10.
24. Wong, H. Y., & Merrilees, B. (2005). A brand orientation typology for SMEs: A case research approach. Journal of Product & Brand Management, 14(3), 155-162.
25. World Economic Forum. (2013). The global gender gap report. Geneva: WEF.