Nat. Hazards Earth Syst. Sci., 13, 1085–1104, 2013 www.nat-hazards-earth-syst-sci.net/13/1085/2013/ doi:10.5194/nhess-13-1085-2013
© Author(s) 2013. CC Attribution 3.0 License.
EGU Journal Logos (RGB)
Advances in
Geosciences
Open Access
Natural Hazards
and Earth System
Sciences
Open AccessAnnales
Geophysicae
Open AccessNonlinear Processes
in Geophysics
Open AccessAtmospheric
Chemistry
and Physics
Open AccessAtmospheric
Chemistry
and Physics
Open Access DiscussionsAtmospheric
Measurement
Techniques
Open AccessAtmospheric
Measurement
Techniques
Open Access DiscussionsBiogeosciences
Open Access Open Access
Biogeosciences
DiscussionsClimate
of the Past
Open Access Open Access
Climate
of the Past
Discussions
Earth System
Dynamics
Open Access Open Access
Earth System
Dynamics
DiscussionsGeoscientific
Instrumentation
Methods and
Data Systems
Open Access
Geoscientific
Instrumentation
Methods and
Data Systems
Open Access DiscussionsGeoscientific
Model Development
Open Access Open Access
Geoscientific
Model Development
DiscussionsHydrology and
Earth System
Sciences
Open AccessHydrology and
Earth System
Sciences
Open Access DiscussionsOcean Science
Open Access Open Access
Ocean Science
Discussions
Solid Earth
Open Access Open Access
Solid Earth
DiscussionsOpen Access Open Access
The Cryosphere
Natural Hazards
and Earth System
Sciences
Open Access
Discussions
Using a cloud electrification model to study relationships between
lightning activity and cloud microphysical structure
M. Formenton1,*, G. Panegrossi1, D. Casella1, S. Dietrich1, A. Mugnai1, P. San`o1, F. Di Paola2, H.-D. Betz3, C. Price4, and Y. Yair5
1Institute of Atmospheric Sciences and Climate (ISAC), Italian National Research Council (CNR), Roma, Italy 2Institute of Methodologies for Environmental Analysis (IMAA), Italian National Research Council (CNR),
Tito Scalo (PZ), Italy
3Physics Department, University of Munich, Garching, and Nowacast GmbH, Munich, Germany
4Department of Geophysical, Atmospheric and Planetary Science, Tel-Aviv University, Ramat Aviv, Israel 5Department of Life and Natural Sciences, Open University, Ra’anana, Israel
*now at: Hawaii Institute of Geophysics and Planetology, University of Hawaii at Manoa, Honolulu, Hawaii, USA
Correspondence to: G. Panegrossi ([email protected])
Received: 2 August 2012 – Published in Nat. Hazards Earth Syst. Sci. Discuss.: – Revised: 1 March 2013 – Accepted: 4 March 2013 – Published: 24 April 2013
Abstract. In this study a one-dimensional numerical cloud
electrification model, called the Explicit Microphysics Thun-derstorm Model (EMTM), is used to find quantitative rela-tionships between the simulated electrical activity and micro-physical properties in convective clouds. The model, based on an explicit microphysics scheme coupled to an ice–ice noninductive electrification scheme, allows us to interpret the connection of cloud microphysical structure with charge density distribution within the cloud, and to study the full evolution of the lightning activity (intracloud and cloud-to-ground) in relation to different environmental conditions. Thus, we apply the model to a series of different case stud-ies over continental Europe and the Mediterranean region. We first compare, for selected case studies, the simulated lightning activity with the data provided by the ground-based Lightning Detection Network (LINET) in order to verify the reliability of the model and its limitations, and to assess its ability to reproduce electrical activity consistent with the ob-servations. Then, using all simulations, we find a correla-tion between some key microphysical properties and cloud electrification, and derive quantitative relationships relating simulated flash rates to minimum thresholds of graupel mass content and updrafts. Finally, we provide outlooks on the use of such relationships and comments on the future develop-ment of this study.
1 Introduction
In recent years the interest in lightning has been increasing mainly because of the need to monitor the conditions leading to severe weather (Williams et al., 1999; Schultz et al., 2011) and sometimes to flash floods (Price et al., 2011). Since light-ning data give a direct and precise indication of convective activity in clouds, their integration with remote sensing cloud observing systems can be very useful both for diagnostic and prognostic purposes.
There are numerous studies on the relationships between precipitation and lightning, which are based either on the use of ground lightning detection networks around the globe, or on the measurements taken from space-borne instru-ments such as the Lightning Imaging Sensor (LIS) onboard the Tropical Rainfall Measuring Mission (TRMM) satellite (http://trmm.gsfc.nasa.gov/). For example, the introduction section in the paper by Gungle and Krider (2006) gives a full review of the current understanding of the relation-ships between cloud-to-ground (CG) lightning and precipi-tation, which are strongly coupled in convective storms. No-tably, these relationships are highly variable depending on the geographical thunderstorm characteristics – e.g., Tapia et al. (1998), Soula et al. (1998), Lang and Rutledge (2002), Zhou et al. (2002), Latham et al. (2004), Cecil et al. (2005), Goodman et al. (2007).
Specifically, Tapia et al. (1998) proposed a model for re-gression of convective rainfall based on a study of several storms that occurred over Florida. They used CG lightning data from the US National Lightning Detection Network (NLDN) compared with radar rainfall estimations to infer the regression model and calculated the key parameter rain-fall yield/flash (i.e., the ratio between the total water rain-fallen during the storm divided by the total amount of detected flashes), finding values from 20 to 360 (106kg flash−1). Later, Soula and Chauzy (2001) performed a similar study over Paris using a VHF lightning network, capable of dis-criminating between intra-cloud (IC) and CG lightning, and compared the measurements with radar data. They found a rainfall yield/flash (m3flash−1) value ranging from 1 to 100 (106kg flash−1). Kempf and Krider (2003) studied the rela-tionship between rain and lightning for the case of the 1993 flood in the Mississippi Basin. They used the CG lightning data from the US NLDN and surface rainfall as reported by the National Weather Service cooperative observers. By cor-recting their data for an imperfect detection efficiency, they found a daily precipitation volume per reported CG flash (CGF) of about 4.6 (105m3CGF−1) over the greater Upper Mississippi River basin, with a seasonal mean rain volume of about 1.3 (105m3CGF−1). Pineda et al. (2007) made simi-lar measurements during nine convective events over Catalo-nia in the summer 2004. They used total lightning data col-lected by the Meteorological Service of Catalonia lightning detection network based on SAFIR (Surveillance et Alerte Foudre par Interf´erometrie Radio´electrique) sensors, which is also able to discriminate between CG and IC lightning, and found a rainfall to total lightning ratio similar to Soula and Chauzy (2001), roughly 10–90 (103m3flash−1). Price and
Federmesser (2006) used TRMM data to study the relation-ships between rainfall and total lightning over the eastern and central Mediterranean Sea. They found a very high monthly and seasonal correlation (0.81–0.98) for a rainfall yield/flash between 250 and 970 (106kg flash−1).
In essence, all these studies show a large variability of the water volume/flash ratio. Petersen et al. (2005) pointed out that while the relationship between rainfall and light-ning is highly regime dependent, a more solid relationship can be found between lightning and ice microphysics. In their study they used the cloud ice microphysics informa-tion available from the Precipitainforma-tion Radar (PR) onboard TRMM (2A25 PR product) to find global relationships be-tween ice water content and lightning activity as observed by the LIS instrument onboard TRMM. They found that on a global scale the relationship between columnar precipita-tion ice mass and lightning flash density is invariant between land, ocean and coastal regimes (in contrast to rainfall), sug-gesting that the physical assumptions of precipitation-based charging and mixed phase precipitation development are ro-bust. Adamo et al. (2009) analyzed the so-called precipita-tion feature database, which had been developed at the Uni-versity of Utah using concurrent observations of the LIS,
this would certainly favor the use of lightning measurements to infer the connected cloud properties and even to estimate precipitation indirectly, once the regime of the convection and the characteristics of the cloud are identified.
Cloud electrification models allow the study of the re-lationships between lightning and cloud properties, during the whole evolution of convective clouds and for different climate conditions. This is a relatively young topic of re-search and it is still evolving from 1-D models incorporat-ing explicit microphysics and cloud electrification processes (Norville et al., 1991; Solomon et al., 2005), through more recent 3-D mesoscale models with lightning activity param-eterization (e.g., Yair et al., 2010; Lynn et al., 2012), to ex-plicit 3-D electrification models (e.g., Helsdon et al., 1992; MacGormann et al., 2001; Mansell et al., 2002; Barthe et al., 2012). As compared to 1-D models, 3-D models can pro-vide better and more realistic renditions of thunderstorms. However, their high computation time requirements are often controlled at the expense of the microphysics representation – i.e., bulk microphysics schemes are generally used instead of explicit microphysics schemes. In any case, for all mod-els the challenge is to find a compromise between the level of complexity of all simulation components (i.e., dynamics, microphysics, electrification) and a realistic representation of lightning activity.
In this study we use the 1-D Explicit Microphysics Thun-derstorm Model (EMTM), developed by Solomon (1997) (see also Solomon et al., 2005), to investigate and interpret cloud electrification processes through the use of explicit representation of the size dependent microphysical processes and the inclusion of lightning parameterization as described in Solomon and Baker (1996). Following the approach of Solomon et al. (2003) and Adamo et al. (2003), we search for quantitative relationships between the microphysical proper-ties and electrical activity of the simulated convective clouds. The long-term goal of this study is to use these relationships for other applications (e.g., precipitation retrieval from re-mote sensing observations) in which lightning observations are used to infer cloud microphysical properties.
Thanks to the high computational efficiency of this model, we were able to perform several simulations of different case studies, as well as sensitivity tests on the impact of vary-ing cloud and meteorological parameters. In addition, we use lightning observations from the LINET lightning detec-tion network (Betz et al., 2004, 2007, 2008, 2009), with over 120 sensors over Europe (covering also Italy), to explore the ability of the EMTM model to reproduce lightning activity under different environmental conditions, so as to assess if it is a reliable tool for microphysics–electrification cloud clas-sification. It is worth noting that the comparison with real data is made not in order to find a perfect correspondence between the real and the simulated cells but to find analogies in reproducing the main characteristics of the electrical activ-ity, such as the sensitivity of the flash rate to environmental
conditions, and the temporal evolution of the IC and CG ac-tivity.
The paper is organized as follows. In Sect. 2 the EMTM and the model initialization procedure are described; Sect. 3 is dedicated to the description of the case studies and of the LINET network; in Sect. 4 the comparison strategy with the LINET network data is discussed, and the results of the mod-eled lightning activity verification are presented; Sect. 5 is dedicated to a detailed discussion of the results of the model simulations for two selected case studies and to the deriva-tion of quantitative reladeriva-tionships between the microphysical and dynamical properties of the modeled clouds and their lightning activity; the conclusions follow in Sect. 6.
2 The EMTM model
This study is based on using the 1-D EMTM numerical cloud model involving explicit microphysics and cloud electrifica-tion processes, which was developed by Solomon (1997) – see also Solomon et al. (2005). The EMTM model is compu-tationally very efficient because of its dynamical framework, and at the same time, since charge transfer mechanisms are sensitive to particle size (Saunders et al., 1991), the explicit microphysics and electrical scheme generates a good repre-sentation of the electrical activity in clouds. The geometric simplicity allows for the inclusion of a lightning parame-terization (Solomon and Baker, 1996), whereas this task be-comes difficult at higher dimensions (3-D models). We here describe the main features of the model while, for further de-tails, the reader is referred to the original references.
39 Figure 1
1
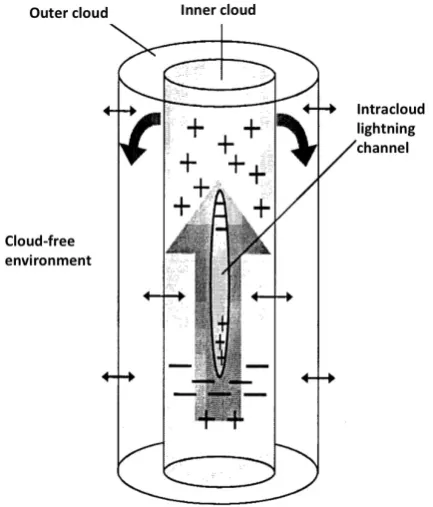
Fig. 1. Schematic diagram of the model geometry with two con-necting cloudy cylinders.
Several conceptual models of cloud charge separation are present in literature (e.g., Wilson, 1929; Chalmers, 1967; Jennings, 1975). In this study an electrification scheme based on the noninductive ice–ice process is used (Reynolds et al., 1957; Saunders et al., 1991; Jayaratne et al., 1983; Mason and Dash, 2000; Nelson and Baker, 2003), in which the sen-sitivity of the charge transfer mechanism to particle size can be adequately represented (Saunders et al., 1991; Solomon et al., 2005; Mansell et al., 2010). Several parameterizations of the noninductive ice–ice process exist (e.g., Takahashi, 1978; Gardiner et al., 1985; Brooks et al., 1997; Saunders and Peck, 1998), and several studies have shown that storm electrifi-cation (i.e., cloud polarity and the lightning characteristics) is highly sensitive to this parameterization (e.g., Mansell et al., 2005; Kuhlman et al., 2006; Barthe and Pinty, 2007). Takahashi (1978) and Saunders et al. (1991) have shown that magnitude and sign of the charge transferred to each collid-ing particle are strong functions of liquid water content and temperature. These authors also showed that application of various noninductive charging schemes to several convec-tive storms results in a storm electrification variability that heavily depends on cloud dynamics and microphysics; and that, even under the same dynamical and microphysical con-ditions, the electrical polarity and the lightning activity are highly dependent on the noninductive parameterization that is used.
In the EMTM, based on observational evidence and model results by several authors (Gardiner et al., 1985; Dye et al.,
1989; Norville et al., 1991), it is assumed that the dominant charge transfer mechanism involves collisions between ice crystals and graupel particles or soft hail pellets – see also Takahashi (1978), Jayaratne et al. (1983), Baker et al. (1987), and Saunders et al. (1991). This mechanism requires the co-existence of ice, graupel, and supercooled liquid water in the so-called charging zone (CZ) – defined here according to Saunders (2008) as the vertical layer between 0◦C and −25◦C. When ice crystals and graupel particles collide, the charged graupel are either suspended within the CZ or sed-iment downward depending on their fall velocity as com-pared to the updraft velocity in the CZ, while the ice crystals, charged by the opposite sign with respect to graupel, are car-ried upward in the cloud. This process can separate enough charge to generate the electric fields that are observed within lightning producing clouds (Norville et al., 1991; Ziegler et al., 1991).
In essence, the instantaneous charge separation rate and sign depend on liquid water content, temperature, and num-ber and size of ice crystals and hail particles. In the EMTM the net amount of charge,1Q(D, d), added per unit time to a graupel particle with diameterD, via collisions with ice crystals having diameterdand number concentrationnice(d)
is
1Q (D, d)=nice(d)·Kcc(d, D)·(1−Esi)·∂Qg(d, D)+
nice(d)·Kcc(d, D)·Esi·Qice(d) . (1)
Here, Kcc(d, D) is the geometric collision kernel,
∂Qg(d, D) is the amount of charge transferred per
non-sticking collision,Qice(d)is the charge on each ice crystal,
andEsiis the ice–ice sticking efficiency (set equal to 0.25).
In Eq. (1), the first term on the right hand side is the amount of charge transferred per unit time to the graupel particle be-cause of rebounding collisions with ice crystals (i.e., non-inductive process), while the second term is the amount of charge transferred per unit time because of sticking collisions with ice crystals (i.e., it deals with charge transfer between hydrometeors associated to mass transfer).
As discussed by Solomon (1997), EMTM uses the fol-lowing expressions forKcc(d, D)and for∂Qg(d, D),
respec-tively, taken from Gillespie (1975) and from Keith and Saun-ders (1989):
Kcc(d, D)=π4·(D+d)2· |∂V|, (2)
∂Qg(d, D)=B·da· |∂V|b·q(d, D). (3)
Here,∂V is the difference in the fall velocities of the col-liding particles, whileB,a, andbdepend on crystal size and effective liquid water content, and forq(d, D)EMTM uses a functional form based on a parameterization of laboratory experiments supplied by Saunders et al. (1991).
sufficient amount of charge has been separated to raise the electric field at some point in the cloud to the value necessary for local breakdown, lightning is initiated – i.e., the initiation height is where the electric field exceeds the breakdown field. In this study the breakdown electric field is held constant with height and equal to 200 kV m−1. This value was cho-sen according to Solomon (1997). In other studies (Marshall et al., 1995a, b) the triggering electric field decreases with in-creasing altitude, with values approaching 200 kV m−1at the surface. Then, a routine for plasma propagation is activated at the initiation height. The plasma is modeled as a conduc-tive ellipsoid (representing the intracloud lightning channel in Fig. 1) at the same potential, propagating along the col-umn and collecting charge. While propagation and collec-tion of charge take place, the amount of energy is dispersed by irradiation from the ellipsoid’s surface, assumed to be a black body at 20 000 K temperature. The lightning occurs un-til there is enough energy supplied by the charge to sustain the heat radiative dispersion. For further details on the light-ning channel parameterization, please refer to Solomon and Baker (1996).
The specification of the channel length is based on the physical processes that are involved in lightning propagation. In the EMTM, it is assumed that the channel length grows as long as the charge at the head of the channel does not change sign or goes to zero. Specifically, if the channel propagates into a region where the charge induced at the tip goes to zero or switches sign, propagation in that direction is halted. If the lower tip of the channel does not reach the ground (IC lightning), the channel always bears zero net charge. Vice versa, if it reaches the ground, a CG lightning occurs and a net charge flows from the ground to the channel and is evenly distributed along the channel itself, bringing its potential to zero (the potential of the ground). Thus, downward propa-gation is no longer possible, though the top of the channel may continue upward. At the completion of the parameter-ized channel, the charge induced on the channel diffuses into the cloud, attaches to hydrometeors and modifies the in-cloud charge profile and electric field.
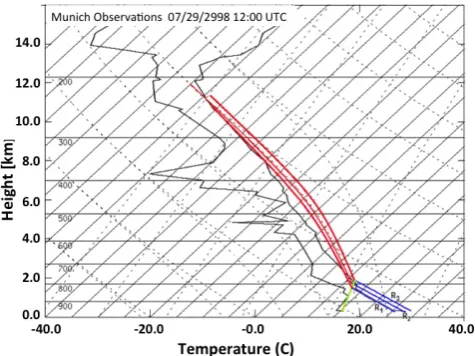
Each EMTM simulation must be initiated with a ver-tical atmospheric (temperature and water vapor) profile, which can be taken either from soundings or from numerical weather prediction analysis. This profile provides the basic state of the atmosphere and fills the inner and outer cylinders constituting the model domain. Then, to generate a cloud, a perturbation of the basic state has to be imposed, either by means of a temperature perturbation (thermal bubble) or by a vertical wind at cloud base, or both. The duration of the forcing can be chosen as needed. In the case of a thermal bubble, different thermal perturbation amplitudes (1T’s) at cloud base can be chosen according to the sounding (Skew-T diagram) for the selected case. An example of this procedure is shown in Fig. 2 for a summer continental profile. From the basic state (black curves) various scenarios of daytime heat-ing from the ground are represented by the three dry adiabatic
40 Figure 2
1
Fig. 2. Skew-T diagram showing how different initialization pro-files for the EMTM model can be generated by means of different temperature perturbations below cloud base. The black curves are taken from a continental summer sounding and represent the basic state of the atmosphere. The blue curves (R1, R2, and R3) are three different dry adiabatic thermal perturbations, the green line repre-sents the moisture of the thermal bubble and the three red curves represent the moist adiabatic profiles corresponding to the three dif-ferent thermal perturbations.
curves that are represented as the blue R1, R2, and R3 lines. These different initial thermal perturbations lead to different initial cloud condensation levels. The thermal bubble is lifted to the condensation level keeping its moisture constant and equal to the moisture at the surface (green line). The con-ditions at cloud base (i.e.,1T, saturation conditions, pres-sure), derived at the intersection of the blue and green lines, change depending on the initial thermal perturbation. They represent the difference of thermodynamic properties (and dynamic properties as well, when vertical wind is also per-turbed) between the convective cloud and the environment. Then, for each thermal perturbation, the cloud evolves fol-lowing the corresponding moist adiabatic (red curves) above the condensation level.
41 Figure 3
1
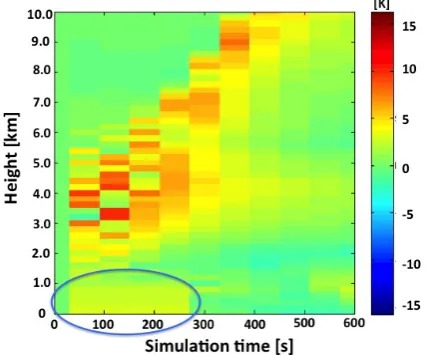
Fig. 3. Temperature perturbation from the basic state for the EMTM model initialization, as a function of model simulation time and alti-tude. The different colors represent the temperature deviation from the basic state due to the evolution of the cloud.
The characteristics of the cloud produced by the model critically depend on the selected sounding and on type and duration of the initial perturbation. In order to have reliable results it is crucial to choose an initial setup that is physi-cally compatible with the atmospheric environment as repre-sented by the sounding. The output of the model consists of the vertical profiles of various variables in the inner cylinder, as a function of simulation time, that specify both the micro-physical and electrical properties of the cloud (i.e., graupel, rain, electric field, lightning discharges) and the thermody-namical state of the atmosphere (i.e., vertical wind, temper-ature, water vapor mixing ratio). Notably, cases of model in-stability sometimes occur producing unrealistic results. The most common case happens when the initial perturbation is too energetic. In this case, the model produces excessively strong updrafts and, as a consequence, the residence time of graupel in the CZ becomes too short. Model instability may also occur when the cloud condensation level is high (around 800 hPa), as for example in the simulation of con-tinental summer storms characterized by a thick dry layer of absolute instability. Thus, it is necessary to analyze some key output variables (e.g., profiles of temperature and verti-cal wind) in order to establish if the results are compatible with the meteorological situation of the selected case.
3 Case studies
For an in-depth analysis of the EMTM model results, we have selected two case studies, which are characterized by very different synoptic situations and, therefore, by differ-ent environmdiffer-ental conditions as clearly represdiffer-ented by the soundings used to initialize the EMTM. The first case study
42
Figure 4
1 Fig. 4. Distribution of LINET sensors in Europe as of
Decem-ber 2009.
(Case 1) is a typical summer convective cell that occurred on 29 July 2008 over Munich, southern Germany, triggered by local conditions (strong diurnal warming favoring intense convective activity). During the morning there was an intru-sion of dry air in the mid troposphere increasing its condi-tional instability. In this case, a thick layer of absolute insta-bility characterized the lower atmosphere. The second case study (Case 2) is a disturbance that affected the Lazio region, in Italy, and Rome in particular, producing a very intense hailstorm on 2 July 2009. During the days prior to the event, a cold pool descended from central Europe to the Balkans producing a cyclonic circulation over eastern Europe. Con-sequently, an eastern flux developed over Italy carrying rela-tively cold air at mid levels. A cold trough at 850 hPa devel-oped over the Balkans on 29 June, generating, two days later, a strong cold advection over Italy. In addition, the summer solar radiation triggered strong and diffuse convection along the Apennines mountain range. As a result, thunderclouds were carried toward the southwest by upper level winds.
43 Figure 5
1
Fig. 5. IR 10.8 µm MSG image of a central Europe region at 13:27 UTC, 29 July 2008, with superimposed contours of light-ning activity as detected by the LINET network during the previous 15 min. The different colors show the accumulated stroke density over a grid at 2×2 km2horizontal resolution. The red circle identi-fies the location of the analyzed thunderstorm cell of Case 1.
important features of the LINET network is the ability to dis-tinguish IC strokes from the CGs following the evolution of a cell from its early stage and, in some cases, to measure the height of the ICs (Betz et al., 2004). LINET has higher ef-ficiency for small-amplitude signals and, thus, locates more IC-strokes than other networks, with a sensitivity threshold around 5 kA, depending on the location (Betz et al., 2009). The accuracy for discrimination of ICs and CGs depends on the general 2-D location accuracy in the area – optimal when the network baseline is less than some 200 km, but still guaranteed by the availability of a sensor within 100 km of a lightning (independent of the network baseline). This condi-tion was satisfied for both case studies, even if, as evidenced in Fig. 4, in the area of Rome the network baseline is much longer than near Munich. Therefore, the distinction ability between ICs and CGs in Rome is the same as in Munich. The detection efficiency, however, was different between Rome and Munich, because of the different sensitivity threshold in the two locations. In Rome, strokes with current greater than 7 kA could be detected, while in Munich the threshold for detection was about 1.5 kA. Therefore, for the Munich case, it was possible to detect many weak ICs (with current less than 7 kA) that in Rome would be undetected. Since small currents are associated mostly to ICs, the detection of CGs is almost the same for Rome and Munich.
LINET lightning data consist of a continuous streaming of records of strokes containing GPS time and geolocation, height and discharge current. Once a time frame of data sam-pling is selected, a geographical grid at 2×2 km2resolution is
44
Figure 6
1
Fig. 6. Same as Fig. 5, but for central Italy at 16:27 UTC, 2 July 2009. The red circle identifies the area selected for Case 2 and the red crosses identify the cities of Rome and Naples.
filled with the cumulated strokes obtaining a matrix of stroke occurrence. Figure 5 shows the storm of Case 1 (Munich) at 13:27 UTC, 29 July 2008, as viewed by the thermal in-frared (IR) 10.8 µm channel of the Meteosat Second Genera-tion (MSG) geostaGenera-tionary satellite, with superimposed light-ning measurements from the LINET network in the previous 15 min (sampled over a 2×2 km2grid). Here the LINET data reveal the presence of a well-developed single cell, identified by the red circle, over the Munich area with cumulated stroke counts (both CGs and ICs) of between 20 and 30. This iso-lated cell produced the first stroke at 12:20 UTC and evolved for about two hours producing the last lightning at 14:06. Figure 6 is similar to Fig. 5, but for the storm of Case 2 (Rome) at 16:27 UTC, 2 July 2009. The cell used for this case study, identified by the red circle, reveals a weak activ-ity at the time of the image, with maximum cumulated stroke counts approaching 20 (in the 15 min prior to the MSG image time).
45 Figure 7
1
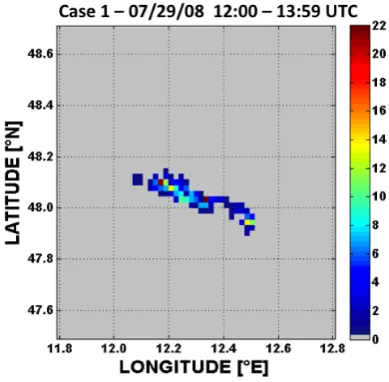
Fig. 7. Cumulated total strokes (IC + CG) registered by the LINET network over the Munich area (Case 1) between 12:00 and 13:59 UTC, 29 July 2008. The horizontal resolution is 2×2 km2. The different colors show the total events registered for each pixel.
46
Figure 8
1
Fig. 8. Same as Fig. 7, but for the Rome area (Case 2) between 15:00 and 16:59 UTC, 2 July 2009.
due to the particular intensity of the event and the good setup of the ground network, the maximum cumulated stroke count among all pixels was as high as 38 in spite of the reduced detection efficiency over the Rome area.
As described in Sect. 2, the EMTM model is initiated with a vertical atmospheric profile of temperature and water va-por that, for each of the present case studies, is taken from a radio sounding close to the corresponding area – red cir-cles in Figs. 5 and 6. Following the methodology illustrated by Fig. 2, atmospheric soundings have been used to cre-ate the initial conditions of the simulations for Case 1 and Case 2. In particular, Fig. 2 shows the sounding (tempera-ture and water vapor profiles) over Munich on 29 July 2008 at 12:00 UTC. The initial conditions for cloud initiation in the EMTM Case 1 simulation are given by the blue and
47 Figure 9
1
Fig. 9. Radio sounding in Rome on 2 July 2009, 12:00 UTC (black curves), and initial perturbation setup for Case 2. The blue line is the dry adiabatic thermal perturbation, the green line represents the moisture of the thermal bubble, and the red curve is the moist adia-batic profile.
red curves labeled as R2. The (lifting) condensation level resides at 800 hPa, which is the starting level for cloud initiation, corresponding to a water vapor mixing ratio of 11×10−3kg kg−1and a temperature of 14◦C at cloud base. CAPE (convective available potential energy) is 1813 J kg−1. Figure 9 shows the sounding over Rome on 2 July 2009 at 12:00 UTC, as well as the initial conditions for cloud initia-tion in the EMTM simulainitia-tion for Case 2. The condensainitia-tion level resides at 910 hPa, with a water vapor mixing ratio of 14×10−3kg kg−1 and a temperature of 17.5◦C. CAPE is 2580 J kg−1. In this case, the rising parcel is warmer than the
environment up to about the 950 hPa level and it acquires kinetic energy. Then, it enters in a stable layer where its temperature becomes lower than the environment. Neverthe-less, the parcel has a strong buoyancy contribution due to the moisture carried up in drier environment, and therefore it rises up over the stable layer in spite of a negative (−2 K)1T at cloud base. In addition, a vertical wind forcing of 1 m s−1 was imposed to simulate the orographic lifting – a value that was estimated from the horizontal wind at the time of the sounding and an average slope of 25 % for the Apennines mountain range. The low cloud base level (910 hPa), due to the moisture carried at lower levels by the sea breeze, causes the formation of a very thick cloud, which is a good environ-ment for charge electrification.
duration of the total simulation is quite long with respect to the typical duration of a single-cell storm (<2 h – e.g., Byers and Braham, 1949), but we adopted this setup in order to en-gulf the whole life cycle of the cell, with possible secondary cells.
4 Modeled lightning activity verification
Before showing the results of the EMTM simulations for the two selected cases, it is necessary to verify that the EMTM model is a valid tool for simulating cloud electrification. For this purpose, in this section a comparison of the model sim-ulations with lightning data collected by the LINET ground lightning network is carried out. It is worth noting that being the EMTM a one-dimensional model, it would not be possi-ble to compare the time evolution of the simulated and real cells. Therefore, our comparison does not aim at checking the model’s ability to quantitatively reproduce the observed lightning activity within a convective cell, but only addresses the consistency in the cloud model results. Specifically, there are two goals: (1) to look for analogies between lightning measurements and the main characteristics of the simulated electrical activity, such as flash rates and time evolution and occurrence of the IC and CG lightning; and (2) to check if the model has a realistic sensitivity to different environmen-tal conditions.
Once the isolated cluster of LINET strokes is detected, as shown in Figs. 7 and 8, a histogram is built using, for each one-minute sampling interval during a 7000 s time frame, the maximum rate of strokes measured for all 2×2 km2pixels.
We choose to use the maximum rate considering that the 1-D model simulates the kinematics and microphysics of the core of the real cell, and that the model results can not be compared to a total flash count or average flash count for the area of the real cell. It is assumed, instead, that by taking the maximum measured rate every minute, the evolution of the core of the real cell is represented in the histogram and, thus, can be better compared to the model results. In addition, one has to consider that especially for the Rome case, the LINET data may be affected by the limited sensitivity of the sen-sors, which causes some weak strokes to be undetected. Fur-ther, while LINET measures strokes, the EMTM simulates the total flash duration in the clouds. Thus, an attempt was made to convert measured strokes into flashes, by grouping strokes that are registered within a given time interval (e.g., 0.2 s) and within a given distance (e.g., 2 km). The IC and CG histogram curves slightly changed and shifted towards lower values, but the temporal evolution, which is a reliable mea-sure for the storm life cycle, remained the same as it was for the strokes. Thus, being aware that there is no absolute cri-terion to convert strokes into flashes, for the purpose of this paper we decided to use LINET strokes.
48 Figure 10
1
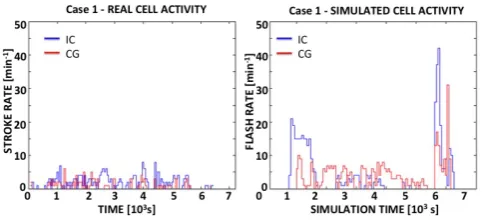
Fig. 10. Comparison between lightning measurements (left panel) and model results (right panel) for Case 1 (Munich, 29 July 2008). The left-panel histograms are built using the maximum number of IC and CG strokes that are registered in one-minute sampling inter-vals during a time frame of 7000 s for all pixels in the area circled in Fig. 4. The right-panel histograms show the IC and CG flashes produced by the EMTM model in one-minute sampling intervals during the 7000 s simulation time. In both panels, red line is for CG and blue line is for IC.
49 Figure 11
1
Fig. 11. Same as Fig. 10, but for Case 2 (Rome, 2 July 2009).
on the cloud microphysics, and hence on the electrical activ-ity, in spite of the detailed explicit microphysics scheme that characterizes the model.
The analogous results for Case 2 are shown in Fig. 11. As for Fig. 10, the left panel shows the registered activity, while the right panel shows the EMTM results. The measurements reveal the presence of significant IC activity throughout the storm, and increasing CG activity during its evolution, par-ticularly intense during the central phase of the event. Due to the high sensitivity threshold (7 kA) of the LINET network in Rome at the time of the event, the IC activity shown in the left panel might be underestimated. The time evolution of CG activity (approximately within the same time frame in the simulation as in the observations), as well as the order of magnitude of the flash rates, is represented quite well by the model (please note that when grouped into flashes as ex-plained above, the LINET maximum stroke rate drops from 21 to 14). Also, the IC activity shows some similarities: it is less intense than the CG activity and it starts at the early phase of the cell evolution, but, while the measurements re-veal IC activity throughout the evolution of the cell, in the model the ICs cease as the CGs intensify. This behavior will be explained in the next section, where the model results will be discussed in detail and the relationships between electri-cal activity and microphysics will be analyzed. However, it is worth mentioning here that the time evolution of the simu-lated IC flash rate is affected by the fact that a constant break-down electric field has been used (see Sect. 2), while the CG flash rates are more reliable since they result from the most intense lightning discharges.
From these results it can be concluded that the EMTM properly responds to the different environmental conditions of the two selected cases, producing very different electri-cal activity, and, most important, that some of the differences between the two cases are evidenced also in the measured activity. However, it must be also stressed that the measured data show some features that are not simulated well in the model (such as the IC time evolution in Case 2, and the over-estimation of ICs at the early and final stages of Case 1). This aspect, which is mostly due to the intrinsic limitations of a 1-D framework, should be taken into account when the EMTM
model is used as a tool for studying cloud electrification pro-cesses, as it will be shown in the next section. Finally, it is worth mentioning that the use of lightning location/detection systems with varying performances in different locations (as it is for LINET, which has different sensitivity thresholds in Munich and in Rome) makes it very difficult to perform ex-tensive validations of cloud electrification models. The char-acteristics of the available data (i.e., IC vs. CG discrimination ability, detection efficiency, accuracy of location) should be always taken into account.
5 Results
In this section the microphysical and electrical output from the EMTM model is thoroughly analyzed. First, the results of the simulations for the two selected case studies are illus-trated. Then, the results of sensitivity studies on the initial setup of the model are discussed and quantitative relation-ships between the cloud dynamical and microphysical prop-erties and the electrical activity are derived.
5.1 Analysis of simulated clouds
50
1
Figure 12
2
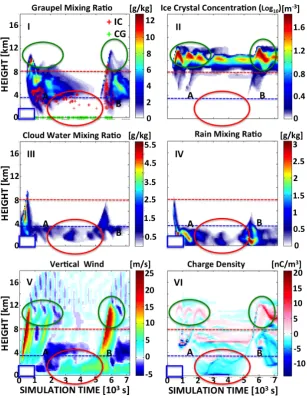
Fig. 12. Temporal evolution of hydrometeor mixing ratios (g kg−1), lightning occurrences, vertical wind (m s−1) and charge density (nC m−3)for Case 1 (Munich, 29 July 2008). The panels show: (I) graupel mixing ratio and lightning, (II) ice crystals concentration expressed in a log10 scale, (III) cloud water mixing ratio, (IV) rain mixing ratio, (V) vertical wind, and (VI) charge density. Results are
shown as a function of simulation time and height. The dotted red and blue lines mark the charging zone (CZ in the text). In panel (I) the IC are red crosses at the height where they initiate, and the CG are green crosses (shown at the surface). Each column represents a time step of 60 s. The red circle evidences a phase of negative charge density at low levels (see text). The green circles highlight the presence of high concentration of ice crystals at high levels associated to high positive charge density. Letters A and B evidence the phases of intense IC activity. The blue rectangle evidences the cloud initiation phase.
altitude of supercooled droplets (panel III) is a testament to the vigorous updraft, which strongly influences the graupel production/particle interactions in the CZ, identified as the region where the noninductive electrification processes occur (Takahashi, 1978; Jayaratne et al., 1983; Baker et al., 1987). The coexistence of supercooled cloud droplets with ice crystals at high altitudes (due to the strong updraft as shown in panel V), and the presence of high number density of grau-pel are the key factors for the ice-graugrau-pel noninductive charg-ing process represented in the EMTM model, as described by Nelson and Baker (2003). The surface charge separation
Because of the continuation of this weak lightning activity (evidenced by the red circle in panel I) we consider this cell as a unique case with two distinct phases. The first phase, be-tween time 1000 and 2000 s, is characterized by strong down-drafts developed in the cloud due to rain evaporation. This process was well described by early cloud models (Klemp and Wilhelmson, 1978) as responsible for the development of gust fronts and, under favorable wind shear environment, for the continuous development of new cells. The second phase is depicted as B. Here the graupel mixing ratio evolution be-tween 5200 s and 6500 s is illustrated. At about 5000 s, the convection starts again, with strong updrafts and production of high concentration of the hydrometeors. It is worth not-ing, as for the first phase described above, the presence of supercooled droplets carried to higher altitudes, associated with strong IC activity. The graupel at first is carried upward with the ice particles and then, as it grows, starts descend-ing leaddescend-ing to a strong charge separation. As a consequence, the model reproduces an increase of lightning activity. The strong charge separation process corresponds to relatively high concentrations of ice crystals in the CZ, represented by the tail shown in panel II.
The green circles in panels II and VI highlight evolution phases where high density positive charge at high altitudes (10–12 km) follows the evolution of high ice crystal con-centration (panel II). These phases are characterized by the presence of positive dipole (positive upper, negative lower) with upper IC flashes. These results confirm the simulations from Mansell et al. (2010) and the polarimetric radar anal-ysis by Bruning et al. (2007) where upper level IC lightning was associated to the development of a significant upper level positive charge region. The central phase of the cell evo-lution is characterized by the presence of a classic tripole structure (positive-negative-positive) within the CZ, with a smaller lower positive charge region, produced by noninduc-tive charge separation between graupel and small ice parti-cles. During this phase, when the updraft is weak or absent, and no riming growth process is expected (no liquid water is present at high levels), other charging conditions occur, such as supersaturation with respect to ice (as suggested by Mansell et al., 2010), considered a sufficient condition for charge separation. The charge density separation in this re-gion ensures the presence of lower altitude IC and CG light-ning.
Figure 13 shows the results obtained for the case study of 2 July 2009 over Rome (Case 2). A strong updraft is present within the CZ carrying supercooled cloud droplets to high al-titudes during the initial phase of cloud formation, followed, at about 600 s simulation time, by the formation of graupel in the CZ, and by growing ice crystals above the CZ. As in the previous case, the first stroke is an IC and it occurs af-ter 732 s of simulation time. It is followed by two IC flashes and finally by the first CG flash at 772 s, when graupel pel-lets fall to lower altitudes within the cloud. After the first updraft, at about 1000 s a strong downdraft develops caused
by precipitation (panel IV), inhibiting the formation of grau-pel and confining the cloud droplets below the CZ. Then, a new phase starts at about 2000 s with very strong updraft (larger green circle in panel V), carrying supercooled cloud droplets to higher levels, sustaining the growth of ice crys-tals (panel II) and the formation and growth of graupel parti-cles (panel I). The result is a strong charge separation in the CZ (panel VI), positive at the upper levels and negative at the lower levels, propagating above the CZ due to the pres-ence of growing ice crystals and below the CZ because of falling graupel pellets (red arrows in panel VI). The effect is the resumption of the IC electrical activity at 2700 s simula-tion time (see also Fig. 11, right panel) with a considerably higher altitude of the initiation point of the IC (green arrow in panel I) and intense IC activity within the CZ, strongly related to the presence of graupel. As seen for Case 1, the CG activity lasts throughout the duration of the simulation, sustained by the high negative charge density at low levels particularly between 4000 s and 7200 s of simulation time. For this reason, the simulation can be seen as representative of one single cell experiencing two different intensification phases.
51
Figure 13
1
Fig. 13. Same as for Fig. 12, but for Case 2 (Rome, 2 July 2009). The green circles evidence the presence of growing ice crystals and high concentration of ice crystals at high levels associated and high positive charge density. The red arrows in panel (VI) indicate high negative charge density at low levels. The green arrow in panel (I) indicates a very high initiation height of IC’s. The blue rectangle evidences the cloud initiation phase, where, besides the thermal perturbation, a constant vertical wind at cloud base has been applied to simulate orographic lifting.
height of the LINET strokes for the two selected case studies reveal the presence of a large number of strokes below 5 km for the Rome case, while, for the Munich case, strokes are confined above 5 km. The ICs below 5 km (or even around 2 km) can be the result of unsuccessful CG flashes that man-age to find opposite charged regions in the cloud instead of the ground.
The results shown above confirm that graupel plays a key role in cloud electrification processes, as shown by sev-eral modeling and observational studies (e.g., McCaul et al., 2009; Wiens et al., 2005; Kuhlman et al., 2006; Deierling et al., 2008). Cecil et al. (2005) show that as radar reflectivity (and, by inference, graupel) increases aloft (above 40 dBz),
altitudes above the CZ where graupel is not present. The CG activity is strongly related to the presence of negative charge at lower levels (within and below the CZ) carried by precipi-tating hydrometeors.
5.2 Quantitative relationships between cloud microphysics and lightning activity
From the previous results it is evident how the EMTM model can help in understanding the mechanism of cloud electrifi-cation following the noninductive ice–ice process. Using ex-perimental results on ice electrification in conjunction with the EMTM it would be possible to investigate the correla-tions between cloud dynamics, microphysics and electrical activity. While some conceptual aspects about cloud electri-fication are qualitatively understood, EMTM can be used to find quantitative correlations between the electrical activity of thunderstorms and their microphysical characteristics in order to build a systematic criterion for cloud classification based on their electrical properties. As we stated in the in-troduction, this cloud model can resolve explicitly the micro-physics of the cloud while, usually, 3-D cloud resolving mod-els use bulk microphysics. Moreover, by individually predict-ing the IC rate and CG rate it is possible to understand how well the model captures the co-evolving kinematic, micro-physical, and electrical properties, and agrees (or not) with observations. By predicting total lightning, and by using bulk microphysics, it would not be possible to gain such useful in-sights about cloud microphysics and its electrical properties. However, strong variability from one case to another has been found, showing that the model results depend critically not only on the environmental conditions, but also on the ini-tial perturbation that is used to initiate the cloud simulation. This is evidenced by some sensitivity studies that we have carried out for different cases, using different initial condi-tions. In particular, the results of a sensitivity study on the ini-tialization parameters for the 2 July 2009 case are illustrated below. Specifically, the EMTM initial perturbation parame-ters have been changed (Case 2A) with respect to the con-trol run (Case 2) as indicated in Table 1, which also provides some of the results of this sensitivity test. In Case 2, a weak vertical motion induced by the orographic forcing and a ther-mal deviation from the basic state at cloud base1T = −2 K are assumed. Case 2A represents a storm that has less en-ergy than Case 2 (i.e., lower CAPE and CAPE in the CZ as derived from the initial conditions), since the initial pertur-bation1T = −2.3 K generates a cloud that is characterized by lower humidity and higher (and colder) cloud base. As a result, the total number of lightnings, both IC and CG, are very significantly reduced in Case 2A. However, the IC/CG ratio for both simulations evidences some problems already mentioned in the previous section that could be attributed to the inability of the model to trigger correctly the ICs be-cause of the constant breakdown electric field assumption. Note that both model configurations for cloud initialization
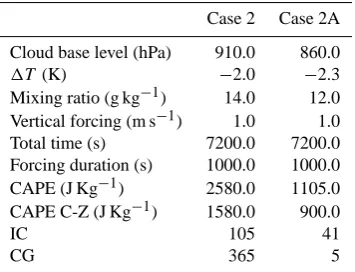
Table 1. Comparison of EMTM configuration and results for the sensitivity test for Case 2 (Rome, 2 July 2009). The following pa-rameters are considered: cloud base level (i.e., the condensation level of the initial cloud);1T (i.e., the thermal disturbance with respect to the environment of the initial cloud); mixing ratio (i.e., the mixing ratio of the parcel at ground level, assuming that the dis-placement is dry adiabatic); vertical forcing (i.e., the imposed initial updraft); total time (i.e., the total duration of the simulation); forc-ing duration (i.e., the time extension of the forcforc-ing); CAPE (i.e., the Convective Available Potential Energy); CAPE C-Z (i.e., the CAPE calculated between 0◦C and −25◦C levels); IC (i.e., the total amount of simulated intracloud lightning); CG (i.e., the total amount of simulated cloud-to-ground lightning).
Case 2 Case 2A
Cloud base level (hPa) 910.0 860.0
1T (K) −2.0 −2.3
Mixing ratio (g kg−1) 14.0 12.0 Vertical forcing (m s−1) 1.0 1.0 Total time (s) 7200.0 7200.0 Forcing duration (s) 1000.0 1000.0 CAPE (J Kg−1) 2580.0 1105.0 CAPE C-Z (J Kg−1) 1580.0 900.0
IC 105 41
CG 365 5
are compatible with the meteorological conditions of the se-lected case – as demonstrated by the fact that both show plau-sible temperature and vertical wind profiles, thus, represent-ing different possible real cells compatible with these envi-ronmental conditions.
52 Figure 14
1 Fig. 14. Comparison between the evolution of the simulated light-ning activity for Case 2 (left column) and Case 2A (right column). The top panels, showing the IC (red line) and CG (blue line) flashes produced by the EMTM in one-minute sampling intervals during the 7000 s simulation time, have been built as described in Sect. 4 – also note that the histograms for the control run (Case 2) have been already shown in Fig. 11 and are duplicated here for convenience. The bottom panels show the evolution of the IC initiation heights.
This type of sensitivity studies were also performed for Case 1, confirming a high sensitivity of the results to the initial conditions that in principle can be chosen quite ar-bitrarily for any given sounding. This induced us to con-sider more cases, and different initial perturbations, in or-der to look for statistical correlations between microphysics and lightning. Specifically, besides the two cases already de-scribed in the previous sections (Munich, 29 July 2008 and Rome, 2 July 2009), two additional cases were selected: one is the Wadi Ara (Israel) case of 6 April 2006, and the other is a second event over Munich that took place on 11 July 2008. The first event was a maritime storm that developed within a cyclonic system centered over Israel, with a cold pool in the middle troposphere positioned in the eastern Mediterranean. The second event was characterized by a weak southwesterly flow driven by a large depression centered over the North Sea.
For each of the four cases several simulations, correspond-ing to different initial conditions, were performed – for a total of 16 simulations. Each simulation lasted 7200 s, and the out-put was collected every minute. After a detailed analysis on the consistency and variability of the simulated cloud elec-trification properties with respect to its microphysical struc-ture and to the initial conditions, a database of simulated microphysical and thermodynamical cloud profiles and as-sociated lightning activity was generated. This database was then used in our search for statistical correlations between the
53 Figure 15
1
Fig. 15. Comparison between the evolution of the simulated grau-pel mixing ratio and lightning activity (top panels) and rain mixing ratio (bottom panels) for Case 2 (left column) and Case 2A (right column). The charging zone is delimited by the dotted red and blue horizontal lines. In top panels the ICs are marked as red crosses at the height where they initiate, and the CGs as green crosses at the surface. Finally, note that the results for the control run (Case 2) have been already shown in Fig. 13 and are duplicated here for con-venience.
microphysical/thermodynamical properties of a cloud and its electrical activity.
Our analysis in Sect. 5.1 clearly shows that the electrical activity is mostly correlated with graupel and vertical mo-tions – and therefore with the presence of supercooled cloud droplets at high levels and growing ice crystals. Thus, we have focused our study on the relationships of graupel colum-nar ice water content (CIWCg)and vertical wind at the
bot-tom of the CZ (wCZ)with total (IC +CG) flash rate
pro-duced by the cloud – with all variables sampled over one minute. The results are shown in Fig. 16 as scatterplots of CIWCg(kg m−2)andwCZ(m s−1) vs. the total flash rate.
Ev-idently, there is only a semi-quadrant covered by the graupel-lightning data, meaning that the high flash-rate values are in-compatible with low values of graupel content. More specif-ically, according to the EMTM simulations, to each sampled total flash rate corresponds a minimum threshold of CIWCg
in the cloud that increases with increasing flash rate. As a result, it has been possible to find a best fit (red line in Fig. 16) representing a linear relationship of the threshold between the total flash rate and the minimum value allowed for columnar graupel. As in the case of graupel, the vertical motion/lightning data fall in one semi-quadrant, suggesting that there exists a minimum value ofwCZthat allows a given
54
Figure 16
1Fig. 16. Scatterplots of graupel columnar ice water content (top panel) and of vertical wind at the base of the charging zone (bot-tom panel) vs. total flash rate (IC+CG) sampled every minute. The red lines represent the minimum-threshold regression curves of Ta-ble 2.
ensuring effective charge separation and instigating intense lightning activity (both IC and CG). In this case, a quadratic relationship of minimum threshold for the vertical motion at the base of the CZ as a function of the total flash rate has been obtained (red curve). Note that in each panel, the point indi-cated by the arrow represents an extreme flash rate value that occurs rarely in nature (e.g., Deierling et al., 2008; Kuhlman et al., 2006) and therefore has not been considered in our regression. Table 2 shows the coefficients of these linear and quadratic threshold relationships of CIWCgandwCZ,
respec-tively, with total flash rate sampled every minute.
We are aware that while these quantitative minimum-threshold relationships are representative of the variability of the microphysics, thermodynamics, and electrical activ-ity in all simulated clouds, the considered simulations might not be enough to draw definite conclusions. In addition, the results shown in the previous sections have evidenced some
Table 2. Regression curves of minimum thresholds for graupel columnar ice water content (CIWCg, in kg m−2)and vertical wind
at the bottom of the CZ (wCZ, in m s−1) with respect to total
(IC+CG) flash rate, and relative coefficients derived from the data displayed in Fig. 16 (the red lines in the two panels).
Type Function
CIWCgvs. Flash Rate ax+b 0.1218 0.0
wCZvs. Flash Rate ax2+bx 0.0023 0.031
problems in the triggering of ICs and, to a less extent, of CGs, depending on the model setup, which should be properly ad-dressed. Thus, further verification of the minimum-threshold best fits will be subject of future studies, in which EMTM simulations of more case studies will be carried out using different functions of the breakdown electric field. Neverthe-less, we would like to point out here that the existence of minimum-threshold relationships has been proposed by pre-vious studies (e.g., Byers and Braham, 1948), and that they are quite important for several reasons. First of all, these re-lationships can be used to infer cloud properties based on IC and CG flash rates as observed by ground lightning networks – i.e., given a certain measured total flash rate it should be possible to infer the minimum value of graupel mass content and updraft in the observed cell, and to some extent char-acterize the cloud through important microphysical and dy-namical properties. In this regard, it is worth noting that Cecil et al. (2005) suggest that, based on observational evidence, for a given flash rate there is a most likely vertical profile of reflectivity (precipitation). Moreover, these relationships can be very useful to identify the relevant features of the most in-tense cells, characterized by high flash rate values, for which the estimate of a minimum threshold for vertical motion and graupel mass can be very useful. Both the intensity of the updraft and the graupel mass content can in fact pose use-ful constraints in the attempt to evaluate a thunderstorm’s strength and, most importantly, to estimate the precipitation rate through the use of other data (radar and/or satellite ob-servations).
6 Summary and conclusions
with strong updrafts, and, therefore, with the presence of su-percooled droplets in the CZ (and above), high density of growing ice crystals, and graupel.
The first part of the work consisted in a comparison with real lightning data in order to verify the plausibility of the model results. To this end, two case studies were consid-ered and the data available from the LINET ground net-work, which measures and discriminates between IC and CG flashes with high sensitivity, were used. It was shown that, generally, the model simulates lightning activity (IC and CG flash rate evolution and totals) with a reasonable confidence, and responds in the correct way to different environmen-tal conditions. However, some inconsistencies in the IC vs. CG lightning distribution and temporal evolution were found, and they have been attributed mostly to the model setup as-sumption – particularly, the asas-sumption of a constant break-down electric field. Generally the EMTM model simulates better the events with strong electrical activity and therefore has shown good reliability for Case 2, which is a maritime storm characterized by a thick cumulonimbus with elevated content of moisture at low levels. Nevertheless, the IC initi-ation heights (sometimes lower than 5 km) and the IC evolu-tion with respect to CG have evidenced some limitaevolu-tions in the model. On the other hand, for Case 1, which is a weaker continental thunderstorm with elevated condensation level, the model tends to produce stronger vertical motions than those expected from the sounding. This effect is attributed to a weak entrainment parameterization that cannot repro-duce adequately the loss of energy by the warm bubble due to mixing with dry air. We also found some inconsistencies in the timing and intensity of IC flashes, particularly during the initial and final phases of the weaker cells.
We then performed a thorough analysis of the microphys-ical, thermodynamical and electrical output of the EMTM model for the two selected case studies. These results con-firm the ice–ice noninductive electrification hypothesis as an important mechanism for thunderstorm charge separation. Specifically, in agreement with previous studies, it turns out that graupel plays a key role in cloud electrification and is a good indicator of lightning activity. In particular, the IC ac-tivity in the CZ is strongly correlated with the graupel mixing ratio, while the highest occurrences of ICs occur in corre-spondence of strong updrafts. In addition, the EMTM shows that the presence of supercooled droplets at high altitudes in the cloud is another important factor leading to the pres-ence of IC activity, even at high altitudes above the CZ where graupel is not present. Furthermore, the CG activity was al-ways found to follow the first IC flashes and to be strongly linked to the presence of graupel and, therefore, to negative charge carried down to low levels by precipitating hydrome-teors.
In both case studies, high density positive charge at high altitudes (10–12 km) followed the evolution of high ice crys-tal concentration, confirming the simulations of Mansell et al. (2010) and the analysis by Bruning et al. (2007) where
upper level IC lightning was associated to the develop-ment of a significant upper level positive charge region. The classic tripole structure (positive-negative-positive), which is produced by noninductive charge separation between grau-pel and small ice particles, is particularly evident for the weaker continental case and ensures the presence of lower IC and CG lightning even during the weaker phase of the storm. In this regard, it is worth noting that the explicit microphysics scheme used in the EMTM allows for a bet-ter treatment of electrification processes related to crystal growth and ice multiplication processes (splintering, Hallett-Mossop, etc.) with respect to bulk microphysics schemes, particularly single-moment schemes, where only the mass of the hydrometeor is predicted (as shown by Mansell et al., 2010). In contrast, the EMTM predicts the ice crystal con-centration for different mass bins, and this result is used to derive the charge separation process in rebounding collisions with mass-binned graupel.
The EMTM results were shown to be highly sensitive not only to the environmental conditions but also to the initial cloud perturbation. Thus, in order to find quantitative rela-tionships of cloud microphysics and thermodynamics with associated cloud electrical activity, and in order for these re-lationships to be representative of different kinds of clouds, several simulations, with different initial conditions for four different case studies were carried out. For all simulations, the graupel columnar ice water contents and the updrafts at the base of the CZ were related to the total flash rates. Two minimum-threshold relationships were found, which indicate the minimum amounts of columnar graupel and updraft that are necessary to produce any certain value of total flash rate. In other words, the EMTM model results show that a given total flash rate can be observed only if the amount of grau-pel and the updraft in the cloud are above a minimum value. These minimum values were also quantified as a linear and a quadratic relationship of the graupel columnar ice water con-tent and of the updraft at the base of CZ, respectively, with the total (IC+CG) flash rate.
cloud microphysical and dynamical properties in conjunction with lightning data from ground networks, such as LINET.
Acknowledgements. This research has been supported by the European Commission Sixth Framework Programme through the project “Observation, Analysis and Modeling of Lightning Activity in Thunderstorms, for use in Short Term Forecasting of Flash Floods” (FLASH) (Project Number 036852), by the European Community Initiative INTERREG III-B ARCHIMED through the project “Weather Risk Reduction in the Central and Eastern Mediterranean” (RISKMED), and by the Italian FISR-MIUR programme “Sustainable Development and Climate Changes” through the project “Aerosol Effects on Clouds and Climate” (AEROCLOUDS). The EMTM model was provided by Robert Solomon during a visit at CNR-ISAC in Rome, supported by the Italian Space Agency (ASI) and by the Italian National Group for Prevention from Hydrogeological Hazards (GNDCI). The authors wish to thank Corrado Ratto and Claudia Adamo for their helpful discussions and contributions to the manuscript. The authors wish to thank Konstantinos Lagouvardos and the other two anonymous referees for their very helpful suggestions and comments.
Edited by: S. Davolio
Reviewed by: K. Lagouvardos and two anonymous referees
References
Adamo, C., Solomon, R., Goodman, S., Cecil, D., Dietrich, S., and Mugnai, A.: Lightning and precipitation: Observational analy-sis of LIS and PR, in: Proceedings of the 5th EGS Plinius Con-ference on Mediterranean Storms, Ajaccio, Corsica, France, 1–3 October 2003, edited by: Testud, J., Mugnai, A., and Santucci, J.-F., 533–538, 2003.
Adamo, C., Goodman, S., Mugnai, A., and Weinman, J. A.: Lightning measurements from satellites and significance for storms in the Mediterranean, in: Lightning: Principles, Instru-ments and Applications: Review of Modern Lightning Research, edited by: Betz, H.-D., Schumann, U., and Laroche, P., Springer Science+Business Media B.V., Dordrecht, The Netherlands, ISBN: 978-1-4020-9078-3, 309–329, 2009.
Asai, T. and Kasahara, A.: A theoretical study of the compensat-ing downward motions associated with cumulus clouds, J. Atmos Sci., 24, 487–496, 1967.
Baker, B., Baker, M. B., Jayaratne, E., Latham, J., and Saunders, C.: The influence of diffusional growth rates on the charge trans-fer accompanying rebounding collisions between ice crystals and hailstones, Q. J. Roy. Meteor. Soc., 113, 1193–1215, 1987. Barthe, C. and Pinty, J.-P.: Simulation of electrified storms with
comparison of the charge structure and lightning efficiency, J. Geophys. Res., 112, D19204, doi:10.1029/2006JD008241, 2007. Barthe, C., Chong, M., Pinty, J.-P., Bovalo, C., and Esco-bar, J.: CELLS v1.0: updated and parallelized version of an electrical scheme to simulate multiple electrified clouds and flashes over large domains, Geosci. Model Dev., 5, 167–184, doi:10.5194/gmd-5-167-2012, 2012.
Betz, H.-D., Schmidt, K., Oettinger, W. P., and Wirz, M.: Light-ning detection with 3D discrimination of intracloud and
cloud-to-ground discharges, J. Geophys. Res. Lett., 31, L11108, doi:10.1029/2004GL019821, 2004.
Betz, H.-D., Schmidt, K., Fuchs, B., Oettinger, W. P., and Holler, H.: Cloud lightning: Detection and utilization for total-lightning measured in the VLF/LF regime, J. Lightning Res., 2, 1–17, 2007.
Betz, H.-D., Marshall, T. C., Stolzenburg, M., Schmidt, K., Oet-tinger, W. P., Defer, E., Konarski, J., Laroche, P., and Dombai, F.: Detection of in-cloud lightning with VLF/LF and VHF net-works for studies of the initial discharge phase, Geophys. Res. Lett., 35, L23802, doi:10.1029/2008GL035820, 2008.
Betz, H.-D., Schmidt, K., Laroche, P., Blanchet, P., Oettinger, W. P., Defer, E., Dziewit, Z., and Konarski, J.: LINET – An inter-national lightning detection network in Europe, Atmos. Res., 91, 564–573, 2009.
Brooks, I. M., Saunders, C. P. R., Mitzeva, R. P., and Peck, S. L.: The effect on thunderstorm charging of the rate of rime accretion by graupel, Atmos. Res., 43, 277–295, 1997.
Bruning, E. C., Rust, W. D., Schuur, T. J., MacGorman, D. R., Kre-hbiel, P. R., and Rison, W.: Electrical and polarimetric radar ob-servations of a multicell storm in TELEX, Mon. Weather Rev., 135, 2525–2544, 2007.
Byers, H. R. and Braham Jr., R. R.: Thunderstorm structure and circulation, J. Meteorol., 5, 71–86, 1948.
Byers, H. R. and Braham Jr., R. R.: The Thunderstorm: Final Report of the Thunderstorm Project, US Government Printing Office, Washington, DC, USA, 282 pp., 1949.
Cecil, D. J., Goodman, S. J., Boccippio, D. J., Zipser, E. J., and Nes-bitt, S. W.: Three years of TRMM precipitation features, Part I: Radar, radiometric, and lightning characteristics, Mon. Weather Rev., 133, 543–566, 2005.
Chalmers, J. A.: Atmospheric Electricity, Pergamon press, New York, USA, 515 pp., 1967.
Deierling, W. and Petersen, W. A.: Total lightning activity as an in-dicator of updraft characteristics, J. Geophys. Res., 113, D16210, doi:10.1029/2007JD009598, 2008.
Deierling, W., Petersen, W. A., Latham, J., Ellis, S., and Chris-tian, H.: The relationship between lightning activity and ice fluxes in thunderstorms, J. Geophys. Res., 113, D15210, doi:10.1029/2007JD009700, 2008.
Dye, J. E., Winn, W. P., Jones, J. J., and Breed, D. W.: The electri-fication of New Mexico thunderstorms, Part 1: The relationship between precipitation development and the onset of electrifica-tion, J. Geophys. Res., 94, 8643–8656, 1989.
Fierro, A. O., Gilmore, M. S., Mansell, E. R., Wicker, L. J., and Straka, J. M.: Electrification and lightning in an idealized boundary-crossing supercell simulation of 2 June 1995, Mon. Weather Rev., 134, 3149–3172, 2006.
Gardiner, B., Lamb, D., Pitter, R., Hallet, J., and Saunders, C.: Mea-surements of initial potential gradients and particles charges in a Montana summer thunderstorm., J. Geophys., Res., 90, 6079– 6086, 1985.
Gillespie, D. T.: Three models for the coalescence growth of drops, J. Atmos. Sci., 32, 600–607, 1975.


![An Efficient Method For The One-Pot, Four-Component Benzaldehyde Based Synthesis of 3-Methyl-1,4-Diphenyl-7,8-Dihydro-1H-Furo[3,4-E]Pyrazolo[3,4-B]Pyridin-5(4H)-Ones Catalyzed by Alum in Environment-Friendly Media.](data:image/gif;base64,R0lGODlhAQABAIAAAP///wAAACH5BAEAAAAALAAAAAABAAEAAAICRAEAOw==)