WHAT’S KNOWN ON THIS SUBJECT: In 2000/2001, the American Academy of Pediatrics published recommendations for attention-deficit/hyperactivity disorder (ADHD) care. According to
pediatricians’self-report of adoption of these guidelines, community-based ADHD care appears to be marginally adequate.
WHAT THIS STUDY ADDS: Using reviews of.1500 patient charts, this study demonstrates that community-based ADHD care is not consistent with evidence-based practice. Furthermore, variability in much of community-based ADHD care is unrelated to the provider, suggesting that innovative, system-wide interventions are needed to improve ADHD care.
abstract
BACKGROUND:Although many efforts have been made to improve the quality of care delivered to children with attention-deficit/hyperactivity disorder (ADHD) in community-based pediatric settings, little is known about typical ADHD care in these settings other than rates garnered through pediatrician self-report.
METHODS:Rates of evidence-based ADHD care and sources of variability (practice-level, pediatrician-level, patient-level) were determined by chart reviews of a random sample of 1594 patient charts across 188 pediatricians at 50 different practices. In addition, the associations of Medicaid-status and practice setting (ie, urban, suburban, and rural) with the quality of ADHD care were examined.
RESULTS:Parent- and teacher-rating scales were used during ADHD assessment with approximately half of patients. The use ofDiagnostic and Statistical Manual of Mental Disorderscriteria was documented in 70.4% of patients. The vast majority (93.4%) of patients with ADHD were receiving medication and only 13.0% were receiving psychosocial treat-ment. Parent- and teacher-ratings were rarely collected to monitor treatment response or side effects. Further, fewer than half (47.4%) of children prescribed medication had contact with their pediatrician within the first month of prescribing. Most variability in pediatrician-delivered ADHD care was accounted for at the patient level; however, pediatricians and practices also accounted for significant variability on specific ADHD care behaviors.
CONCLUSIONS:There is great need to improve the quality of ADHD care received by children in community-based pediatric settings. Im-provements will likely require systematic interventions at the practice and policy levels to promote change.Pediatrics2014;134:1136–1143
AUTHORS:Jeffery N. Epstein, PhD,aKelly J. Kelleher, MD,b
Rebecca Baum, MD,bWilliam B. Brinkman, MD, MEd, MSc,a
James Peugh, PhD,aWilliam Gardner, PhD,b,cPhil
Lichtenstein, MD,dand Joshua Langberg, PhDe
aDepartment of Pediatrics, Cincinnati Children’s Hospital Medical
Center, Cincinnati, Ohio;bDepartment of Pediatrics, Nationwide
Children’s Hospital, Columbus, Ohio;cDepartment of Psychiatry,
Dalhousie University, Halifax, Nova Scotia, Canada;dThe Children’s
Home of Cincinnati, Cincinnati, Ohio; andeDepartment of
Psychology, Virginia Commonwealth University, Richmond, Virginia
KEY WORDS
attention deficit and disruptive behavior disorders, pediatrics, behavioral medicine, guidelines, quality
ABBREVIATIONS
AAP—American Academy of Pediatrics ADHD—attention-deficit/hyperactivity disorder
DSM-IV—Diagnostic and Statistical Manual of Mental Disorders, Fourth Edition
EHR—electronic health record
Dr Epstein contributed to the conceptualization and the design of the study, and drafted the initial manuscript; Drs Kelleher, Baum, Brinkman, Lichtenstein, and Langberg contributed to the conceptualization and the design of the study, and reviewed and revised the manuscript; Drs Peugh and Gardner carried out the initial analysis, and reviewed and revised the manuscript; and all authors approved thefinal manuscript as submitted and agree to be accountable for all aspects of the work. www.pediatrics.org/cgi/doi/10.1542/peds.2014-1500 doi:10.1542/peds.2014-1500
Accepted for publication Sep 11, 2014
Address correspondence to Jeffery N. Epstein, PhD, Cincinnati Children’s Hospital Medical Center, 3333 Burnet Ave, ML #10006, Cincinnati, OH 45229-3039. E-mail: [email protected] PEDIATRICS (ISSN Numbers: Print, 0031-4005; Online, 1098-4275). Copyright © 2014 by the American Academy of Pediatrics
FINANCIAL DISCLOSURE:The authors have indicated they have nofinancial relationships relevant to this article to disclose.
FUNDING:This research was supported by grant R01 MH083665 from the National Institute of Mental Health and grant UL1 TR000077 from the National Center for Advancing Translational Sciences of the National Institutes of Health. Drs Epstein and Brinkman are supported by grants K24MH064478 and K23MH083027 from the National Institute of Mental Health, respectively. The content is solely the responsibility of the authors and does not necessarily represent the official views of the NIH. Funded by the National Institutes of Health (NIH).
Most children with attention-deficit/ hyperactivity disorder (ADHD) receive care from community-based pediatri-cians.1,2According to pediatricians’
self-report, the quality of ADHD care delivered by community-based pediatricians is modest.3–7For example, in a large survey
(n= 1374), 78% of pediatricians reported using ADHD guidelines, 55% reported following Diagnostic and Statistical Manual of Mental Disorders(DSM) cri-teria to diagnose ADHD, and approxi-mately 80% reported routinely collecting parent and teacher ratings during as-sessment.4 However, recent research
reviewing ADHD patient charts suggests a poorer quality of care.8 Among 49
pediatricians from 8 practices, only 20% of patients were evaluated with parent or teacher rating scales during ADHD assessment. Further, none of the pedia-tricians used ADHD parent and teacher ratings to monitor treatment progress.8
The small number of practices sampled in Epstein et al8did not allow for
anal-yses of whether variability in ADHD care was associated with patients, pedia-tricians, and/or practices. Also, although some investigators speculated that ru-ral location, academic affiliation, and serving patients of low socioeconomic status may affect patient care,9–15there
are few published data about the effect of practice characteristics on ADHD care. Improving care for complex, chronic conditions requires understanding the sources and predictors of variability to know which factors to address. For ex-ample, a low rate of care but with significant variability attributable to practices or pediatricians indicates that some practices and/or pediatricians can implement this care. This in turn suggests that changes at the practice or physician level (eg, adopting a policy requiring completion of teacher scales before scheduling an ADHD assessment visit) can improve these areas of care. Conversely, care behaviors for which variability can be explained only at the
patient level would suggest that current systems of care and incentives for en-gaging in these care behaviors are not effective at targeting these behaviors. Rather, system-level interventions (eg, plan-based care coordination or pay-for-performance) may be necessary to change these care behaviors.
This study presents rates and sources of variability (eg, patient, pediatrician, or practice level) for ADHD care16–18
de-rived from chart reviews across 50 so-cioeconomically and demographically diverse pediatric practices. In addition, relations between practice character-istics and ADHD care are examined with the prediction that rural and high-poverty settings predict poorer ADHD care.
METHODS
Participants and Setting
Practices were recruited from August 2010 through December 2012 to partic-ipate in a study focusing on improving the quality of community-based ADHD care. The data presented reflect rates of ADHD care before any intervention. To recruit, a mailing was sent out to 128 practices in Central and Northern Ohio that served primarily children, had at least 2 pediatricians, and did not have access to an on-site mental health pro-fessional. Thefirst 50 pediatric practices that responded and met our inclusion criteria were selected to participate. The remaining practices either did not re-spond, responded late, chose not to participate because they refer out all patients for ADHD care, or declined. The 50 participating practices included 188 health care providers (184 pediatricians and 4 nurse practitioners).
Chart Reviews
We reviewed charts to assess pedia-tricians’ADHD care practices. To select patient charts, we retrieved billing records with an ADHD diagnosis code during the past year. Coders randomly selected 10 patients per practitioner by
selecting everynth patient from the list, wheren= (number of patients on the billing query)/10. To ensure that ADHD assessment care was represented in the chart review, we attempted to include at least 5 patient charts per pediatrician with evidence of an ADHD assessment. Because these chart reviews required a review of retrospective patient charts, a waiver of consent was granted from author institutional review boards on the condition that no identifying or de-mographic information from the patient charts would be recorded.
The following information was extracted from each patient chart for any ADHD care between 2002 (the year after the American Academy of Pediatrics [AAP] ADHD guidelines were released) and the date of the chart review (August 2010 through December 2012): (1) presence of parent and teacher ratings during ADHD assessment, (2) documentation of whether child metDiagnostic and Sta-tistical Manual of Mental Disorders, Fourth Edition(DSM-IV) ADHD criteria, (3) date of ADHD diagnosis, (4) documenta-tion of ADHD medicadocumenta-tion prescripdocumenta-tion, (5) date of initial ADHD medication pre-scription, (6) documentation of behavior therapy suggested, (7) dates of ADHD-related treatment visits and contacts (ie, phone, E-mail correspondence), and (8) dates of collection for parent- and teacher-completed ADHD rating scales.
Measurement of Practice Characteristics
Pediatricians reported the percentage of their patients whose primary payer was Medicaid. They also reported if their practice was affiliated with an academic medical center and classified the setting of their practice as urban, suburban, or rural.
Statistical Analyses
Patients were nested within pediatricians and pediatricians were nested within practices. We computed all descriptive
models, we estimated the percentage of variability in each ADHD care variable across patients, pediatricians, and prac-tices and statistically tested whether these estimates differed from zero.
SAS Proc Mixed (SAS Institute, Inc, Cary, NC) was used to model the continuous variables (eg, number of ADHD treat-ment contacts) using Kenward-Roger19
degrees of freedom forfixed-effect pa-rameter estimate tests. Mplus version 7.11 (Muthen & Muthen, Los Angeles, CA) was used to estimate the predictor vari-ables effects on binary response varia-bles (ie, presence or absence of rating scale in patient chart).
In predicting treatment-related ADHD care, we used the“time to events” as indices of the timeliness of ADHD treat-ment. We defined duration as the num-ber of days from when the patient was initially prescribed medication until the relevant event (eg, the collection of the teacher rating). Cox proportional haz-ards regression models with clustering of patients under pediatricians and us-ing robust SEs were conducted to as-sess the association between practice characteristics and the times to events. For some patients, the target event had not occurred between the time of the initial prescription and the date of the chart review. For those cases, the time to the event was the time from pre-scribing until the time of the chart review, and the observation was right-censored in the analyses. All Cox anal-yses were conducted using R (version 3.01 Gentleman & Ihaka, Auckland, NZ).
RESULTS
The mean age of the 188 health care providers was 43.5 (SD 9.5) years. The average number of years since pro-vidersfinished their training was 12.9 years (SD 9.1). Most providers were white (n= 158, 86%) and women (n= 117, 64%).
patient charts provided information about both ADHD assessment and ADHD treatment and 496 patient charts in-cluded information about ADHD treat-ment only.
Descriptives
ADHD Assessment Care
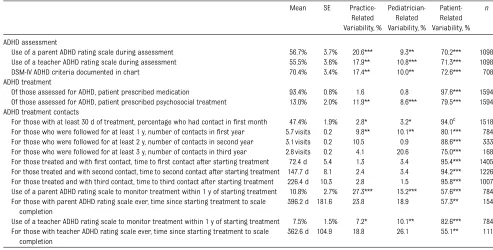
Pediatricians used parent and teacher ratings of ADHD during the ADHD diag-nostic process 56.7% (SE 3.7%) and 55.5% (SE 3.6%) of the time, respectively. Evi-dence of children meeting DSM-IV criteria for ADHD was documented in patient charts 70.4% (SE 3.4%) of the time. Most of the variability in the assessment variables was at the patient level, but significant variability was also present at the pedi-atrician and practice levels (Table 1).
ADHD Treatment Care
Of all children assessed for ADHD (n= 1098), pediatricians prescribed medica-tion in 93.4% (SE 0.8%) of cases, whereas documentation that psychosocial treat-ment (eg, parent training, therapy) was recommended or being used by families was present in only 13.0% (SE 2.0%) of charts. Most of the variability on these 2 variables was accounted for at the patient level. However, significant variability for the psychosocial treat-ment variable also was also present at the pediatrician and practice levels (Table 1).
Among children with at least 30 days between prescribing medication and the chart review (n= 1518), 47.4% (SE 1.9%) had visit or phone contacts during thefirst month after prescribing medi-cation. Of these contacts, 53% of patients had at least 1 office visit, 35% had at least 1 phone contact, and 12% had at least 1 visit and 1 phone contact during thefirst month of treatment. There were no instances of E-mail contacts during the first month of treatment. Across all children with at least 1 such contact
72.4 (SE 5.4) days. Times until the second and third contacts were 147.7 (SE 8.1;n= 1226) days and 226.4 (SE 10.3;n= 1007) days, respectively (Fig 1).
Of those patients with at least 1 year between prescribing medication and the chart review (n= 784), children aver-aged 5.7 (SE 0.2) contacts in the first year of treatment. Most of these con-tacts were office visits (4.5 visits per year), with 1.3 per year being phone contacts. E-mail contacts (0.01 E-mails/ year) were rare. Fewer contacts oc-curred during the second (3.1 [SE 0.2] contacts; n = 333 patients) and third years (2.8 [SE 0.2] contacts; n = 168 patients) of treatment.
Finally, with regard to monitoring treat-ment response with objective ratings, a minority of patient charts had evidence of parent (10.8%, SE 2.7%) or teacher ratings (7.5%, SE 1.5%) within thefirst year of treatment. Moreover, the average time to collection of parent (396.2 days, SE 181.6 days) or teacher ratings (362.6 days, SE 104.9 days) after prescribing medication for those with rating scales was quite long (see Fig 1).
Most of the variability in patterns of ADHD treatment contacts and follow-up practice behavior occurred at the pa-tient level (Table 1). Significant vari-ability also occurred at the pediatrician level and practice level for a few ADHD care treatment variables (eg, contact within thefirst month; Table 1).
Prediction of Evidence-Based Care
Medicaid Status
a dichotomous indicator of academic affiliation, and their interaction pre-dicted each of the selected ADHD care variables. Only psychosocial treatment demonstrated a relationship with any of the predictors. There was a significant main effect for academic affiliation and a significant Medicaid 3academic
af-filiation interaction. As the proportion of Medicaid patients at a practice in-creased, rates of psychosocial treatment
increased at nonacademic practices and decreased at academic practices (Fig 2). Cox models examining time-to-event vari-ables found largely no relations between Medicaid percentage and academic
af-filiation (Table 2). The exceptions were that academic practices had a shorter time to the first contact. Also, having more Medicaid patients predicted a longer time to collecting parent ratings to monitor treatment response.
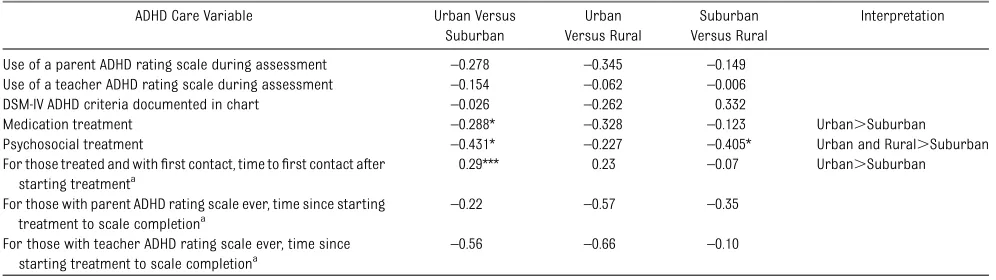
Practice Location
Fifty-three pediatricians reported being located in urban settings and 103 self-reported as suburban and 17 as rural. Pediatricians in urban settings used medications more often than suburban pediatricians. Also, urban and rural pediatricians used psychosocial treat-ments more frequently than suburban pediatricians. Patients at suburban practices had shorter durations between TABLE 1 ADHD Care Descriptive Statistics and the Percentage of Variance Accounted for by Practices, Pediatricians, and Patients
Mean SE Practice-Related Variability, %
Pediatrician-Related Variability, %
Patient-Related Variability, %
n
ADHD assessment
Use of a parent ADHD rating scale during assessment 56.7% 3.7% 20.6*** 9.3** 70.2*** 1098 Use of a teacher ADHD rating scale during assessment 55.5% 3.6% 17.9** 10.8*** 71.3*** 1098 DSM-IV ADHD criteria documented in chart 70.4% 3.4% 17.4** 10.0** 72.6*** 708a
ADHD treatment
Of those assessed for ADHD, patient prescribed medication 93.4% 0.8% 1.6 0.8 97.6*** 1594 Of those assessed for ADHD, patient prescribed psychosocial treatment 13.0% 2.0% 11.9** 8.6*** 79.5*** 1594 ADHD treatment contacts
For those with at least 30 d of treatment, percentage who had contact infirst month 47.4% 1.9% 2.8* 3.2* 94.0c 1518 For those who were followed for at least 1 y, number of contacts infirst year 5.7 visits 0.2 9.8** 10.1** 80.1*** 784 For those who were followed for at least 2 y, number of contacts in second year 3.1 visits 0.2 10.5 0.9 88.6*** 333 For those who were followed for at least 3 y, number of contacts in third year 2.8 visits 0.2 4.1 20.6 75.0*** 168 For those treated and withfirst contact, time tofirst contact after starting treatment 72.4 d 5.4 1.3 3.4 95.4*** 1405 For those treated and with second contact, time to second contact after starting treatment 147.7 d 8.1 2.4 3.4 94.2*** 1226 For those treated and with third contact, time to third contact after starting treatment 226.4 d 10.3 2.8 1.5 95.8*** 1007 Use of a parent ADHD rating scale to monitor treatment within 1 y of starting treatment 10.8% 2.7% 27.3*** 15.2*** 57.6*** 784 For those with parent ADHD rating scale ever, time since starting treatment to scale
completion
396.2 d 181.6 23.8 18.9 57.3** 154
Use of a teacher ADHD rating scale to monitor treatment within 1 y of starting treatment 7.5% 1.5% 7.2* 10.1** 82.6*** 784 For those with teacher ADHD rating scale ever, time since starting treatment to scale
completion
362.6 d 104.9 18.8 26.1 55.1** 111
*P,.05, **P,.01, ***P,.001.
aOnly uses patients whose pediatrician conducted the ADHD evaluation.
FIGURE 1
Timeline representing mean durations (with SEs) untilfirst, second, and third treatment contacts and obtaining parent and teacher ratings after medication initiation.
medication initiation and thefirst contact than urban-based practices (Table 3).
Associations Among Practice Characteristics
Practice location, percent Medicaid, and academic status of practices were strongly associated. Academic practices primarily served a Medicaid population (83.5%) compared with an average of 33.0% Medicaid patients for nonaca-demic practices (P,.0001). Similarly,
with rural (47.9%) and urban (78.1%) practices. Academic practices are pri-marily concentrated in urban settings (64.3% of urban practices), compared with 3.1% in suburban settings, and a complete absence of academic practi-ces in rural locations (P,.0001, Fish-er’s exact test). This interdependence among practice characteristics pre-vented us from identifying independent effects (eg, multiple regressions) of any single predictor on quality of care.
DISCUSSION
Rates of pediatrician-delivered evidence-based ADHD care across a diverse set of pediatric practices were determined by using reviews of a randomly selected sample of patient charts. Pediatricians used parent and teacher rating scales during ADHD assessment with approxi-mately half of patients, and used DSM criteria in approximately two-thirds of patients in community-based pediatric settings. Based on information in patient charts, the vast majority of ADHD patients received medication and few received psychosocial treatment. Few pediatricians used parent and teacher rating scales to monitor treatment re-sponse and side effects (∼10%) despite AAP consensus recommendations17 to
contact with their pediatrician within the
first month of treatment. Further, during the first year of medication, follow-up contacts occurred approximately every 2.5 months with lower rates of follow-up contact in subsequent years. Thus, de-spite the publication of ADHD consensus guidelines more than a decade ago,16,17
adoption of evidence-based ADHD care in community-based pediatric settings remains poor.
These marked deviations from recom-mended practice fell into 2 categories: (1) ADHD care behaviors for which significant variability occurred at the pediatrician or practice level (and thus, might be amenable to practice inter-ventions), and (2) ADHD care behaviors for which variability was attributable primarily to patients. Thefirst category included collection of parent and teacher rating scales during assessment, use of DSM criteria to document ADHD, pre-scribing psychosocial treatment to pa-tients, contacting parents within 1 month of initiating treatment, number of con-tacts in thefirst year of treatment, and use of parent and teacher ratings to monitor treatment response. Because pediatricians and practices were associ-ated with variability in rates of ADHD care behaviors across patients, we believe that the adoption of pediatrician- or practice-level modifications to ADHD systems of care can improve these areas of care.
The second category of ADHD care be-haviors does not vary according to practice or physician. These behaviors included number of contacts in the second and third years of treatment; time tofirst, second, and third contacts; and time to collection of parent and teacher ratings to monitor treatment response. These patient-care activities are driven largely by patients. For pediatricians to improve these ADHD care behaviors, it seems that pedia-tricians would need to take on additional FIGURE 2
Graphical depiction of significant interaction between proportion of patients receiving Med-icaid and academic affiliation on rates of re-ceiving psychosocial treatment. For purposes of illustration, the proportion of patients receiving Medicaid was centered to illustrate how prac-tices with an average proportion of Medicaid patients (44.6%; coded 0 on the x-axis of graph) compares with practices with 1 SD fewer Med-icaid patients (30.5%; coded 21 on x-axis of graph) and to practices with 1 SD more Medicaid patients (58.7%; coded 1 on x-axis of graph).
TABLE 2 Results From Regression and Cox Modeling Using the Percentage of Clinical Care Population Receiving Medicaid Assistance and Academic Affiliation to Predict Pediatrician-Delivered ADHD Care
ADHD Care Variable % Medicaid
b
Academic
b
Medicaid3 Academicb Use of a parent ADHD rating scale during assessment –0.001 –0.083 –0.003 Use of a teacher ADHD rating scale during assessment –0.004 0.229 0.007 DSM-IV ADHD criteria documented in chart 0.016 –0.886 –0.027 Evidence of medication treatment 0.005 –0.428 0.002 Evidence of psychosocial treatment 0.005 –0.267** –0.008* For those treated and withfirst contact, time tofirst contact after
starting treatmenta
0.000 –0.617*** 0.004
For those with parent ADHD rating scale ever, time since starting treatment to scale completiona
0.018* –0.599 –0.006
For those with teacher ADHD rating scale ever, time since starting treatment to scale completiona
0.011 0.078 0.000
responsibility for patient tracking (eg, using patient registries to track con-tacts, appointments, and rating scale collection), and possibly use innovative technologies to prompt and facilitate patient and family engagement.20Increased
incentives (eg, pay-for-performance) or system-level interventions at the com-munity or health plan may be necessary to promote adoption of these expensive and demanding initiatives.
We also examined practice/pediatrician characteristics (ie, percentage of Med-icaid patients, academic affiliation, and practice setting) to determine whether these characteristics explain variability in practice behaviors. Only a few practice/ pediatrician characteristics were asso-ciated with the quality of ADHD care. For example, consistent with other studies,10,21
Medicaid status was associated with longer times until the collection of par-ent ratings to monitor response. How-ever, for other indicators of ADHD care quality, Medicaid status was not associ-ated with worse ADHD care. Interestingly, increasing proportions of Medicaid patients were associated with higher rates of psychosocial treatment at non-academic practices, whereas higher rates of Medicaid patients led to lower rates of psychosocial treatment at aca-demic practices. Perhaps acaaca-demic pediatricians refer within their affiliated medical center, which may have long waits for psychosocial treatment and
these delays lead to lower rates of psy-chosocial treatment.
Practice setting also has been associated with quality of care in previous re-search.11,12,22,23 In particular, rural
set-tings typically offer a poorer quality of care than metropolitan settings.23In our
study, we found no negative effects of rural setting on ADHD care behaviors. We didfind that patients seen for ADHD by pediatricians in a suburban setting were less likely to be prescribed medication after an ADHD diagnosis compared with urban patients. Similarly, suburban pa-tients had lower rates of psychosocial treatment than urban or rural patients. One possible explanation is that there was reluctance or delays (either by pro-viders or families) in suburban settings toward beginning treatment or accepting the diagnosis. Alternatively, patients in urban settings may have presented with more severe symptoms requiring imme-diate initiation of treatment. The other geographic difference was a tendency for suburban practices to have shorter times to first contact after starting treatment compared with urban practi-ces. We surmise that this difference may have resulted from the higher rates of no-shows and overall patient volume of-ten associated with urban settings, which could have been obstacles to get-ting families to return for follow-up care.
This study’sfindings must be interpreted in light of several study limitations. First,
our chart review methodology did not include collection of personal patient data, such as age, gender, and comorbid conditions, from patient charts. Hence, the relation between patient-level data and quality of ADHD care could not be estimated. Parent preferences for ADHD care also were not collected, and thus the influence of parent preferences on patterns of ADHD care was not ac-counted for in the observed rates of ADHD care. Also, patient demographics were not collected and thus we relied on pediatrician-level self-report regarding patient demographics. It also is possible that chart reviews underestimated the amount of care provided.
All of the participating practices vol-unteered to participate in a quality im-provement intervention focusing on improving ADHD care and thus may differ from typical practices. Our sample was limited both geographically (ie, central-northern Ohio) and according to spe-cific practice characteristics (ie, practices with only 1 physician and/or access to an on-site mental health professional). Therefore, it is unclear whether our re-sults characterize practices outside the study region or to practice types not included in this study (eg, solo practices).
CONCLUSIONS
The results of this study suggest that current pediatrician-delivered ADHD care leaves much room for improvement. Only TABLE 3 Results From Regression and Cox Modeling Using Practice Location to Predict Pediatrician-Delivered ADHD Care
ADHD Care Variable Urban Versus Suburban
Urban Versus Rural
Suburban Versus Rural
Interpretation
Use of a parent ADHD rating scale during assessment –0.278 –0.345 –0.149 Use of a teacher ADHD rating scale during assessment –0.154 –0.062 –0.006 DSM-IV ADHD criteria documented in chart –0.026 –0.262 0.332
Medication treatment –0.288* –0.328 –0.123 Urban.Suburban Psychosocial treatment –0.431* –0.227 –0.405* Urban and Rural.Suburban For those treated and withfirst contact, time tofirst contact after
starting treatmenta
0.29*** 0.23 –0.07 Urban.Suburban
For those with parent ADHD rating scale ever, time since starting treatment to scale completiona
–0.22 –0.57 –0.35
For those with teacher ADHD rating scale ever, time since starting treatment to scale completiona
–0.56 –0.66 –0.10
*P,.05, ***P,.001. aCox model results.
ceived an evidence-based diagnosis using DSM criteria and standardized rating scales. The proportion of children re-ceiving psychosocial treatment was miniscule, even though combined treat-ment is the most effective treattreat-ment strategy forchildrenwith ADHD.24Moreover,
almost no ADHD care follows AAP ADHD consensus guideline recommendations for
Although guidelines are an important
first step, additional efforts, likely initi-ated or incentivized outside the practice, are required to improve the quality of care delivered in pediatric settings. Such efforts may take the form of quality improvement,8,25–27clinical decision
sup-port tools,28,29using pay-for-performance
incentives,30 and/or partnering with
the use of electronic health records (EHRs) and has set up incentives encouraging physicians to“meaningfully use”EHRs to improve care. Hence, one timely strategy for addressing some areas of ADHD care might be to use the EHR to prompt/remind the physician to complete ADHD care behaviors or to use Web portals29to aid
in collecting rating scales.
REFERENCES
1. Bernal P. Hidden morbidity in pediatric primary care.Pediatr Ann. 2003;32(6):413– 418, quiz 421–422
2. Zito JM, Safer DJ, dosReis S, Magder LS, Gardner JF, Zarin DA. Psychotherapeutic medication patterns for youths with attention-deficit/hyperactivity disorder.Arch Pediatr Adolesc Med. 1999;153(12):1257– 1263
3. Chan E, Hopkins MR, Perrin JM, Herrerias C, Homer CJ. Diagnostic practices for at-tention deficit hyperactivity disorder: a na-tional survey of primary care physicians.
Ambul Pediatr. 2005;5(4):201–208
4. Rushton JL, Fant KE, Clark SJ. Use of practice guidelines in the primary care of children with attention-deficit/hyperactivity disorder.Pediatrics. 2004;114(1). Available at: www.pediatrics.org/cgi/content/full/114/ 1/e23
5. Gardner W, Kelleher KJ, Pajer K, Campo JV. Follow-up care of children identified with ADHD by primary care clinicians: a pro-spective cohort study. J Pediatr. 2004;145 (6):767–771
6. Wolraich ML, Bard DE, Stein MT, Rushton JL, O’Connor KG. Pediatricians’ attitudes and practices on ADHD before and after the de-velopment of ADHD pediatric practice guide-lines.J Atten Disord. 2010;13(6):563–572
7. McElligott JT, Lemay JR, O’Brien ES, Roland VA, Basco WT Jr, Roberts JR. Practice pat-terns and guideline adherence in the man-agement of attention deficit/hyperactivity disorder. Clin Pediatr (Phila). 2014;53(10): 960–966
8. Epstein JN, Langberg JM, Lichtenstein PK, Kolb R, Altaye M, Simon JO. Use of an In-ternet portal to improve community-based pediatric ADHD care: a cluster randomized trial. Pediatrics. 2011;128(5). Available at:
www.pediatrics.org/cgi/content/full/128/5/ e1201
9. Gamm L, Castillo G, Pittman S. Access to quality health services in rural areas.Prim Care. 2010;1:45–75
10. Stevens J, Harman JS, Kelleher KJ. Race/ ethnicity and insurance status as factors associated with ADHD treatment patterns.
J Child Adolesc Psychopharmacol. 2005;15 (1):88–96
11. Rost K, Fortney J, Fischer E, Smith J. Use, quality, and outcomes of care for mental health: the rural perspective.Med Care Res Rev. 2002;59(3):231–265, discussion 266–271
12. Reschovsky JD, Staiti AB. Access and qual-ity: does rural America lag behind?Health Aff (Millwood). 2005;24(4):1128–1139
13. Bussing R, Zima BT, Gary FA, Garvan CW. Barriers to detection, help-seeking, and ser-vice use for children with ADHD symptoms.
J Behav Health Serv Res. 2003;30(2):176–189
14. Goldman LE, Vittinghoff E, Dudley RA. Quality of care in hospitals with a high percent of Medicaid patients. Med Care. 2007;45(6): 579–583
15. Thompson JW, Ryan KW, Pinidiya SD, Bost JE. Quality of care for children in com-mercial and Medicaid managed care.JAMA. 2003;290(11):1486–1493
16. American Academy of Pediatrics. Clinical practice guideline: diagnosis and evalua-tion of the child with attenevalua-tion-deficit/ hyperactivity disorder.Pediatrics. 2000;105 (5):1158–1170
17. American Academy of Pediatrics. Subcom-mittee on Attention-Deficit/Hyperactivity Disor-der and Committee on Quality Improvement. Clinical practice guideline: treatment of the school-aged child with attention-deficit/ hyperactivity disorder. Pediatrics. 2001;108 (4):1033–1044
18. American Academy of Pediatrics. Subcommit-tee on Attention-Deficit/Hyperactivity Disorder; Steering Committee on Quality Improvement and Management. ADHD: Clinical practice guideline for the diagnosis, evaluation, and treatment of attention-deficit/hyperactivity disorder in children and adolescents. Pedi-atrics. 2011;128(5):1007–1022
19. Kenward MG, Roger JH. Small sample in-ference for fixed effects from restricted maximum likelihood. Biometrics. 1997;53 (3):983–997
20. Epstein JN. How can the Internet help improve community-based pediatric ADHD care? Ex-pert Rev Neurother. 2012;12(5):501–503
21. Stevens J, Harman JS, Kelleher KJ. Ethnic and regional differences in primary care visits for attention-deficit hyperactivity disor-der.J Dev Behav Pediatr. 2004;25(5):318–325
22. Guevara JP, Feudtner C, Romer D, et al. Fragmented care for inner-city minority children with attention-deficit/hyperactivity disorder.Pediatrics. 2005;116(4). Available at: www.pediatrics.org/cgi/content/full/116/ 4/e512
23. Andrus MR, Kelley KW, Murphey LM, Herndon KC. A comparison of diabetes care in rural and urban medical clinics in Alabama.
J Community Health. 2004;29(1):29–44
24. The MTA Cooperative Group. Multimodal Treatment Study of Children with ADHD. A 14-month randomized clinical trial of treatment strategies for attention-deficit/ hyperactivity disorder.Arch Gen Psychiatry. 1999;56(12):1073–1086
26. Epstein JN, Langberg JM, Lichtenstein PK, Mainwaring BA, Luzader CP, Stark LJ. Community-wide intervention to improve the attention-deficit/hyperactivity disorder assess-ment and treatassess-ment practices of community physicians.Pediatrics. 2008;122(1):19–27
27. Polaha J, Cooper SL, Meadows T, Kratochvil CJ. The assessment of attention-deficit/ hyperactivity disorder in rural primary care: the portability of the American Academy of Pediatrics guidelines to the
“real world.”Pediatrics. 2005;115(2). Avail-able at: www.pediatrics.org/cgi/content/ full/115/2/e120
28. Carroll AE, Bauer NS, Dugan TM, Anand V, Saha C, Downs SM. Use of a computerized decision aid for ADHD diagnosis: a ran-domized controlled trial.Pediatrics. 2013; 132(3). Available at: www.pediatrics.org/ cgi/content/full/132/3/e623
29. Epstein JN, Langberg JM, Lichtenstein PK, Kolb R, Simon JO. The myADHDportal.com Improvement Program: an innovative quality improvement intervention for improving the quality of ADHD care among community-based pediatricians.
Clin Pract Pediatr Psychol. 2013;1(1):55– 67
30. Mandel KE. Aligning rewards with large-scale improvement.JAMA. 2010;303(7):663–664
31. Epstein JN, Rabiner D, Johnson DE, et al. Improving attention-deficit/hyperactivity dis-order treatment outcomes through use of a collaborative consultation treatment service by community-based pediatricians: a cluster randomized trial.Arch Pediatr Adolesc Med. 2007;161(9):835–840
32. Leslie LK, Weckerly J, Plemmons D, Landsverk J, Eastman S. Implementing the American Acad-emy of Pediatrics attention-deficit/hyperactivity disorder diagnostic guidelines in primary care settings.Pediatrics. 2004;114(1):129–140
AIRLINE ENTERTAINMENT:I was recently on a long airplaneflight and opted to check out the free programming available by scanning the channels on the 4 by 6-inch screen on the seat back in front of me. I could listen to several different music genres, but the quality was horrible–much worse than my smartphone. Several TV shows were available, but none that I wanted to watch, so I opted to watch a movie. While the movie was mostly as I remembered it, sections seemed missing and some of the content seemed quite different.
As reported on CNN (Travel: August 12, 2014), programming on commercial airliners is heavily censored. Specialized companies edit the content for airlines and can edit the content based on the region over which the airlineflies. Generally speaking, airlines tend to avoid movies about airline disasters, horror, and intense religious, sexual, or political issues. Airlines in the Middle East avoid sexual language, demonstration of bare skin, and any mention or evidence of pork products, but do show violent scenes. Europeans are much more tolerant of bare skin but dislike gore and violence. Most airlines also edit out plane crashes, logos of other airlines, and foul language. The goal is to provide content where most customers are reasonably happy and nobody is irate, because irate customers are costly. For example, a 2013flight from Denver to Baltimore was diverted because a family complained of inappropriate content being shown.
Showing in-flight entertainment is expensive, thanks to licensing fees and editing costs, as well as the equipment necessary to display the content. The equipment is also quite heavy, adding to the overall cost of aflight. Still, airline executives believe programming is essential on longflights and important for customer satisfaction. The good news is that while the edited programming is likely to be around for some time, the availability of in-flight Wi-Fi (and even on some airlines, high speed Wi-Fi) means that fewer airlines will need to provide content–passengers with Wi-Fi enabled devices will be able to watch whatever they prefer. As for me, until that time arrives, I plan on listening to music on my own device or reading a good book.
Noted by WVR, MD
DOI: 10.1542/peds.2014-1500 originally published online November 3, 2014;
2014;134;1136
Pediatrics
Peugh, William Gardner, Phil Lichtenstein and Joshua Langberg
Services
Updated Information &
http://pediatrics.aappublications.org/content/134/6/1136 including high resolution figures, can be found at:
References
http://pediatrics.aappublications.org/content/134/6/1136#BIBL This article cites 32 articles, 11 of which you can access for free at:
Subspecialty Collections
activity_disorder_adhd_sub
http://www.aappublications.org/cgi/collection/attention-deficit:hyper Attention-Deficit/Hyperactivity Disorder (ADHD)
al_issues_sub
http://www.aappublications.org/cgi/collection/development:behavior Developmental/Behavioral Pediatrics
following collection(s):
This article, along with others on similar topics, appears in the
Permissions & Licensing
http://www.aappublications.org/site/misc/Permissions.xhtml in its entirety can be found online at:
Information about reproducing this article in parts (figures, tables) or
Reprints
DOI: 10.1542/peds.2014-1500 originally published online November 3, 2014;
2014;134;1136
Pediatrics
Peugh, William Gardner, Phil Lichtenstein and Joshua Langberg
Jeffery N. Epstein, Kelly J. Kelleher, Rebecca Baum, William B. Brinkman, James
Variability in ADHD Care in Community-Based Pediatrics
http://pediatrics.aappublications.org/content/134/6/1136
located on the World Wide Web at:
The online version of this article, along with updated information and services, is
by the American Academy of Pediatrics. All rights reserved. Print ISSN: 1073-0397.