© Author(s) 2009. This work is distributed under the Creative Commons Attribution 3.0 License.
and Earth
System Sciences
The use of questionnaires for acquiring information on public
perception of natural hazards and risk mitigation –
a review of current knowledge and practice
D. K. Bird1,2
1Department of Environment and Geography, Macquarie University, North Ryde, Sydney, NSW 2109, Australia 2Department of Geography and Tourism, Faculty of Life and Environmental Sciences, Askja, University of Iceland, 101 Reykjavík, Iceland
Received: 28 February 2009 – Revised: 6 July 2009 – Accepted: 15 July 2009 – Published: 31 July 2009
Abstract. Questionnaires are popular and fundamental tools for acquiring information on public knowledge and percep-tion of natural hazards. Quespercep-tionnaires can provide valuable information to emergency management agencies for devel-oping risk management procedures. Although many natu-ral hazards researchers describe results generated from ques-tionnaires, few explain the techniques used for their devel-opment and implementation. Methodological detail should include, as a minimum, response format (open/closed ques-tions), mode of delivery, sampling technique, response rate and access to the questionnaire to allow reproduction of or comparison with similar studies. This article reviews current knowledge and practice for developing and implementing questionnaires. Key features include questionnaire design, delivery mode, sampling techniques and data analysis. In or-der to illustrate these aspects, a case study examines methods chosen for the development and implementation of question-naires used to obtain information on knowledge and percep-tion of volcanic hazards in a tourist region in southern Ice-land. Face-to-face interviews highlighted certain issues with respect to question structure and sequence. Recommenda-tions are made to overcome these problems before the ques-tionnaires are applied in future research projects. In conclu-sion, basic steps that should be disclosed in the literature are provided as a checklist to ensure that reliable, replicable and valid results are produced from questionnaire based hazard knowledge and risk perception research.
Correspondence to: D. K. Bird
1 Introduction
The questionnaire is a well established tool within social sci-ence research for acquiring information on participant so-cial characteristics, present and past behaviour, standards of behaviour or attitudes and their beliefs and reasons for ac-tion with respect to the topic under investigaac-tion (Bulmer, 2004). Within natural hazards research, the questionnaire is a popular and fundamental tool for acquiring information on knowledge and perception (Table 1). However, the question-naire has been relatively neglected in descriptions of social research methods (Bulmer, p. ix, 2004) – and natural hazard studies are no exception.
Research articles should contain sufficient methodological detail to allow reproduction of or comparison with similar studies. This is impossible to achieve if basic criteria are not disclosed in the article. In a review of methodological issues in research articles on risk perception, Hawkes and Rowe (2008) found that most studies using semi-structured questionnaires lacked specific information on question word-ing and phrasword-ing. Hawkes and Rowe (p. 637, 2008) ques-tioned: “Can we therefore be sure that differences identi-fied in risk perceptions are due to the differences between the people being questioned, or differences in the framing of the questions posed?” In order to overcome this problem, re-searchers should provide enough detail on important method-ological features such as response format (i.e. open or closed questioning), mode of delivery, sampling technique and re-sponse rate in peer reviewed research articles.
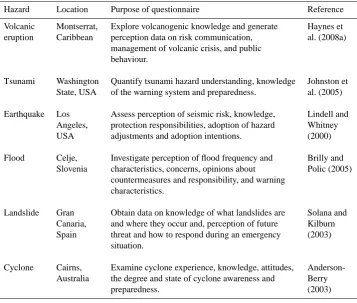
Table 1. Examples of the use of the questionnaire survey instrument as a fundamental tool within natural hazard research projects.
Hazard Location Purpose of questionnaire Reference
Volcanic Montserrat, Explore volcanogenic knowledge and generate Haynes et eruption Caribbean perception data on risk communication, al. (2008a)
management of volcanic crisis, and public behaviour.
Tsunami Washington Quantify tsunami hazard understanding, knowledge Johnston et State, USA of the warning system and preparedness. al. (2005)
Earthquake Los Assess perception of seismic risk, knowledge, Lindell and Angeles, protection responsibilities, adoption of hazard Whitney USA adjustments and adoption intentions. (2000)
Flood Celje, Investigate perception of flood frequency and Brilly and Slovenia characteristics, concerns, opinions about Polic (2005)
countermeasures and responsibility, and warning characteristics.
Landslide Gran Obtain data on knowledge of what landslides are Solana and Canaria, and where they occur and, perception of future Kilburn Spain threat and how to respond during an emergency (2003)
situation.
Cyclone Cairns, Examine cyclone experience, knowledge, attitudes, Anderson-Australia the degree and state of cyclone awareness and Berry
preparedness. (2003)
having a questionnaire is primarily to have all the data in more or less the same format, which means that all the ques-tions are asked of the whole population of observers in pre-cisely the same way. It makes the collected data comparable within the data set. . . as well as between different events (for which the same type of form was used)”. Furthermore, international scientific journals request that authors provide enough methodological detail to allow the work to be repro-duced (see Elsevier, 2009). Therefore, a copy of the ques-tionnaire should be provided within the text, as an appendix or available electronically (i.e. referenced in the article as available online or via email from the author).
An extensive review of 46 articles which describe re-sults generated from questionnaires related specifically to natural hazards revealed that very few explained the basic techniques employed for their development and implemen-tation (Table 2). The majority of these articles were sourced from keyword (i.e. questionnaire/survey and natural hazards) searches in relevant scientific literature databases (e.g. Else-vier, Science Direct) in addition to journal specific databases (e.g. Disasters, Natural Hazards and Earth System Sciences, Natural Hazards). References in these articles then provided access to additional sources. Articles that had not undergone peer review were excluded (Drabek, 1986). This included
articles that referenced an empirical study (e.g. a working paper or project report) for a more comprehensive descrip-tion of the methods applied. Other articles were excluded due to ambiguity within their description of methods.
Table 2. A review of 46 questionnaire based natural hazard research articles and the number of articles that provided: response format, delivery mode, sampling technique, response rate, the questionnaire and the total number of articles that include all 5 of these criteria (Akason et al., 2006; Anderson-Berry, 2003; Badri et al., 2006; Barberi et al., 2008; Bird and Dominey-Howes, 2006, 2008; Bruen et al., 2008; Carlino et al., 2008; Davis et al., 2005; Dolce and Ricciardi, 2007; Dominey-Howes and Minos-Minopoulos, 2004; Gaillard, 2008; Gaillard et al., 2008; Glatron and Beck, 2008; Gregg et al., 2004a, b, 2006, 2007; Grímsdóttir and McClung, 2006; Haynes et al., 2007, 2008a, b; Johnston and Benton, 1998; King et al., 2006; Kozak et al., 2007; Kreibich et al., 2005; Kurita et al., 2006; Lam et al., 2007; Leonard et al., 2008; Lindell and Whitney, 2000; Martin et al., 2007; McIvor and Paton, 2007; Meheux and Parker, 2006; Paton et al., 2001a, b, 2008a; Perry and Lindell, 2008; Raaijmakers et al., 2008; Rasid et al., 1996; Solana and Kilburn, 2003; Solana et al., 2008; Thieken et al., 2005, 2007; Tran et al., 2008; Xie et al., 2007; Zhai and Ikeda, 2008).
Year No. of Response Delivery Sampling Response Questionnaire All
papers format mode technique rate provided 5
1996 1 1 1 1 0 0 0
1998 1 1 0 0 0 0 0
2000 1 1 0 1 0 0 0
2001 2 1 0 0 2 1 0
2003 2 1 1 0 2 1 0
2004 3 1 0 0 2 1 0
2005 4 3 3 2 1 2 0
2006 7 5 5 2 1 2 0
2007 9 6 4 4 6 2 1
2008 16 10 12 7 9 6 3
TOTAL 46 30 26 17 23 15 4
% 65 57 37 50 33 9
reference the original source by stating “a more detailed de-scription of the whole questionnaire can be found in . . . ”. But frustratingly some of the original articles did not provide this “detailed description”. Instead, they refer the reader back to the other article thus creating a circular form of referencing lacking in valuable detail.
With growing concern about climate change and its po-tential effect on increasing natural hazard frequency and magnitude (IPCC, p. 110–111, 2007) the time has come to provide a clear template for questionnaire development and implementation for researchers investigating public knowl-edge and perception of, and response to, natural hazards. This is because the development of appropriate mitigation and adaptation strategies will not evolve from the physi-cal sciences alone but rather in combination with an un-derstanding of public knowledge and perception of hazard and risk (Anderson-Berry, 2003; Barberi et al., 2008; Bird and Dominey-Howes, 2006, 2008; Brilly and Polic, 2005; Dominey-Howes and Minos-Minopoulos, 2004; Gregg et al., 2007; Johnston et al., 2005; Lindell and Whitney, 2000; Solana and Kilburn, 2003) and behaviour when faced with hazards (Chester et al., 2008; Gaillard, 2008; Gaillard et al., 2008; Gregg et al., 2004b; Haynes et al., 2008a; Lavigne et al., 2008; McIvor and Paton, 2007; Paton et al., 2008b).
This article reviews current knowledge and practice for developing and implementing questionnaires. Following a brief discussion on approaches to social science research,
consideration is given to the key features in developing ques-tionnaires, choice of the most appropriate mode of delivery, employment of sampling techniques, data analysis and pi-loting the questionnaire. To illustrate these aspects, a case study examines methods chosen for the development and im-plementation of questionnaires for obtaining information on knowledge and perception of volcanic hazards in a tourist re-gion in southern Iceland. Key findings from this pilot inves-tigation are presented, followed by a review of the question-naire’s design and interview process, and concludes with rec-ommendations for future studies. Finally, a review of survey research on the human dimension of risk and related method-ological issues is presented.
2 Approaches to social science research
Table 3. A summary of quantitative, qualitative and mixed method approaches (after Creswell, p. 3–26, 2003).
Quantitative Qualitative Mixed Methods
Philosophical •Postpositive •Constructivist, •Pragmatic knowledge Assumptions knowledge claims advocacy or claims
participatory knowledge claims
Strategies of •Experimental designs •Narratives •Sequential Enquiry •Non-experimental •Phenomenology •Concurrent
designs e.g. surveys •Ethnographies •Transformative
•Grounded Theory
•Case Studies
Specific •Predetermined •Emerging methods •Both predetermined and Research •Closed, instrument •Open questions emerging methods Methods based questions •Interview, •Both open and closed
•Performance, attitude, observation, questions
observational and document, •Multiple forms of data census data audiovisual data drawing on all
•Statistical analysis •Text and image possibilities analysis •Statistical and text
analysis
Motivations •Test a theory or •Understand a •Generalise findings to a for selection explanation concept or population whilst
•Identify factors that phenomenon due to developing a detailed influence an outcome insufficient or new explanation of the
•Understand the best research concept or phenomenon predictors of an •Identify unknown
outcome variables
more representative of the population. Alternatively, con-current procedures combine qualitative and quantitative data collection in order to allow comprehensive analysis of the research question.
Regardless of whether researchers adopt a qualitative or quantitative approach, some aspects of each will be incorpo-rated into research design (Sarantakos, 2005). With respect to questionnaires, qualitative comments (e.g. generated from open-ended questions) can be used to corroborate, illustrate or elaborate on the meaning of quantitative responses (Baze-ley, 2006). The following section provides an overview of key features for the development and implementation of a questionnaire with reference to both qualitative and quantita-tive approaches.
3 Key features for developing and implementing a ques-tionnaire
3.1 Developing a questionnaire
Good questionnaire design is crucial (Bulmer, 2004; Creswell, 2003; de Vaus, 2002; McGuirk and O’Neill, 2005; Oppenheim, 1992; Parfitt, 2005; Patton, 1990; Sarantakos,
2005) in order to generate data conducive to the goals of the research. Questionnaire format, sequence and wording, the inclusion of classification, behavioural, knowledge and per-ception questions, and questionnaire length and output, need to be considered to ensure reliability, validity and sustained engagement of the participant.
The principal requirement of questionnaire format is that questions are sequenced in a logical order, allowing a smooth transition from one topic to the next (Sarantakos, 2005). This will ensure that participants understand the purpose of the re-search and they will carefully answer questions to the end of the survey (McGuirk and O’Neill, 2005). This can be accom-plished by grouping related questions under a short heading describing the section’s theme.
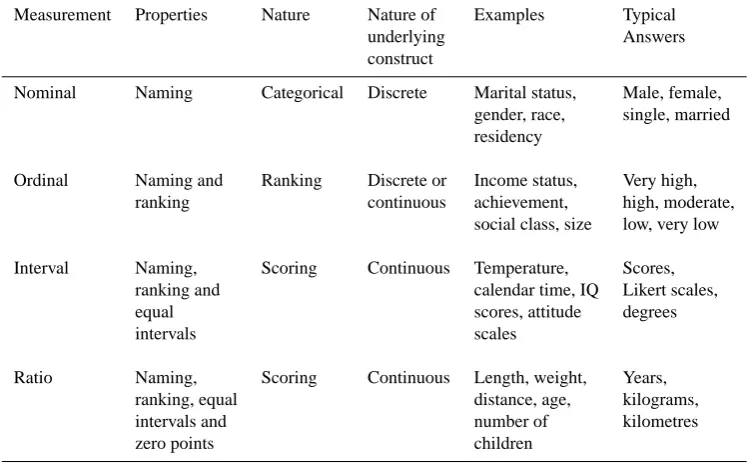
Table 4. Examples of various methods used to measure degrees of difference in closed questions (after Sarantakos, 2005; p. 78).
Measurement Properties Nature Nature of Examples Typical
underlying Answers
construct
Nominal Naming Categorical Discrete Marital status, Male, female, gender, race, single, married residency
Ordinal Naming and Ranking Discrete or Income status, Very high,
ranking continuous achievement, high, moderate,
social class, size low, very low
Interval Naming, Scoring Continuous Temperature, Scores,
ranking and calendar time, IQ Likert scales,
equal scores, attitude degrees
intervals scales
Ratio Naming, Scoring Continuous Length, weight, Years,
ranking, equal distance, age, kilograms,
intervals and number of kilometres
zero points children
Closed questions are easy to administer, easily coded and analysed, allow comparisons and quantification, and they are more likely to produce fully completed questionnaires while avoiding irrelevant responses (Sarantakos, 2005). Nomi-nal, ordiNomi-nal, interval and ratio levels are used to measure degrees of difference in closed questions (Table 4). How-ever, researchers must have a comprehensive understanding of the possible range of participant responses which makes the design of closed questions demanding (de Vaus, 2002). To minimise the effect of limiting participants to predefined answers the options “other, please specify” (McGuirk and O’Neill, 2005), “don’t know” or “not applicable” should be included where appropriate (Oppenheim, 1992). Clear in-structions should be given which describe how participants are expected to answer closed questions e.g. please choose
only one response from the list provided.
Advantages for open-ended questioning include freedom and spontaneity of answers, opportunity to probe and use-fulness for testing hypotheses about ideas or awareness (Op-penheim, 1992). Open questions allow time and space for free-form responses which invite participants to share their understandings, experiences, opinions and interpretations of, as well as their reactions to, social processes and situations (McGuirk and O’Neill, 2005). However, given that a large variety of answers may be provided for any one question, analysis of the results can be challenging. With this in mind, open questions can be asked in a style that directs participants into definite channels without actually suggesting responses (Payne, 1951) e.g. how many people are there in your family
living at this address?
Overall, a combination of closed and open questions pro-vides the survey write-up with quantifiable and in-depth re-sults. Closed questions produce results that are easily sum-marised and clearly presented in quick-look summaries while open questions produce verbatim comments adding depth and meaning.
Next to consider is the type of questions to include. Five basic types of questions are classification, behavioural, knowledge, perception and feelings (Table 5). Classification questions related to age, education, occupation and place of residence help place participants in relation to others (Pat-ton, 1990) as well as providing information that may predict the main effects (Parfitt, 2005) revealed from behavioural, knowledge, perception or feeling questions.
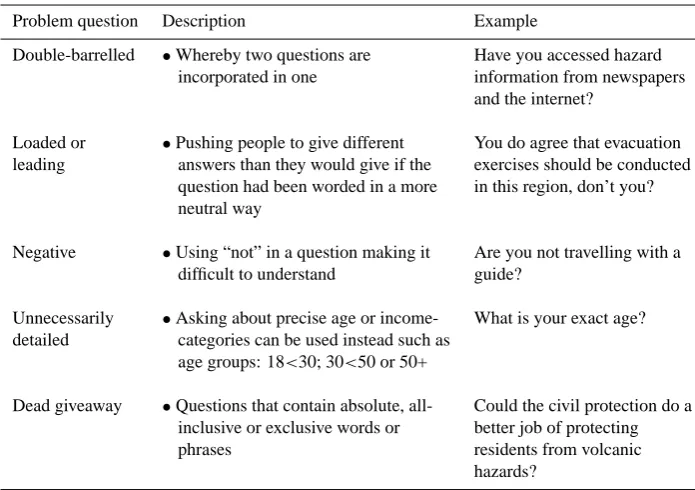
To produce reliable and valid results, the wording of each question should be precise and unambiguous to ensure that each participant can interpret its meaning easily and accu-rately (Payne, 1951). Reliability refers to the consistency of a question; that is, the probability of obtaining the same re-sults if the question is duplicated. Validity refers to whether or not the question measures what it was intended to (Op-penheim, 1992). To achieve reliability and validity, ques-tions should be short, simple and in line with the targeted population’s vernacular and avoid problems such as double-barrelled questions (Table 6).
Table 5. Five basic types of questions that can be asked of a participant (after Patton, p. 290–293, 1990).
Question type Description Example
Classification •Aims to identify the What is your occupation? characteristics of the person
being interviewed
Behavioural •Aims to discover what a person What would you do if an does or has done evacuation warning is issued?
Knowledge •Aims to determine what factual Have you heard of the Katla information a person has about a volcano?
certain subject
Perception •Aims to understand the cognitive Do you think this region could and interpretive processes of be affected by a volcanic
people eruption?
Feeling •Aims to explore the emotional How did you feel about leaving responses of people to their your animals during an experiences and thoughts evacuation?
Table 6. Common problems associated with question wording (de Vaus, 2002, p. 97-99, Payne, 1951).
Problem question Description Example
Double-barrelled •Whereby two questions are Have you accessed hazard incorporated in one information from newspapers
and the internet?
Loaded or •Pushing people to give different You do agree that evacuation leading answers than they would give if the exercises should be conducted
question had been worded in a more in this region, don’t you? neutral way
Negative •Using “not” in a question making it Are you not travelling with a difficult to understand guide?
Unnecessarily •Asking about precise age or income- What is your exact age? detailed categories can be used instead such as
age groups: 18<30; 30<50 or 50+
Dead giveaway •Questions that contain absolute, all- Could the civil protection do a inclusive or exclusive words or better job of protecting
phrases residents from volcanic
hazards?
2005). Questionnaires should take no longer to complete than participants are willing to spend time answering and the interviewer is able to commit (including the time commit-ment of data entry and analysis).
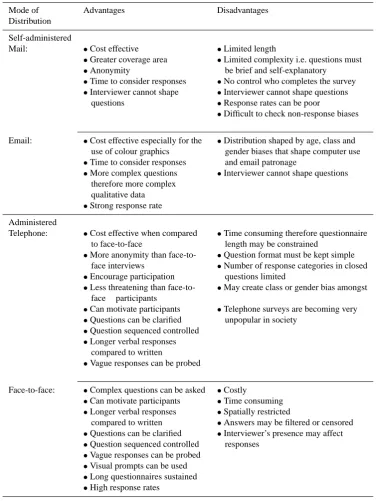
Table 7. Advantages and disadvantages of the more common modes of questionnaire distribution within a quantitative framework (after Bird and Dominey-Howes, 2008 and references therein).
Mode of Advantages Disadvantages
Distribution
Self-administered
Mail: •Cost effective •Limited length
•Greater coverage area •Limited complexity i.e. questions must
•Anonymity be brief and self-explanatory
•Time to consider responses •No control who completes the survey
•Interviewer cannot shape •Interviewer cannot shape questions questions •Response rates can be poor
•Difficult to check non-response biases
Email: •Cost effective especially for the •Distribution shaped by age, class and use of colour graphics gender biases that shape computer use
•Time to consider responses and email patronage
•More complex questions •Interviewer cannot shape questions therefore more complex
qualitative data
•Strong response rate Administered
Telephone: •Cost effective when compared •Time consuming therefore questionnaire to face-to-face length may be constrained
•More anonymity than face-to- •Question format must be kept simple face interviews •Number of response categories in closed
•Encourage participation questions limited
•Less threatening than face-to- •May create class or gender bias amongst face participants
•Can motivate participants •Telephone surveys are becoming very
•Questions can be clarified unpopular in society
•Question sequenced controlled
•Longer verbal responses compared to written
•Vague responses can be probed
Face-to-face: •Complex questions can be asked •Costly
•Can motivate participants •Time consuming
•Longer verbal responses •Spatially restricted
compared to written •Answers may be filtered or censored
•Questions can be clarified •Interviewer’s presence may affect
•Question sequenced controlled responses
•Vague responses can be probed
•Visual prompts can be used
•Long questionnaires sustained
•High response rates
Initial contact in the form of a cover letter, telephone call or direct approach is the first step to building rapport and motivating participation for any mode of distribution. Dur-ing first contact, researchers should introduce themselves and their credentials, explain the study and why it is being con-ducted, reveal why the person was selected for the study, in-dicate how long the questionnaire will take to complete and
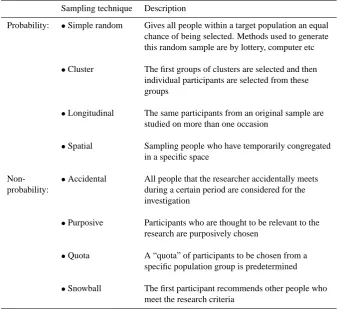
Table 8. A brief summary of probability and non-probability sampling methods available to the natural hazards researcher (after Sarantakos, 2005; p. 154–166).
Sampling technique Description
Probability: •Simple random Gives all people within a target population an equal chance of being selected. Methods used to generate this random sample are by lottery, computer etc
•Cluster The first groups of clusters are selected and then individual participants are selected from these groups
•Longitudinal The same participants from an original sample are studied on more than one occasion
•Spatial Sampling people who have temporarily congregated in a specific space
Non- •Accidental All people that the researcher accidentally meets probability: during a certain period are considered for the
investigation
•Purposive Participants who are thought to be relevant to the research are purposively chosen
•Quota A “quota” of participants to be chosen from a specific population group is predetermined
•Snowball The first participant recommends other people who meet the research criteria
Self-administered questionnaires may contain a further in-troductory paragraph to help set the scene and guide partici-pants towards answering instructions and definitions (Oppen-heim, 1992). Not only do these directions clarify questions and procedures but they also serve to maintain motivation. Questionnaire format and graphic layout is especially signif-icant with self-administered modes as it helps promote re-sponse rates (Sarantakos, 2005). Eliciting reliable and valid data relies on developing an attractive and professional de-sign. Self-administered questionnaires may also be delivered to participants by someone in an official position. The ques-tionnaire is then left for the participant to complete at their own leisure.
Questionnaires developed for telephone or face-to-face de-livery should contain instructions for participants as well as researchers administering the survey (Oppenheim, 1992). In-terviewers should be trained to conduct and deliver the ques-tionnaire to ensure that differences between participant re-sponses is a reflection of their knowledge or perception and not on how the data were collected (Collins, 2003). The in-terviewer should not be in a position to make judgements, include subjective views or personal bias and convictions (Sarantakos, 2005).
To ensure a high rate of participation with an administered questionnaire researchers should consider approach, expla-nation, respect, trust and friendliness. Sarantakos (p. 288, 2005) provides a list of issues that may be employed to im-prove interview response rates. More insightful and valid data will generally be gained from telephone and face-to-face interviews when both the interviewer and participant feel at ease and when the interviewer adopts an active role rather than just asking a list of predetermined questions (Dunn, 2005). Administered questionnaires may also be de-livered to groups of participants assembled together (e.g. fo-cus groups).
3.3 Employing sampling techniques
(de Vaus, 2002). However, not all samples are representative. Some studies need to be conducted on populations whose demographic characteristics are unknown. Non-probability sampling does not allow researchers to make statistical gen-eralisations but it is commonly used when the selection of participants is based on a known common characteris-tic (McGuirk and O’Neill, 2005; Patton, 1990) but popu-lation demographics are unknown. Probability sampling is typically associated with quantitative research while non-probability sampling is associated with qualitative research. However, both forms of sampling can be either quantitative or qualitative and the use of both is common in mixed meth-ods research (Kemper et al., 2003).
The main factors to consider when determining sample size are:
– degree of accuracy (in relation to sampling error and confidence interval) and
– the extent of variation in the population in regard to the key characteristic of the study (de Vaus, 2002). Sampling error reflects the extent to which the sample differs from the population while confidence level indicates the like-lihood of the population parameter lying within the specified range. Statistical tables are used to determine sampling er-ror associated with various sample sizes (e.g. de Vaus, p. 81, 2002). However, these assume that an up-to-date and ac-curate sampling frame (a list containing all members of the target population) was used, the sampling was faultless, bi-ases have been compensated for, field work was precise and that there is no non-response error (Oppenheim, 1992). In summary, the size of a sample will depend upon theoretical requirements (e.g. sampling error, cluster size, required ac-curacy of population estimates), precision of the sampling operation, number of sub-group comparisons, nature of the dependent variable and temporal and financial constraints. Statistical assumptions about sampling errors do not apply to non-probability sampling (Oppenheim, 1992).
3.4 Analysing data
Before data analysis, researchers should address non-response error and missing data. Low non-response rates can be overcome by sending out more questionnaires, careful training of interviewers, use of interpreters and conducting call backs at different times of the day and week. However, these do not overcome the problem of non-response bias. Of-ten non-respondents are characteristically different from re-sponders. To reduce the effect of non-response bias on the analysis, statistical techniques such as statistical weighting and multivariate analysis can be applied (see Oppenheim, p. 106–107, 1992). Alternatively, de Vaus (p. 84, 2002) sug-gests obtaining information about the non-respondents, us-ing available observational data, gatherus-ing information from the sampling frame or exploring known characteristics of the
population, in order to neutralise the effect of non-response bias during the analysis.
Missing data may be enclosed within an otherwise com-plete individual record. Techniques such as listwise (deletion of all data for an entire case that has missing entries) and pair-wise deletion (partial deletion of a case for only the missing entries) can be employed to deal with missing data (Oppen-heim, 1992). However, before undertaking such methods, researchers should consider missing data bias (i.e. if partic-ipant characteristics are different between complete datasets and incomplete ones (de Vaus, 2002)).
Raw data from open and closed questions should be con-verted into numbers for data entry. Questionnaires may be pre-coded, field coded (coded on the spot by the interviewer) or office coded after the questionnaire has been completed. Coding complex open questions for quantitative analysis in-volves developing categories and assigning corresponding la-bels and values to each question (Sarantakos, 2005). A code book with coding instructions should be compiled regardless of whether data entry rests with one or several persons. Gen-eral principles to incorporate within the instructions include how to deal with queries, a description of the case numbering system and the method for coding multiple-response ques-tions, to ensure that the data are entered accurately by all re-searchers (Oppenheim, 1992). Continuous checks and cross-checks are a critical part of data preparation and quality as-surance protocols, in order to certify that “interesting” find-ings are not simply due to mistakes in data entry. Common practices such as running frequency distributions on the main variables, range checks for each variable and internal con-sistency checks help identify inconsistencies within datasets (Oppenheim, 1992).
Once the data have been checked, edited, coded and en-tered, analysis can begin. Data analysis can be undertaken manually or electronically. The latter, known as computer assisted data analysis (CADA) is most commonly used. The most popular program, offering a powerful, fast and reliable statistical analysis for quantitative data, is SPSS® (Statis-tical Package for the Social Sciences) (Sarantakos, 2007).
SPSS® can provide a general and descriptive overview of
data through “frequency tables” and “crosstabs” while cor-relation tests assess associations between variables and tests of significance assess whether or not results from the sample can be applied to the population.
Fig. 1. The tourist destination of Þórsmórk to the west of Mýrdalsjökull in southern Iceland. Highlighted on the map are the western jökulhlaup hazard zone, an outline of the Katla caldera and the three regional evacuation centres in the towns of Hella, Hvolsvöllur and Skógar. One four-wheel-drive road, crossing 10 glacial rivers and tributaries, gives tourists’ access to Þórsmórk. Rather than crossing these fast flowing channels, tourists will be instructed to stay in Þórsmórk during a volcanic crisis. They will not be advised to evacuate to the designated centres.
in quantitative analyses (Sarantakos, 2005). For example, the program NVivo® allows researchers to undertake projects ranging from fine, deeply reflective analysis to analytical pro-cessing of large volumes of data (Bazeley, 2007). Within
NVivo® researchers can manage data and ideas, perform
sim-ple or comsim-plex queries and model ideas or concepts graphi-cally.
Analysing datasets from a mixed methods approach to identify apparent themes is referred to as triangulation. This encompasses integrating qualitative and quantitative datasets, comparing multiple qualitative datasets and, mul-tiple perspectives from mulmul-tiple observers. Triangulation helps overcome the intrinsic bias that is inherent within single-method, single-observer and single-theory studies and as such, offers greater validity (Denzin, 2006). Bry-man (2006) advocated the combination of quantitative and qualitative research with the argument that despite the appar-ent problems and concerns of triangulation the advantages are overwhelming. However, Blaikie (2006) concludes that the use of methods drawn from different methodological per-spectives is not legitimate within the same study unless they are used sequentially. Similarly, Hemming (2008) prefers to combine qualitative datasets through “crystallisation” in order to build a more holistic picture of the issue under in-vestigation rather than simply duplicating results to improve validity.
3.5 Piloting the questionnaire
Before embarking on the main study, the questionnaire should be piloted to test its usefulness in providing valu-able information that might be relevant to emergency
management personnel for the development of risk mitiga-tion and adaptamitiga-tion strategies (Bird and Dominey-Howes, 2008). The pilot phase is also practical for detecting ma-jor defects in questionnaire design. Pilot work can be costly but it will avoid a great deal of wasted effort on unintelligi-ble questions producing unquantifiaunintelligi-ble responses and unin-terpretable results (Oppenheim, 1992).
The next section describes a case study whereby question-naires were developed and piloted in southern Iceland – with specific reference to volcanic hazards.
4 Case Study: Hazard perception in Þórsmörk, a pop-ular tourist destination in southern Iceland
4.1 Rationale
While there is abundant literature on the physical attributes of Icelandic jökulhlaup (e.g. Björnsson et al., 2000; Carriv-ick, 2007; Eliasson et al., 2006; Guðmundsson et al., 2005; Larsen, 2000, 2002; Roberts, 2005; Rushmer, 2007; Rus-sell et al., 2006; Smith, 2004; Smith and Haraldsson, 2005) little research exists on the social aspects of jökulhlaup haz-ards and none exists for the tourist region of Þórsmörk. To bridge this gap in understanding, questionnaires were de-veloped and piloted with tourists and tourism employees in Þórsmörk. The aims of this pilot investigation are to: (1) report on the methods chosen for the development and im-plementation of the questionnaires, (2) briefly summarise the key findings, and (3) review the questionnaire design and in-terview process making recommendations to improve these in future studies.
4.2 Methods chosen for the development and implemen-tation of the questionnaires
Survey design and format was based on a questionnaire de-veloped and tested by Bird and Dominey-Howes (2008). However, some questions were added while others were ad-justed or removed from the original questionnaire in order to suit the regional setting and hazards. The purpose of devel-oping and implementing the questionnaire was to generate data that may be useful to emergency management agencies (particularly the Icelandic Civil Protection (ICP)) for devel-oping risk mitigation strategies around Katla. To identify insights and differences in perceptions between stakeholder groups, distinct questionnaires were drafted for tourists and tourism employees. The proposed contents were discussed with key emergency management personnel from the ICP, Iceland Search and Rescue (ICE-SAR) and local police prior to this pilot investigation and minor adjustments were made according to their comments and views.
To produce quantifiable and in-depth results that will be meaningful to emergency management agencies, open and closed questions were incorporated in the design. Check-box answers were provided for certain closed questions with the option “other, please specify” so as not to limit participant responses to pre-defined answers. To gain an in-depth un-derstanding of knowledge and motivations participants were asked “why”, or “if yes/no, can you tell me/can you de-scribe. . . ” following certain closed questions. Where ap-plicable, open questions were used to avoid leading partic-ipants into pre-defined answers and to gather more detailed responses. A large variety of nationalities were expected in this region, so where possible diction was kept simple with-out the use of academic jargon or complicated expressions.
Demographic data such as participant age and level of ed-ucation were gathered in the first section of each question-naire. Country of residency was included since the survey was aimed at both local and international tourists and tourism employees. A series of questions were integrated for both groups to assess participant’s self protective behaviour, their
knowledge and awareness of Katla and jökulhlaup hazards, perception of jökulhlaup hazards in the Markarfljót region and knowledge and perception of evacuation procedures. To be counted as correct, responses had to include the approx-imate recurrence interval of Katla eruptions and the year of the last eruption. Their definition of jökulhlaup was counted as correct if participants mentioned something about flood water from a glacier. Additional questions were incorporated for the tourist group to gather information on their length of stay and purpose for visiting Þórsmörk. Extra questions in the tourism employee’s group collected data on company training, group characteristics and guiding techniques. Elec-tronic copies of both questionnaires are available from the author.
Due to the length of the questionnaire and the nature of the open/closed questioning face-to-face delivery was con-sidered most appropriate. Administering the questionnaires face-to-face prevented participants from taking time to re-search “correct” answers (since information on how partici-pants would respond in a sudden emergency situation should be generated from this type of survey) and it allowed the in-terviewer to be more actively involved in data collection.
All participants were selected through a non-probability purposive sampling technique where potential participants working or staying in the Þórsmörk region were approached directly. These people were selected as it was expected that they had an interest in the region or hazard. Within the con-text of this investigation people located within the remote re-gion of Þórsmörk who could possibly be one of first groups affected by a Katla eruption were targeted.
Due to the lack of demographic data on Þórsmörk tourists it is impossible to determine whether or not this small sam-ple size is representative of the broader population. All hut wardens located in Þórsmörk were approached during this investigation and a response rate of 89% was achieved. An 80% response rate was recorded for the tourist group. Both these figures are high and may be due to the nature of this pilot investigation and the purposive sampling technique.
To determine a questionnaire’s usefulness and suitability a pilot investigation should be conducted with approximately 20 participants (Parfitt, 2005). Twenty-four participants in the tourist group and 16 participants in the tourism employ-ees group were recruited for this investigation. Before con-ducting the questionnaire, participants were required to read a letter which explained the questionnaire’s purpose and con-tent, that they could withdraw from the survey at any time without consequence and that no participant would be iden-tifiable through publication of the results. Their approval of these conditions and consent to conduct the interview was indicated by their signature on this letter.
Table 9. A summary of key characteristics and specific survey questions for the tourist group. All data are given as a percentage. Some sections do not equal 100% due to rounding.
Age
18–30 years old 31–50 years old 51+ years old
42 42 17
What is the highest level of education you have completed?
Up to high school University degree Other
25 63 13
Question Response=Yes
Are you travelling with a guide while in this region? 25
Are friends/family (or anyone else) aware of your exact location
while you are travelling in this region? 83
Do you have your GSM (mobile phone) with you while travelling in
this region? 75
Do you carry a satellite phone or another form of communication
device with you when travelling in this 4
Have you followed discussions in the media about natural hazards
connected to a Katla eruption? 25
Do you know that Iceland is a volcanically active island? 100
Have you heard of Katla? 42
Have you heard of the Icelandic term jökulhlaup? 50
Do you know whether a jökulhlaup warning system exists for the
Markarfljót region? 21
September 2006. This time period was chosen as it falls within the tourist high season and therefore, a broad cross-section of nationalities could be sampled.
4.3 Key findings from the questionnaires
Data entry and analysis was carried out using SPSS® 15.0. Due to the nature of this pilot study only a brief summary of key findings will be given. It is unclear whether or not these results represent the broader tourist sector. However, they provide baseline data against which future research can be assessed. Questions listed in each result table are writ-ten exactly as in their corresponding questionnaire. Results from tourist questionnaires are in Table 9. This includes participant responses to two classification questions in addi-tion to various behavioural, knowledge and percepaddi-tion ques-tions. Results from tourism employee questionnaires are in Table 10. This includes participant responses to two clas-sification questions in addition to company information and various behavioural, knowledge and perception questions.
4.4 Review of questionnaire design and the interview process and recommendations for improvement Administering the questionnaires via face-to-face delivery, researchers could determine whether or not participants were comfortable with the sequence and structure of questions, questionnaire length and determine if there were any other defects with its design. In general, questions were se-quenced in a logical order. However, in the tourist group questionnaire, questions relating to media discussions on Katla should be placed after the question “have you heard of Katla”. If the participant answers “yes”, then it is appro-priate to ask them if they have followed media discussions about Katla. If they state “no”, then these questions can be skipped.
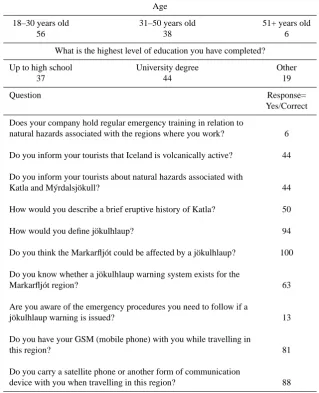
Table 10. A summary of key characteristics and specific survey questions for the tourism employees group. All data are given as a percentage.
Age
18–30 years old 31–50 years old 51+ years old
56 38 6
What is the highest level of education you have completed?
Up to high school University degree Other
37 44 19
Question Response=
Yes/Correct
Does your company hold regular emergency training in relation to
natural hazards associated with the regions where you work? 6
Do you inform your tourists that Iceland is volcanically active? 44
Do you inform your tourists about natural hazards associated with
Katla and Mýrdalsjökull? 44
How would you describe a brief eruptive history of Katla? 50
How would you define jökulhlaup? 94
Do you think the Markarfljót could be affected by a jökulhlaup? 100
Do you know whether a jökulhlaup warning system exists for the
Markarfljót region? 63
Are you aware of the emergency procedures you need to follow if a
jökulhlaup warning is issued? 13
Do you have your GSM (mobile phone) with you while travelling in
this region? 81
Do you carry a satellite phone or another form of communication
device with you when travelling in this region? 88
add words in order to make an answerable question and this is not desirable since the object is to have all participants an-swering the same questions (Fowler, 2002). Problems arose with the structuring of one particular question. The ques-tion “Do you know whether a jökulhlaup warning system ex-ists for the Markarfljót region?” was confusing for partici-pants. This question should be rewritten as “Does a jökulh-laup warning system exist for the Markarfljót region?” so participants have the opportunity to state “yes” one does ex-ist or “no” one does not exex-ist or simply “do not know”.
Overall, the questionnaire took approximately 30 min to complete which was acceptable to the participants. However, some participants took the opportunity to spend more or less time as required. No major defects in questionnaire design were apparent during this pilot investigation.
Considering that participants within the tourist group came from such varied cultural, ethnical, educational and gener-ational backgrounds it is recommended that future surveys use face-to-face delivery. If the questionnaire is adminis-tered only in English then future research should consider non-response bias of non-English speakers. Furthermore, the interviewer needs to ensure that all participants whose first language is not English understand each question as it is in-tended. It is suggested that future studies consider provid-ing the questionnaire in various languages in order to ensure reliability and validity. However, if a multilingual question-naire is administered then recruitment of qualified interview-ers is essential with appropriate training to reduce bias and error-producing factors, and to encourage accuracy, clarity and inter-interviewer consistency (Sarantakos, 2005).
The purposive sampling technique was considered appro-priate for this type of research. However, when considering the temporal distribution of Icelandic tourists in Þórsmörk it would be more representative to conduct interviews through-out the whole year as many visit Þórsmörk during winter. Due to the vast and rugged landscape, targeting potential par-ticipants when they were located within the mountain huts was deemed the most logical method for recruitment. If fu-ture studies adopt this technique it is advisable to increase the sample size to reduce the effect of over-relying on accessible participants and thereby ensuring a reasonably representative sample (Sarantakos, 2005).
Questionnaires were office coded and data entry and anal-ysis was carried out using SPSS® and Microsoft Word®. Categories were developed for various open answer ques-tions to enable analysis in SPSS®. Due to the small sample size the analysis of the verbatim record was sufficient in
Mi-crosoft Word®. However, if a larger sample size is obtained
and qualitative analysis is required then the use of a program such as NVivo® is suggested.
A simple questionnaire, involving a small sample size pur-posively selected from the population was used in this pilot investigation. This simple questionnaire was used for two main reasons: (1) to provide a working example of the ba-sic techniques employed for developing and implementing a questionnaire and (2) to create a benchmark for future stud-ies on knowledge and perception of Katla in Þórsmörk since this research is the first of its kind to assess volcanic risk and tourism in southern Iceland. Future studies, which incorpo-rate the suggested improvements to the questionnaire, should encapsulate a more rigorous quantitative design with a larger sample size to produce statistically reliable results that are representative of the tourist sector.
While a simple questionnaire was used in this pilot in-vestigation due to the abovementioned reasons, more com-prehensive instruments have been designed based on various theoretical frameworks developed in relation to risk percep-tion and disaster research. The following secpercep-tion provides a brief review of the prominent research in the realm of risk
perception and discusses related methodological issues with emphasis on the use of the questionnaire.
5 Research on the human dimension of risk and methodological issues
G. F. White’s (1945) ground-breaking work on human ad-justments to floods pioneered the way for research on the hu-man dimension of risk in multi-hazard environments. Nearly three decades later, Kates (1971) described human behaviour as a key component of the present state of natural hazards research within the international community. Kates (1971) illustrated that the choices made by individuals who occupy hazardous areas are related to their perception, awareness and evaluation of the hazard.
Douglas and Wildavsky’s (1982) view that risk percep-tion and risk-related behaviour is primarily a socio-cultural phenomenon has influenced the way in which questions are asked of participants in survey research. Other re-searchers (e.g. Slovic, 2000b) have employed the psychome-tric paradigm. This approach to risk perception research ap-plies “psychophysical scaling and multivariate analysis tech-niques to produce quantitative representations or “cognitive maps” of risk attitudes and perceptions” (Slovic, p. 222, 2000a). However, the disparity between the public’s over-reaction to officially designated minimal risks and their under-reaction to adopt preparedness measures despite gov-ernment warnings, led to the development of the social am-plification of risk framework (SARF) (Horlick-Jones et al., 2003).
Introduced in 1988, SARF was developed in an attempt to overcome the fragmented nature of risk perception and risk communication research (Kasperson et al., 2003). To achieve this, an integrative theoretical framework was estab-lished to deal with results produced from media research, from the psychometric and cultural schools of risk percep-tion research and, from studies of organisapercep-tional response to risk. In essence, within the SARF framework, risk experi-ence not only relates to the physical experiexperi-ence of harm but also to the result of processes by which groups and individu-als learn to acquire or create interpretations of risk, whether they be attenuated or amplified (Kasperson et al., 2003).
Regardless of framework, methodological issues in rela-tion to quesrela-tionnaire development and implementarela-tion will occur. After reviewing a multitude of published research on the human dimension of disasters, Drabek (1986) stressed that methodological issues in relation to survey research (e.g. design flaws, inadequate sampling and poor measure-ment) must be overcome.
Practical, well developed methods of attitude measure-ment and psychological scaling should be applied in risk per-ception studies (Sjöberg, 2000). Asserting that it is not dif-ficult to measure beliefs and attitudes about risk perception, Sjöberg (p. 409, 2000) stated: “People can be asked to make ratings of size of perceived risk on a scale, say from 0 (no risk) through a number of defined categories to a maximum risk, perhaps defined as “an extremely large risk”. Such rat-ings have been found to be quite useful.”
With respect to design flaws, the careful refinement of questions is an essential part of the research journey when moving from a set of hypotheses to a theory of hazard be-haviour (Kates, 1971). This is because different results are generated when question wording differs from one instru-ment to the next, and often in interpretation (Drabek, 1986).
The conceptual clarification of highly significant indepen-dent variables is also essential for homogenous interpretation of questions. For example, Mileti et al. (1975) questioned if “hazard experience” included false warnings or, direct ob-servation and in-depth discussion of a hazardous event that occurred in a neighbouring community.
Broadening the scope of research on hazard experience, both Bourque et al. (1997) and King (2002) discussed the range of issues encountered in post-disaster research. While King’s disaster research was based on rapid response stud-ies (i.e. producing results a maximum of a few months af-ter the event), Bourque et al.’s research was conducted be-tween 217 and 712 days following various natural hazard events. Standardised questions are prominent within each study (e.g. questions concerning warnings), but additional, location specific questions are include to generate informa-tion on severity, timing, locainforma-tion of the event and regional issues (King, 2002).
Based on a review of 130 post-disaster studies, King (2002) concluded that longitudinal community surveys were the most constructive as they were able to produce a measurement of change in hazard awareness and prepared-ness over time, and in response to subsequent hazard experi-ence. In order to record this change, the same questionnaire must be used, with only minor modifications.
Bourque et al. (1997) used the replication of common questions, asked in identical or highly comparable ways, in six different questionnaires to examine how residents do or do not differ between geographic areas, time and hazard events. Furthering this analysis, they were able to ascertain the extent to which memory decay or enhancement occurs across time following an event.
When individuals are asked to self-report or self-assess their level of actual hazard awareness, experience and pre-paredness problems can occur. This is due to the facts that individuals may lack the ability to quantify their ac-tual knowledge or may not be at ease in providing a truth-ful response (Enders, 2001). Further, participants may in-stinctively respond yes/no without consideration or may as-sess their own knowledge or behaviour on a level different to that perceived by emergency management agencies (Enders, 2001). In order to measure actual awareness, experience and preparedness, participants should be asked to describe what they know or what actual preparedness strategies they have adopted.
King (2002) revealed that most post-disaster surveys con-sist of relatively short questionnaires administered either face-to-face or by telephone. Bourque et al. (1997) advocated the use of telephone interviewing. Although Sjöberg (2000) addressed the problem of interviewer bias, he highlighted that it is predominantly related to unstructured interviews and that interviewers conducting face-to-face or telephone inter-views using a structured questionnaire have a relatively mi-nor impact.
Despite the benefits of using structured questionnaires as a tool for generating information on the social aspects of natural hazards, research (e.g. Haynes et al., 2008a; John-ston et al., 2005) has shown that in order to capture the true complexity of a hazard in a societal context mixed method-ologies which employ both qualitative and quantitative tech-niques should be applied. In relation to hazards research, Rohrmann (1998) notes that quantitative and qualitative ap-proaches generate different results and as such are comple-mentary. King (2002) reports that the questionnaire is often supported by other forms of data collection such as inter-views, observations and secondary data sources (government reports, emergency management records, census databases etc).
6 Conclusions
Despite popular use of questionnaires for acquiring social data in relation to natural hazards, the techniques employed for their development and implementation have been a rela-tively neglected topic within published research articles deal-ing with hazards, risk and disaster. In line with Hawkes and Rowe’s (p. 630, 2008) findings, “future studies ought to be more comprehensive in the descriptions of their methods”. In order to rectify this situation, this article offers a template for researchers responsible for conducting social investigations in natural hazards research. It is not the purpose of this arti-cle to provide another best practice questionnaire or review previous instruments in terms of whether or not they can be classed as best practice. However, this article highlights the basic techniques used in developing and implementing ques-tionnaires and it emphasises the need for researchers to pro-vide enough detail on these important methodological fea-tures. To achieve this, a review of the social science literature on questionnaires has been provided. Based on this review, it is concluded that research articles, as a minimum, should include:
– Response format (Were open or closed questions incor-porated in the design? If closed, what levels were used to measure the degrees of difference? Were participant responses limited by predefined answers?)
– Delivery mode (Was the questionnaire administered or self-administered? If administered, how was inter-viewer bias minimised?)
– Sampling techniques (Which probability or non-probability technique was used to select the sample? If a probability technique was employed, how representa-tive is the sample of the population of interest?) – Response rate (How was non-response bias dealt with?) – The questionnaire as an appendix or available
electron-ically.
In doing so, this will not only allow the work to be compared and/or reproduced but it will also allow us to build on our current understanding, knowledge and practice. As a result, the natural hazards research community will benefit from re-liable, replicable and valid results.
Questionnaires can be used to reveal information on pub-lic knowledge, attitude, perception, experience and prepared-ness levels in relation to natural hazards. When this informa-tion is combined through a mixed methods approach, robust results can be obtained, which are both comprehensive and quantifiable, adding an invaluable perspective to the develop-ment of appropriate risk mitigation and adaptation strategies.
Acknowledgements. I gratefully acknowledge financial support from the Department of Environment and Geography and the International Office at Macquarie University, Australia; Rannís – the Icelandic Centre for Research (Research Grant #081260008), Vegagerðin (The Icelandic Road Administration) and Landsvirkjun, Iceland. I thank Reykjavik Excursions, the Icelandic Touring As-sociation and Iceland Excursions for providing accommodation or transport to Þórsmörk, and G. Gisladottir (University of Iceland) and D. Dominey-Howes (University of New South Wales) for their helpful comments and suggestions during the research. Insightful comments from T. Glade and two anonymous reviewers on early drafts of this article are deeply appreciated. I thank the managing editor, F. Guzzetti for waiving publication service charges. Finally, all participants are thanked for their willingness to participate in the study.
Edited by: T. Glade
Reviewed by: two anonymous referees
References
Akason, J. B., Ólafsson, S., and Sigbjörnsson, R.: Phases of Earth-quake Experience: A Case Study of the June 2000 South Iceland Earthquakes, Risk Anal., 26, 1235–1246, 2006.
Alexander, D.: Natural Disasters, UCL Press Limited, London, 632 pp., 1993.
Anderson-Berry, L. J.: Community Vulnerability to Tropical Cy-clones: Cairns, 1996–2000, Nat. Hazards, 30, 209–232, 2003. Anderson, S. P., Walder, J. S., Anderson, R. S., Kraal, M. C.,
Foun-tain, A. G., and Trabant, D. C.: Integrated hydrological and hydrochemical observations of Hidden Creek Lake jökulhlaups, Kennicott Glacier, Alaska, J. Geophys. Res., 108, 6003, 2003. Badri, S. A., Asgary, A., Eftekhari, A. R., and Levy, J.: Post-disaster
resettlement, development and change: a case study of the 1990 Manjil earthquake in Iran, Disasters, 30, 451–468, 2006. Barberi, F., Davis, M. S., Isaia, R., Nave, R., and Ricci, T.: Volcanic
risk perception in the Vesuvius population, J. Volcanol. Geoth. Res., 172, 244–258, 2008.
Bazeley, P.: The contribution of computer software to integrat-ing qualitative and quantitative data analyses, Research in the Schools, 13, 64–74, 2006.
Bazeley, P.: Qualitative Data Analysis with NVivo, Sage Publica-tions, London, 217 pp., 2007.
Bird, D. and Dominey-Howes, D.: Tsunami risk mitigation and the issue of public awareness, The Australian Journal of Emergency Management, 21, 29–35, 2006.
Bird, D. and Dominey-Howes, D.: Testing the use of a “ques-tionnaire survey instrument” to investigate public perceptions of tsunami hazard and risk in Sydney, Australia, Nat. Hazards, 45, 99–122, 2008.
Björnsson, H., Pálsson, F., and Guðmundsson, M. T.: Surface and bedrock topography of the Mýrdalsjökull ice cap, Iceland: The Katla caldera, eruption sites and routes of jökulhlaups, Jökull, 49, 29–46, 2000.
Bourque, L. B., Shoaf, K. I., and Nguyen, L. H.: Survey Research, International Journal of Mass Emergencies and Disasters, 15, 71–101, 1997.
Brilly, M. and Polic, M.: Public perception of flood risks, flood forecasting and mitigation, Nat. Hazards Earth Syst. Sci., 5, 345– 355, 2005,
http://www.nat-hazards-earth-syst-sci.net/5/345/2005/.
Bruen, M., O’Sullivan, J. J., Gebre, F. A., and Purcell, P. J.: De-signing for surface water runoff control: end-user requirements in Ireland, Nat. Hazards Earth Syst. Sci., 8, 635–640, 2008, http://www.nat-hazards-earth-syst-sci.net/8/635/2008/.
Bryman, A.: Quantitative and Qualitative Research: Further Re-flections on their Integration, in: Research Design, edited by: de Vaus, D., Sage Benchmarks in Social Research Methods, Sage Publications, London, 355–375, 2006.
Bulmer, M.: Questionnaires, 1st edition, Sage Benchmarks in So-cial Science Research Methods, edited by: Bulmer, M., Sage Publications, London, 354 pp., 2004.
Carlino, S., Somma, R., and Mayberry, G. C.: Volcanic risk percep-tion of young people in the urban areas of Vesuvius: Compar-isons with other volcanic areas and implications for emergency management, J. Volcanol. Geoth. Res., 172, 229–243, 2008. Carrivick, J. L.: Hydrodynamics and geomorphic work of
jökulh-laups (glacial outburst floods) from Kverkfjöll volcano, Iceland, Hydrol. Process, 21, 725–740, 2007.
Ceci´c, I. and Musson, R.: Macroseismic surveys in theory and prac-tice, Nat. Hazards, 31, 39–61, 2004.
Chester, D. K., Duncan, A. M., and Dibben, C. J. L.: The impor-tance of religion in shaping volcanic risk perception in Italy, with special reference to Vesuvius and Etna, J. Volcanol. Geoth. Res., 172, 216–228, 2008.
Collins, D.: Pretesting survey instruments: An overview of cogni-tive methods, Qual. Life Res., 12, 229–238, 2003.
Creswell, J. W.: Research Design: Qualitative, Quantitative and Mixed Methods Approaches, 2nd edition, Sage Publications, Inc, California, 246 pp., 2003.
Davis, M. S., Ricci, T., and Mitchell, L. M.: Perceptions of Risk for Volcanic Hazards at Vesuvio and Etna, Italy, The Australasian Journal of Disaster and Trauma Studies, 2005-1, 2005.
de Vaus, D. A.: Surveys in Social Research, 5th edition, Allen & Unwin, Crows Nest, Australia, 379 pp., 2002.
Denzin, N. K.: Strategies of Multiple Triangulation, in: Research Design, edited by: de Vaus, D., Sage Benchmarks in Social Re-search Methods, Sage Publications, London, 309–330, 2006. Dolce, A. and Ricciardi, M.: Impact of psychological risk factors
on disaster rescue operations: the case of Italian volunteers, Dis-asters, 31, 91–103, 2007.
Dominey-Howes, D. and Minos-Minopoulos, D.: Perceptions of hazard and risk on Santorini, J. Volcanol. Geoth. Res., 137, 285– 310, 2004.
Douglas, M. and Wildavsky, A.: Risk and Culture: An Essay on the Selection of Technical and Environmental Dangers, University of California Press, Ltd, London, 1982.
Drabek, T. E.: Human System Responses to Disaster: An Inventory of Sociological Findings, Environ. Manage., edited by: DeSanto, R. S., Spring-Verlag, New York, 509 pp., 1986.
Dunn, K.: Interviewing, in: Qualitative Research Methods in Hu-man Geography, edited by: Hay, I., Oxford University Press, Australia, 79–105, 2005.
Eliasson, J., Larsen, G., Gudmundsson, M. T., and Sigmundsson, F.: Probabilistic model for eruptions and associated flood events in the Katla caldera, Iceland, Computat. Geosci., 10, 179–200, 2006.
Enders, J.: Measuring community awareness and preparedness for emergencies, Australian Journal of Emergency Management, 16, 52–58, 2001.
Fehily, A. N. and Johns, A. P.: Designing questionnaires for nutri-tion research, Nutrinutri-tion Bulletin, 29, 50–56, 2004.
Fowler, F. J.: Survey Research Methods, Applied Social Research Methods Series, Sage Publications, Thousand Oaks, 178 pp., 2002.
Gaillard, J.-C.: Alternative paradigms of volcanic risk perception: The case of Mt. Pinatubo in the Philippines, J. Volcanol. Geoth. Res., 172, 315–328, 2008.
Gaillard, J.-C., Clavé, E., Vibert, O., Azhari, D., Denain, J.-C., Efendi, Y., Grancher, D., Liamzon, C. C., Sari, D. R., and Se-tiawan, R.: Ethnic groups’ response to the 26 December 2004 earthquake and tsunami in Aceh, Indonesia, Nat. Hazards, 47, 17–38, 2008.
Glatron, S. and Beck, E.: Evaluation of socio-spatial vulnerabil-ity of cvulnerabil-itydwellers and analysis of risk perception: industrial and seismic risks in Mulhouse, Nat. Hazards Earth Syst. Sci., 8, 1029–1040, 2008,
http://www.nat-hazards-earth-syst-sci.net/8/1029/2008/. Gregg, C. E., Houghton, B. F., Johnston, D. M., Paton, D., and
Swanson, D. A.: The perception of volcanic risk in Kona com-munities from Mauna Loa and Hualalai volcanoes, Hawaii, J. Volcanol. Geoth. Res., 130, 179–196, 2004a.
Gregg, C. E., Houghton, B. F., Paton, D., Swanson, D. A., and Johnston, D. M.: Community preparedness for lava flows from Mauna Loa and Hualalai volcanoes, Kona, Hawaii, B. Volcanol., 66, 531–540, 2004b.
Gregg, C. E., Houghton, B. F., Paton, D., Lachman, R., Lachman, J., Johnston, D. M., and Wongbusarakum, S.: Natural warning signs of tsunamis: human sensory experience and response to the 2004 great Sumatra earthquake and tsunami in Thailand, Earthq. Spectra, 22, 671–691, 2006.
Gregg, C. E., Houghton, B. F., Paton, D., Johnston, D. M., Swanson, D. A., and Yanagi, B. S.: Tsunami warnings: understanding in Hawaii, Nat. Hazards, 40, 71–87, 2007.
Grímsdóttir, H. and McClung, D.: Avalanche Risk During Back-country Skiing – An Analysis of Risk Factors, Nat. Hazards, 39, 127–153, 2006.
Guðmundsson, M. T., Elíasson, J., Larsen, G., Gylfason, Á. G., Einarsson, P., Jóhanesson, T., Hákonardóttir, K. M., and Tor-fason, H.: Yfirlit um hættu vegna eldgosa og hlaupa frá ves-turhluta Mýrdalsjökuls og Eyjafjallajökli, in: Hættumat vegan eldgosa og hlaupa frá vestanverðum Mýrdalsjökli og Eyjafjal-lajökli, edited by: Guðmundsson, M. T. and Gylfason, Á. G., Ríkislögreglustjórinn, Reykjavík, 11–44, 2005.
Hanson, B.: Wither Qualitative/Quantitative?: Grounds for Methodological Convergence, Qual. Quant., 42, 97–111, 2008. Hawkes, G. and Rowe, G.: A characterisation of the methodology
of qualitative research on the nature of perceived risk: trends and omissions, J. Risk. Res., 11, 617–643, 2008.
Haynes, K., Barclay, J., and Pidgeon, N.: Whose reality counts? Factors affecting the perception of volcanic risk, J. Volcanol. Geoth. Res., 172, 259–272, 2008a.
Haynes, K., Barclay, J., and Pidgeon, N.: The issue of trust and its influence on risk communication during a volcanic crisis, B. Volcanol., 70, 605–621, 2008b.
Hemming, P. J.: Mixing qualitative research methods in children’s geographies, Area, 40, 152–162, 2008.
Horlick-Jones, T., Sime, J., and Pidgeon, N.: The social dynamics of environmental risk perception: implications for risk commu-nication research and practice, in: The Social Amplification of Risk, edited by: Pidgeon, N., Kasperson, R. E., and Slovic, P., Cambridge University Press, Cambridge, 262–285, 2003. IPCC: Climate Change 2007: Impacts, Adaptation and
Vulnera-bility, Contribution of Working Group II to the Fourth Assess-ment Report of the IntergovernAssess-mental Panel on Climate Change, edited by: Parry, M. L., Canziani, O. F., Palutikof, J. P., van der Linden, P. J., and Hanson, C. E., Cambridge University Press, Cambridge, UK, 976 pp., 2007.
Johnston, D. and Benton, K.: Volcanic hazard perception in Ingle-wood, New Zealand, The Australasian Journal of Disaster and Trauma Studies, 1998-2, 1998.
Johnston, D., Paton, D., Crawford, G. L., Ronan, K., Houghton, B., and Burgelt, P.: Measuring Tsunami Preparedness in Coastal Washington, US, Nat. Hazards, 35, 173–184, 2005.
Kasperson, J. X., Kasperson, R. E., Pidgeon, N., and Slovic, P.: The social amplification of risk: assessing fifteen years of research and theory, in: The social amplification of risk, edited by: Pid-geon, N., Kasperson, R. E., and Slovic, P., Cambridge University Press, Cambridge, 13–46, 2003.
Kates, R. W.: Natural Hazard in Human Ecological Perspective: Hypotheses and Models, Econ. Geogr., 47, 438–451, 1971. Kemper, E. A., Stringfield, S., and Teddlie, C.: Mixed Methods
Sampling Strategies in Social Science Research, in: Handbook of Mixed Methods in Social and Behavioral Research, edited by: Tashakkori, A. and Teddlie, C., Sage Publications, Thousand Oaks, 273–296, 2003.
King, D.: Post Disaster Surveys: experience and methodology, The Australian Journal of Emergency Management, 17, 39–47, 2002. King, D., Goudie, D., and Dominey-Howes, D.: Cyclone knowl-edge and household preparation – some insights from Cyclone Larry, The Australian Journal of Emergency Management, 21, 52–59, 2006.
Kozak, M., Crotts, J. C., and Law, R.: The impact of the percep-tion of risk on internapercep-tional travellers, Internapercep-tional Journal of Tourism Research, 9, 233–242, 2007.
Kreibich, H., Thieken, A. H., Petrow, Th., Müller, M., and Merz, B.: Flood loss reduction of private households due to building precautionary measures – lessons learned from the Elbe flood in August 2002, Nat. Hazards Earth Syst. Sci., 5, 117–126, 2005, http://www.nat-hazards-earth-syst-sci.net/5/117/2005/.
Kurita, T., Nakamura, A., Kodama, M., and Colombage, S. R. N.: Tsunami public awareness and the disaster management system of Sri Lanka, Disaster Prevention and Management, 15, 92–210, 2006.
Lam, C., Lin, M.-R., Tsai, S.-H., Choy, C.-S., and Chiu, W.-T.: Comparison of the expectations of residents and rescue providers of community emergency medical response after mudslide disas-ters, Disasdisas-ters, 31, 405–416, 2007.
Larsen, G.: Holocene eruptions within the Katla volcanic system, south Iceland: Characteristics and environmental impact, Jökull, 49, 1–28, 2000.
Larsen, G.: A brief overview of eruptions from covered and ice-capped volcanic systems in Iceland during the past 11 centuries: frequency, periodicity and implications, in: Volcano-ice interac-tion on Earth and Mars, edited by: Smellie, J. L. and Chapman, M. G., The Geological Society, London, 81–90, 2002.
Lavigne, F., Coster, B. D., Juvin, N., Flohic, F., Gaillard, J.-C., Tex-ier, P., Morin, J., and Sartohadi, J.: People’s behaviour in the face of volcanic hazards: Perspectives from Javanese communi-ties, Indonesia, J. Volcanol. Geoth. Res., 172, 273–287, 2008. Leonard, G. S., Johnston, D. M., Paton, D., Christianson, A.,
Becker, J., and Keys, H.: Developing effective warning sys-tems: Ongoing research at Ruapehu volcano, New Zealand, J. Volcanol. Geoth. Res., 172, 199–215, 2008.
Lindell, M. K. and Whitney, D. J.: Correlates of Household Seismic Hazard Adjustment Adoption, Risk Anal., 20, 13–26, 2000. Martin, I. M., Bender, H., and Raish, C.: What Motivates
Individ-uals to Protect Themselves from Risks: The Case of Wildland Fires, Risk Anal., 27, 887–900, 2007.
McGuirk, P. M. and O’Neill, P.: Using Questionnaires in Quali-tative Human Geography, in: QualiQuali-tative Research Methods in Human Geography, edited by: Hay, I., Oxford University Press, Australia, 147–162, 2005.
McIvor, D. and Paton, D.: Preparing for natural hazards: normative and attitudinal influences, Disaster Prevention and Management, 16, 79–88, 2007.
Meheux, K. and Parker, E.: Tourist sector perceptions of natural hazards in Vanuatu and the implications for a small island devel-oping state, Tourism Manage., 27, 69–85, 2006.
Mileti, D., Drabek, T. E., and Haas, J. E.: Human Systems in Ex-treme Environments: A Sociological Perspective, Program on Technology, Environment and Man Monograph #21, Institute of Behvioural Sciences, The University of Colorado, Colorado, 165 pp., 1975.
Oppenheim, A. N.: Questionnaire Design, Interviewing and Atti-tude Measurement, Continuum, London, 303 pp., 1992. Parfitt, J.: Questionnaire design and sampling, in: Methods in
Hu-man Geography, edited by: Flowerdew, R. and Martin, D., Pear-son Education Limited, England, 78–109, 2005.
Paton, D., Johnston, D. M., Bebbington, M. S., Lai, C.-D., and Houghton, B. F.: Direct and vicarious experience of volcanic hazards: implications for risk perception and adjustment adop-tion, Australian Journal of Emergency Management, 15, 58–63, 2001a.
Paton, D., Millar, M., and Johnston, D.: Community Resilience to Volcanic Hazard Consequences, Nat. Hazards, 24, 157–169, 2001b.
Paton, D., Bürgelt, P. T., and Prior, T.: Living with bushfire risk: social and environmental influences on preparedness, The Aus-tralian Journal of Emergency Management, 23, 41–48, 2008a. Paton, D., Smith, L., Daly, M., and Johnston, D.: Risk perception
and volcanic hazard mitigation: Individual and social perspec-tives, J. Volcanol. Geoth. Res., 172, 179–188, 2008b.
Patton, M. Q.: Qualitative Evaluation and Research Methods, 2nd edition, Sage Publications, Newbury Park, 532 pp., 1990. Payne, S. L.: The Art of Asking Questions, Princeton University