Abstract— The objective of this research is to formulate a characterization sound profile of brackish water for White Seabass (Cynoscion nobilis) habitat in the aquaculture environment. The expected outcome is a method of improvement of White Seabass breeding and productivity using sound stimuli. Total of 6 paddle wheels are distributed in the edge of breeding farm (25m x 100m) in order to circulate of water. Two cages which size 8 x 8 x 4 ft are used for life fish habitat which placed near from paddle wheel (edge cage) and far from paddle wheel (center cage). Sound profile has been analysis regarding time series, spectrum frequency, and phase based on time of measures (morning, noon, evening), cages (edge, center), and points of measurement in the cages (four corners, center) position using Cetacean Hydrophone C304 and SpectraLab software. Signal parameter of PF, PA, TP, THD, THD+N, IMD, and SNR has been analysis. PF at noon is always higher than at morning and evening for both cages and points of measurement. PA and TP at noon are highest and consistent on positive value. Evening is lowest and morning is highest value for THD. Profile of THD+N and IMD are no consistence. SNR in the center cage (ten times) higher than edge cage (five times). This data is occurred for the morning, noon, and in the evening.
Index Term— Brackish Water, Sound Profile, Sound Stimuli, White Seabass.
I. INTRODUCTION
Awide range of waterborne sound is generated by human activities in aquatic environments. Consequently, fish are subjected to extreme levels of chronic (continuous) and acute (transient) noise which may stress them to the point of reduced growth rate, reduced reproductive performance, increased disease susceptibility and even mortality. A number of studies have focused on fish hearing and perception. However, no study has examined waterborne sound characterization in fish farming (aquaculture) conditions and real time conditions.
Fish are exposed to a wide range of waterborne sound in natural and culture conditions. In natural waters, sound is generated by machinery, propulsion systems of large ships and by-flow (wake noise). Even wider ranges of sound are
Sunardi is with the Electrical Engineering Department, Universitas Ahmad Dahlan, Yogyakarta 55164, Indonesia (corresponding author, phone: 62
274-379418; fax: 62 274 381523; e-mail: [email protected]). Anton Yudhana is with the Electrical Engineering Department, Universitas
Ahmad Dahlan, Yogyakarta 55164, Indonesia (e-mail: [email protected]).
Jafri Din is with the Electrical Engineering Faculty, Universiti Teknologi Malaysia, Johor Bahru 81310, Malaysia (e-mail: [email protected]). Saberi Mawi is with the Pusat Penyelidikan Ternakan Air Payau, Gelang
Patah, Johor Bahru, Malaysia (e-mail: [email protected]).
produced in heavy ship traffic areas. Sonar systems, shock test, boat repairs, underwater explosions and airborne sound (from aircraft and sonic booms) along with offshore construction, auto traffic and coastal and other human activities are significant sources of sounds.
The impact of acoustic stresses could be particularly important in coastal zones that are the primary spawning grounds for many commercially important species. By knowing the sound characteristic of fish farming (aquaculture) conditions then a method of improving fish productivity and breeding using underwater audio could be implemented.
Sound is a mechanical disturbance that propagates through water as a pressure wave in an elastics medium. The pressure waves radiates spherically from its source with the intensity (I) decreasingly inversely with the square of distance (R) [1]. Sound pressure level (SPL) or sound level is a logarithmic measure of the rms sound pressure of a sound relative to a reference value. It is measured in decibels (dB) and expressed as below [2].
Sound Pressure Level (dB) = 20 log (p/pref) (1)
The sound levels of most mammals are sensitive extend over many orders of magnitude. Brackish water is water that is saltier than fresh water. It is a mixture from fresh water and sea water. Technically, brackish water contains between 0.5 and 30 grams of salt per liter.
The numerous species from many unrelated families produce sounds and acoustic exchanges are part of the aggressive and reproductive behavior of many fishes. However, a fish's environment contains far more sounds than those produced by nearby co-specific alone. Furthermore, the level of auditory acuity a species exhibits is not always positively correlated with the extent to which it uses sound in intra-specific communication [3].
The auditory system is particularly important for aquatic vertebrates when visual orientation is restricted. Sounds from different sources provide them with information relevant for survival, e.g., finding mates and prey or avoiding predators. The natural environment of fish, especially that of marine fish but also freshwater habitats is characterized by a permanent background noise of abiotic (currents, rain, seismic events, coastal surf) and biotic (vocalizations of animals, photosynthesis) origin [4].
Most investigations on sound detection in fish, however, were performed under quiet laboratory conditions, and their results may be ill-suited to information on the ability of fishes to detect signals in their natural environment [4].
Sound Profile for White Seabass (
Cynoscion
nobilis
) Habitat in the Brackish Water
Most of the aquaculture research is most interested on freshwater and seawater because there are more popular and more compared to the species from brackish water. The objective of this research is to formulate a characterization of sound profile for White Seabass (Cynoscion nobilis) habitat in the aquaculture environment sound of brackish water.
Thus, there are some reasons why this research must to be done. The first point is this research will come out with the characteristics of sound pressure level for brackish water and its effect to fish growth. Secondly, this research will support the mission to increase the quantity of production of aquaculture industry.
II. SOUND PROFILE
The perception of underwater sound poses several challenges to fish because of similar acoustic impedance between fish body and its surrounding water medium, it makes fish body almost transparent to passing sound waves. Under such condition the fish body vibrates in sync with the sound wave and no differential movement of body is expected to stimulate sensory hair cells.
Several reports include comprehensive treatments of the characteristics of underwater sound [5]. In any medium, a propagated sound wave has pressure P, a scalar quantity, as well as the vector properties of acceleration, particle displacement, and velocity u, a function of displacement and frequency. For a sound wave in water, though not in air, the relationship between P and u changes with distance from the sound source [3].
Fish show great variation in the frequency range of hearing and sensitivity over those frequencies, although related species may exhibit similar auditory capabilities if inhabit similar acoustic environments. Species with poor sensitivity and narrow frequency range come from diverse families and occupy many different habitats [3].
In the aquatic environment, hearing is an important sense for the survival of an animal. Sound travels faster and is muchless attenuated in water than in air, making it the perfectmeans for communication over long distances [6]. The auditory system is wanted to know the fish ability to hearing sound for some range of frequency. Fish detect sound via otolithic endorgans of the inner ear, which respond directly to linear accelerations of the fish induced by particle motion [7]. Indirect stimulation of the inner ear by pressure waves occurs in some species as well. This indirect stimulation is enhanced in species that have specializations connecting the swim bladder or some other gas-filled chamber to the inner ear (hearing specialists), but may also apply to fish that lack such a specialization [7].
By listening to the backgroundnoise in an aquatic habitat, an animal can get biotic informationabout the position of prey or predators, potential mates or competitors, as well as abiotic information about currents, coastlines, torrents,wind, etc. [8]
Ambient noise ultimately determines the detect ability of all stimuli impinging on an animal [9]. In dealing with the evolution of hearing capabilities, it is crucial to knowhow an animal copes with the problem of differentiating relevant acoustic events (signals) from the background noise. This problem cannot be solved simply by enhancing the auditory
sensitivity since this would affect both signals and noise detection [10].
Auditory thresholds increased almost linearly with white noise level in the hearing specialists, whereas the hearing generalist was only slightly affected by the higherwhite noise level applied (spectral level approx. 95 dB). The increasewas linear for the most sensitive frequencies but not for theupper and lower ends of the fish's hearing ranges. The masking effect was most pronounced in the most sensitive frequency range, whichmay explain why we observed significant interactions betweennoise and frequency, yielding different trends of noise effectsat different frequencies.
Sound stimuli consisted of tone bursts that were presented at a repetition rate of 21 per second. Hearing thresholds were determined at the following frequencies: 0.1, 0.3, 0.5, 0.8,1.0, 2.0, 3.0, and 4.0 kHz for C. carpio and 0.1, 0.2, 0.3, 0.5,0.8, and 1.0 kHz for P. fluviatilis. Frequencies were presentedin a random order under normal laboratory conditions and in the presence of continuous masking noise. The duration of the sound stimuli increased from two cycles at 0.1 and 0.2 kHz,up to eight cycles at 4 kHz. Rise and fall times were one cycleat 0.1 and 0.2 kHz, and two cycles at all other frequencies.All bursts were gated using a Blackman window [11].
A hydrophone (Brüel & Kjaer 8101, Naerum, Denmark; frequency range: 1 Hz-80 kHz ±2 dB; voltage sensitivity:-184 dB re 1 V µPa-1) was placed close to the right side of the animals (2 cm apart) in order to determine absolute SPLvalues underwater in close vicinity to the subjects [11].
Sound pressure is the adequate measure of the level of auditory stimulation in pressure-sensitive fish such as otophysines [12] in any acoustic field. For technical and comparative reasons,the hearing thresholds of European Perch are also given in SPL values, although hearing generalists detect particle motionof sounds. This is acceptable because this study emphasized the effects of the same defined background noise (noise spectraare given in pressure units) on signal detection in different species using the same experimental setup and on relative threshold shifts within a species rather than absolute thresholds. Thisapproach is valid as long as the displacement field is proportionalto the pressure field, because in masking studies the ratioof the tone level to the noise level at nearby frequencies ismost important [13]. However, thatthose hearing thresholds should not be regarded as absolute values because the exact proportional factor between the twosound parameters remains unknown.
III. METHODOLOGY
Breeding farm has been prepared by using brackish water which size of 25 m x 100 m and 2 m of depth. Total of 6 paddle wheels are distributed in the edges of breeding farm in order to water circulation are in operate. The operations of these paddle wheels (on or off) can be controlled.
Two cages as shown in Fig. 1 are dedicated for life fish habitat in this measurement. Cage has been constructed by wood, drum, and net. The size of cage is 8 x 8 ft for both cages. First cage placed near from paddle wheel (edge cage) and second cage placed far from paddle wheel (center cage).
Fig. 1. Cage setup for life fish habitat in the breeding farm of brackish water. First cage placed near of paddle wheels in the edge of the breeding farm (edge cage) and second cage placed far from paddle wheels in the center of breeding
farm (center cage).
White Seabass (Cynoscion nobilis) is fish species which use in this measurement. Fish put in the edge cage, center cage, and out of cage in the breeding farm which total fish are 20, 20, and 12500 respectively. The proportionality population of fish in the cage and out of cage is controlled.
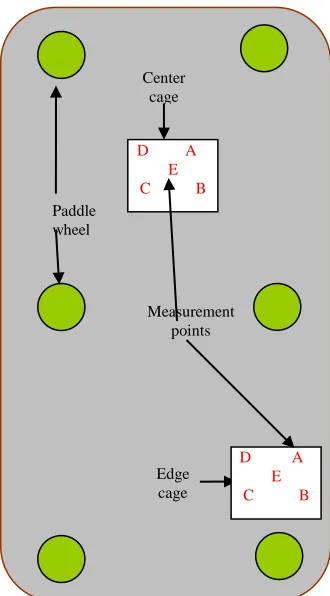
Sound profile at each cage position has been measured at different point by using hydrophone for position based (edge cage, center cage), time based (morning, noon, evening), and point based (A, B, C, D, E). Point of A, B, C, and D are four corners of cage, while E is center point of cage as shown in Fig. 2. Time series, spectrum frequency, and phase at every point then can be analysis.
Detail analysis of sound profile as signal parameters (PF, PA, TP, THD, THD+N, IMD, SNR) in this measurement deployed by using SpectraLab. All of graph has been deployed by using Microsoft Excel software.
The sound pressure level will be measured at the area which is expected give a two extreme sound profile. These sound pressure level will be measured by using Cetacean hydrophone with the model C304. The range frequency of this model is 7 Hz to 250 kHz. The output from the hydrophone has been analysis by using SpectraPlus software. This research is focus on lower frequency which is 10 Hz until 50 Hz. This is actually the range of low frequency for fish. The SPL will record 2 minutes for every point measurement.
Fig. 2. Six paddle wheels which distributed in the edges of breeding farm. Edge cage and center cage with each five points (A, B, C, D, E) for sound
profile measurements.
IV. RESULTS AND DISCUSSION
Sound profile analyzed regarding time series, spectrum frequency, and phase. Data analysis has been done based on time-cage-position, which is based on time of measure (morning, noon, evening), position of cage in the breeding farm (edge cage, center cage), and position of measurement points (A, B, C, D, E). The analysis has been conducted by using SpectraLab software which setting analyzer as shown in Table I.
TABLE I
SETTING ANALYZER FOR SOUND PROFILE MEASUREMENT
Parameter Morning Noon Evening
Window Hanning Hanning Hanning FFT (pts) 4,096 1,024 4,096 Bit 16 bit mono 16 bit mono 16 bit mono Fs (Hz) 12,000 12,000 12,000 Method Post process Post process Post process
Signal parameter on PF (Hz), PA (% fs), TP (% fs), THD (%), THD+N (%), IMD (%), and SNR (dB) taken from measurement based on cage-position are listed in the Table II, III, and IV for morning, noon, and evening respectively.
Paddle wheel
Measurement points
D A E C B D A
E C B
TABLE II
SIGNAL PARAMETER MEASURED AT MORNING FOR FIVE
POINTS
edge cage A B C D E
PF (Hz) 14.65 38.09 14.65 14.65 14.65 PA (% fs) -47.30 -72.79 -12.98 -18.26 -73.44 TP (% fs) -38.41 -59.91 -5.33 -10.35 -66.91 THD (%) 206.67 149.45 131.78 138.01 199.82 THD+N (%) 144.18 87.70 126.00 204.20 171.25 IMD (%) 171.95 215.68 243.53 300.72 205.40 SNR (dB) -3.18 1.14 -2.01 -2.01 -4.67
center cage A B C D E
PF (Hz) 23.44 14.65 35.16 20.51 20.51 PA (% fs) -72.18 -41.71 -76.74 -77.81 -78.10 TP (% fs) -63.28 -39.46 -65.50 -64.92 -64.72 THD (%) 158.32 78.31 232.42 354.94 346.40 THD+N (%) 109.90 11.57 159.14 167.97 176.96 IMD (%) 229.25 189.27 213.98 187.36 210.41 SNR (dB) -0.82 18.73 -4.03 -4.51 -4.96
TABLE III
SIGNAL PARAMETER MEASURED AT NOON FOR FIVE POINTS
edge cage A B C D E
PF (Hz) 35.16 29.30 29.30 41.02 29.30 PA (% fs) 0.04 0.67 0.07 0.26 0.00 TP (% fs) 0.09 1.78 0.63 0.55 0.01 THD (%) 100.34 104.34 96.91 81.32 195.20 THD+N (%) 60.23 202.17 146.17 139.38 120.16 IMD (%) 174.90 82.59 96.86 99.14 199.90 SNR (dB) 4.40 -6.11 -3.30 -2.89 -1.60
center cage A B C D E
PF (Hz) 29.30 70.31 29.30 29.30 29.30 PA (% fs) 0.15 0.07 0.00 0.01 0.07 TP (% fs) 1.12 0.26 0.02 0.05 0.33 THD (%) 124.03 283.84 176.48 90.92 87.91 THD+N (%) 264.29 182.84 130.77 90.24 46.37 IMD (%) 133.26 165.65 213.63 223.16 268.05 SNR (dB) -8.44 -5.24 -2.33 0.89 6.68
TABLE IV
SIGNAL PARAMETER MEASURED AT EVENING FOR FIVE POINTS
edge cage A B C D E
PF (Hz) 14.65 14.65 14.65 14.65 17.58 PA (% fs) -39.50 -31.02 -42.23 -34.78 -42.48 TP (% fs) -26.88 -25.13 -33.91 -31.28 -37.21 THD (%) 78.06 44.20 197.18 76.10 60.42 THD+N (%) 58.51 278.26 51.32 90.68 124.01 IMD (%) 188.50 271.62 196.98 254.86 233.04 SNR (dB) 4.65 -8.89 5.80 0.85 -1.87
center cage A B C D E
PF (Hz) 17.58 14.65 14.65 14.65 14.65 PA (% fs) -38.42 -29.64 -35.94 -38.45 -32.32 TP (% fs) -28.80 -28.57 -33.27 -33.47 -21.72 THD (%) 106.80 40.26 61.63 69.59 176.02 THD+N (%) 52.50 9.58 10.36 82.43 140.82 IMD (%) 189.82 196.66 235.03 193.49 295.24 SNR (dB) 5.60 20.37 19.69 1.68 -2.97
Time series, frequency, and phase in the edge cage at morning, noon, and evening for every measurement point (A, B, C, D, E) or total 30 graphs has been analysis using SpectraLab. As an example, time series, frequency, and phase in the edge cage at morning for point A can be shown in Fig. 3.
(a) Time Series
(b) Spectrum
(c) Phase
Fig. 3. Time series, frequency, and phase in the edge cage records in the morning for point measurement of A, as a sample, from total of 30 graphs.
Analysis of every signal parameter divided into edge cage and center cage. At every cage, the signal parameter value has been compared for time of measure (morning, noon, evening) and points of measurement (A, B, C, D, E).
PF at evening is lowest and relatively stable on 14.65 Hz for both cages (edge, center) and for all measurement points (A, B, C, D, E). PF at noon always higher than at evening, which is 29.30 Hz, for all both cages and for all measurement points. PF at morning is relatively the same with PF at evening, except at point B on edge cage and point C on center cage which have higher value of PF.
TP at noon is highest and relatively stable, less than 0-2% fs for both cages and for all measurement points. TP at evening always less than at noon, about negative 30% fs, for all both cages and for all measurement points. TP at morning always lower than at evening, about negative 60% fs, except at point C and D of edge cage which higher value than at evening.
Profile of THD is no consistent. However, the trend of evening is lowest (lower than 100%) and morning is highest value of THD for both cages and for all measurement points. THD at noon at between of evening and morning, but have no consistent value.
Profile of THD+N and IMD are no consistent. No consistence at all time of measure, all cages and for all measurement points. In the morning, area in the edge cage receives the sound from paddle wheel higher than the area in the center cage. SNR in the center cage (ten times) higher than edge cage (five times). This data is occurred for the morning, noon, and in the evening.
These sound profiles will be controlled and compared to the fish growth with the same condition and treatment regarding sound stimuli. In this research, the paddle wheel is assumed the noise generator. The future work, the noise generator will be established by the sound generator which has the higher power and adjustable its frequency. The expected outcome is a method of improvement the White Seabass breeding and productivity using sound stimuli.
REFERENCES
[1] Amoser, S. and F. Ladich. (2005). Are hearing sensitivities of freshwater fish adapted to the ambient noise in their habitats?
University of Vienna, Department of Neurobiology and Behavior, Althanstrasse 14, 1090 Vienna, Austria
[2] Evans, H. D. (1998). The physiology of fishes second edition. CRC Press, New York.
[3] Fay, R. R. (1974). Masking of tones by noise for the goldfish. J. Comp. Physiol. Psychol. 87, 708 -716.
[4] Fay, R. R. and Popper, A. N. (1974). Acoustic stimulation of the ear of the goldfish (Carassius auratus). J. Exp. Biol. 61, 243 -260
[5] Fay, R. R., Ahroon, W. A. and Orawski, A. A. (1978). Auditory masking patterns in the goldfish (Carassius auratus): Psychophysical tuning curves. J. Exp. Biol. 74, 83 -100.
[6] Hawkins, A. D. and Myrberg, A. A., Jr. (1983). Hearing and sound communication under water. In Bioacoustics, a Comparative Approach (ed. B. Lewis), pp.347-405. London: Academic Press.
[7] Lagardère, J. P., Bégout, M. L., Lafaye, J. Y. and Villotte, J. P. (1994). Influence of wind-produced noise on orientation in the sole (Solea solea). Can. J. Fish. Aquat. Sci. 51, 1258 -1264.
[8] Popper, A.N. & S. Coombs. (1980). Acoustic detection by fishes. pp. 403-430. In: M.A. Ali (ed.) Environmental Physiology of Fishes, Plenum Press, New York.
[9] Popper, A. N. and Fay, R. R. (1993). Sound detection and processing by fish: critical review and major research questions. Brain. Behav. Evol.
41, 14-38.
[10] Scholik, A.R., Hong Y. Yan. (2002). The effects of noise on the auditory sensitivity of the bluegill sunfish. Lepomis macrochirus. University of Kentucky, Lexington, KY 40506, USA.
[11] Schwarz, A.L. (1985). The behavior of fishes in their acoustic environment.West Vancouver Laboratory, Department of Fisheries and Oceans, Vancouver, British Columbia, Canada.
[12] Weeg, M.S., R.R. Fay . A.H. Bass. (2002). Directionality and frequency tuning of primary saccular afferents of a vocal fish, the plainfin midshipman (Porichthys notatu)., 188: 631–641
[13] Wysocki, L.E., F. Ladich. (2005). Hearing in Fishes under Noise