*Corresponding author: Sumer S Choudhary
Department of Pulmonary/Respiratory Medicine, NKP Salve Institute of Medical Sciences and Research Centre & Lata Mangeshkar Hospital,
INTERNATIONAL JOURNAL OF CURRENT MEDICAL AND
PHARMACEUTICAL RESEARCH
ISSN: 2395-6429, Impact Factor: 4.656
Available Online at www.journalcmpr.com
Volume 5; Issue 06(A); June2019; Page No. 4259-4263
DOI: http://dx.doi.org/10.24327/23956429.ijcmpr201906670
Research Article
ASTHMA CONTROL TEST (ACT) SCORE: EFFECTIVENESS, VALIDATION, RELIABILITY, AND
RESPONSE IN OPD PATIENTS OF OUR PLACE
Dr Sumer S Choudhary*, Jaydeep G Nayse, Dr B O Tayade, Dr Samrudhi Tayade,Dr Shriyansh Singh, Dr
Preetam Dhande and Dr GopalGondchar
Department of Pulmonary/Respiratory Medicine,NKP Salve Institute of Medical Sciences and Research
Centre&Lata Mangeshkar Hospital, Vana Dongri, CRPFcampus Hingna, Digdoh Hills,
Nagpur Maharashtra India 440019
ARTICLE INFO ABSTRACT
Background: The Asthma control Test (ACT), Asthma Control Questionnaires (ACQ) and GINA Scales are
widely used clinical and scientific tool to evaluate asthma, but not yet validated nor reliability studied in different population Aims: Study is conducted to evaluate usefulness of ACT scores in initiation or treatment change in asthma patients, its reliability and to correlate ACT score with GINA guidelines and ACQ. Setting and Design:
This hospital based cross sectional study at department of Pulmonary Medicine, NKP Salve Institute of Medical Sciences, Nagpur. Methods and Material: Our participants were patient’s age 12 years and above, asthma diagnosed according to GINA guidelines, literate to complete questionnaire. We compared ACT score with GINA asthma control, ACQ, and asthma severity. Statistical analysis used: EPI Info Software version 7. Results: Total 111 adult patients with new or previous diagnosed case of asthma who fulfilled the inclusion and exclusion criteria were included. The group of patients having ACT score >20 and <15 had an agreement with GINA controlled and uncontrolled group. The group of patients having ACQ score of <0.75 had fair agreement with ACT score >20.ACQ >1.5 had a moderate agreement with corresponding ACT score of <20. The FEV1 % predicted had a positive correlation with ACT score Asthma control as defined by GINA was highly correlated with asthma severity. Most patients with severe persistent asthma were uncontrolled. Conclusions: Using appropriate cut off point’s agreement can be observed between numerical and categorical scale. The choice of the scale to evaluate current asthma control may have a significant impact on the control status of an individual patient.
Copyright © 2019 Sumer S Choudhary et al. This is an open access article distributed under the Creative Commons Attribution License, which permits unrestricted use, distribution, and reproduction in any medium, provided the original work is properly cited.
INTRODUCTION
The prevalence of asthma continue to increase despite advances in knowledge about the path physiology of asthma and the availability of effective therapy.[1,2] The Asthma control Test (ACT), Asthma Control Questionnaires (ACQ) and GINA Scales are widely used clinical and scientific tool to evaluate asthma. According the 2006 GINA guidelines, the clinician is required to control the asthma symptoms and decrease the risk of exacerbation [3]The GINA guidelines evaluate asthma on the basis of control of symptoms rather than severity. GINA classifies patients on categorical scale as controlled, partly controlled and uncontrolled asthma1 . There are number of numerical scales to quantify asthma control. They are ACT, ACQ 5, 6, 7 etc. In these GINA guidelines FEVI and Peak flow rate measurements are required for evaluation of asthma control. However this is not feasible in resource limited setting.[4]The Asthma Control Test assessment is a self administered tool comprising of 5 questions [5], was developed to meet this need for asthma control in our routine clinical practice. Asthma is a multifaceted complex disease with characteristic symptoms, changes in pulmonary function and having significant impact on functional ability of
individual and quality of life. [6] There are studies which found that uncontrolled asthma correlates with ACT score of <19 with clinically important difference of 3 points. [7] ACQ is the numerical scale commonly used in clinical trial studies. This score has been legitimised in various studies and clinically important difference has been determined [8,9] It is observed that ACQ score of <0.75 correlates with GINA defined controlled asthma and score of >1.5 correlates with uncontrolled asthma.
The study is conducted to evaluate usefulness of ACT scores in initiation or treatment change in asthma patients, evaluating reliability and validity of ACT score, to correlate ACT score with GINA guidelines and ACQ, to asses ACT score reliability in prediction of asthma control and to assess its responsiveness to changes in asthma control over time.
MATERIAL AND METHODS
Total 111 adult patients with new or previous diagnosed case of asthma who fulfilled the inclusion and exclusion criteria willing to participate were recruited for the study from department of Pulmonary/Respiratory Medicine, NKP Salve Institute of Medical Sciences and Research Centre and Lata
Article History:
Received 13th March, 2019 Received in revised form 11th
April, 2019
Accepted 8th May, 2019
Published online 28th June, 2019
Key words:
Mangeshkar Hospital, tertiary treatment center situated at Vana Dongri Digdoh Hills, Hingna Nagpur . The present study is survey based, cross sectional, non-randomized. Institutional ethics committee approval, informed consent of patients were taken. All statistical analysis was done on EPI Info Software version 7.The unpaired T test was used for significance of quantitative data. Sensitivity, specificity, negative, and positive predictive value, accuracy and Kappa value score was derived in ACT, GINA and ACQ score with level of significance 0.05.The patients included were of age 12 years and above, asthma diagnosed according to GINA guidelines, literate to complete questionnaire and patients willing and able to perform spirometry. The spirometry was performed on Geratherm spirometer. The patients excluded were those having active chronic respiratory disease requiring treatment, intervention or diagnostics, patients with severe or uncontrolled co morbidities, history of more than 10 pack years of smoking ,history of recent exacerbation or infective respiratory disease ,systemic disease affecting lungs,overlap syndrome and known respiratory disorder
The GINA evaluation of patients were done by asking the patients to recollect past 4 weeks symptoms and were supported by diaries and spirometry. The patients completed the ACT score questionnaire which consists of 5 questionaries’ including use of bronchodilators, effect on daily activities and asthma symptoms (daytime and nocturnal).Each question has 5 responses, which was rated on 5 point rating scale. Scoring was done by summing up the score of each response to yield a score between 5 to 25. Patients completed the ACQ numerical scale by recalling how the asthma was during previous 1 week. It has 7 questions consisting of score of 5 symptoms, forced expiratory volume in 1 second [FEV1], % predicted, and frequency of use of bronchodilator. The ACQ score was recorded on a 7 point scale 0 to 6 that is mean of the 7 question score.
This questionnaire designed also consisted of information required for asthma control under GINA guidelines. Patients were also asked about their use of peak-flow meters (PEFMs), most recent PEFM reading, and smoking status. Furthermore, patients were asked series of questions to evaluate their frequency of asthma attacks during 4 week prior to the survey. Five ACT and ACQ questions were included in the questionnaire as mentioned above. We supervised the completion of the questionnaire ,their current treatment, medication used for primary control, and the type of asthma (atopic or non-atopic) as indicated by the total serum IgE level or the detection of allergen-specific IgE and the overall severity of disease. FEVI, Act score and ACQ was recorded in initial and follow up visits. We compared ACT score with GINA asthma control, ACQ, FEVI, and asthma severity.
RESULTS
Asthma control was prospectively evaluated using ACT, GINA, and ACQ-7 scales in 111 adult patients.
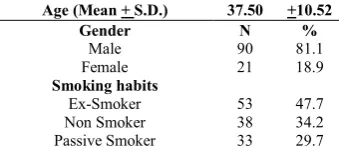
Table 1 Patients Baseline Characteristics
Age (Mean + S.D.) 37.50 +10.52
Gender N %
Male 90 81.1
Female 21 18.9
Smoking habits
Ex-Smoker 53 47.7
Non Smoker 38 34.2
Passive Smoker 33 29.7
Smoker 20 18.0
Symptom N %
Cough 77 69.4
Shortness Of Breath (SOB) 66 59.5
Wheezing 33 29.7
Exacerbation (4 weeks prior to
admission) 21 19.9
Phenotype
Atopic 60 54.1
Non atopic 51 45.9
Disease duration
(Mean + S.D.) 16.97 +6.65
BMI 20.15 5.45
variability % pefr 13.90 2.767
Therapy before visit N %
Inhaled Corticosteroid (ICS) 75 67.6 Short Acting Beta 2
Agonist(SABA) 61 54.95
Leukotriene receptor
antagonist (LTRA) 52 46.8
Long Acting Beta2
Agonist(LABA) 49 44.1
Oral sustained released
Theophylline(OSRT) 43 38.7
Oral Corticosteroid(OCS) 33 29.7
Other 4 3.6
The mean age of patients was 37.5 years with majority of them male 81.1%.Most of the patients i.e. 65.8% had exposure to tobacco. Cough was the predominant symptom followed by SOB. History of atopy was observed in 54.1% and the mean duration of symptoms was 16.97 years. Most of the patients were on inhaled corticosteroid therapy 67.6 %.( Table 1)
Table 2 Performance of Patients
Mean T value P value
FEV1(l/Min) initial 1.27+0.48
-7.62 <0.001 FEV 1(l/Min) follow up 1.67+0.39
FEV 1(%PRED) initial 56.86+18.4
-9.77 <0.001 FEV 1(%PRED) Follow up 77.29+15.62
Act Score initial 15.60+4.21
-7.85 <0.001 Act Score Follow up 18.77+2.38
ACQ initial 2.70+1.5
9.94 <0.001
ACQ folow up 1.92+0.88
There was significant improvement in FEVI, ACT Score and ACQ in follow up visits as shown in Table 2.
Figure 1 Asthma severity of Patients in Initial Visit
Most of the patients 34(30.6%) had symptoms severity of Moderate Persistent (Figure 1).
0 5 10 15 20 25 30 35 40
n %
In initial visits there were 43(38.7%) each in partly controlled and uncontrolled groups while in follow up visits there were 46(41.4%) patients in controlled and 62 (55.9%) partly controlled group. It was observed that maximum patients 60 (54.1%) in initial visits had FEV1 <60% whereas in follow-up visit 95(85.6%) were in group of >80%. (Table 3)
Figure 2 Comparison of Act Score with GINA Defined Asthma Control
We compared the Act score with asthma control as per GINA guidelines. We observed that in initial visit there were 43[93.5%] and 3[6.5%] patients of uncontrolled and partly controlled having ACT score <15.In ACT score 16-19 there were 39[90.7%] and 4[9.3%] patients of partly controlled and controlled group whereas we observed 1[4.5%] and 21[95.5%] patients of partly controlled and controlled having ACT score > 20.In follow up visits we found 1[33.3%] and 2[2.7%] patients in uncontrolled and partly controlled group having act score <15.In the ACT score 16-19 there were 2[66.7%], 52[71.2%] and19 [71.2%] patients in uncontrolled, partly controlled group and controlled group whereas we observed 8[26.0%] and 27[77.1%] patients of ACT score >20 in partly controlled and controlled group of GINA defined asthma categorical scale. (Figure 2).The group of patients having ACT score >20 and <15 had an agreement with GINA controlled and uncontrolled groups, with a specificity of 67% and diagnostic accuracy of 65.77%.
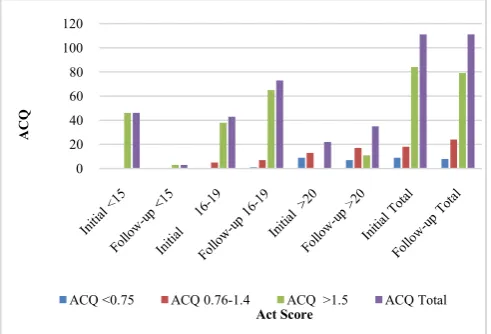
Figure 3 Comparison of Act Score with ACQ
We compared ACT score wit ACQ and found in initial visit 46[54.8%] and in follow up visit 3[3.8%] of patients having ACQ > 1.5 were in Act score group of <15. In ACT score between 16-19 in initial visit 5 [27.8%] and 38[45.2%] had ACQ score of 0.76-1.4 and >1.5 whereas 1[12.5%], 7[29.2%] and 65[82.3%] were having ACQ score <0.75, 0.75-1.4 and >1.5 respectively. In Act score >20 in initial group we observed 9[100.0%] and 13[72.2%] patients had ACQ score <0.75 and 0.76-1.4 respectively and 7[87.5%], 17[70.8%] and 11[13.9%] patients of follow up patients were having ACQ score <0.75, 0.76-1.4 and >1.5 respectively. (Figure 3)
The group of patients having ACQ score of <0.75 had fair agreement with ACT score >20 with specificity of 100% in initial group and 98.68 % in follow up group with Kappa value of 0.23.ACQ >1.5 have a moderate agreement with corresponding ACT score of <20 with specificity of 89.47% and sensitivity of 68.57% with kappa value of 0.59 in follow up group.
Figure 4 Comparison of Act score with FEV 1 %PRED
On comparing ACT score with FEV1 % predicted we observed that in initial visit 45[97.8%] patients and 3 [100%] of follow up group had FEVI < 60 corresponded with Act Score < 15.In FEV1 <60,59-79 and >80 there were 15[34.9%],27[62.8%] and1 [2.3%]patients of initial group and 7[9.6%],50[ 68.5%] and 16[21.9%] of follow up group corresponding to ACT score of 16-19.In ACT score >20,there were 9[40.9%] and 13[59.1%] patients of initial and 6[17.1%] and 29[82.9%] of follow up having FEV1 of 59-79 and >80.( Figure 4)
The FEV1 % predicted had a positive correlation with ACT score with maximum patients of ACT score <15 having FEV 1 of <60 and act score >20 having FEV1 % more than 80 0
20 40 60 80 100 120
Ast
hm
a
Control
Act Score
uncontrolled Partly controlled controlled Total
0 20 40 60 80 100 120
ACQ
Act Score
ACQ <0.75 ACQ 0.76-1.4 ACQ >1.5 ACQ Total
0 20 40 60 80 100 120
FEV
%
PRED
Act Score
FEV 1% PRED <60 FEV 1% PRED 59-79
FEV 1% PRED >80 FEV 1% PRED Total
Table 3 GINA Control and FEV1 of Patients in Initial and Follow up Visits
Gina Control FEV I(%PRED)
Controlled Partly Controlled uncontrolled <60 59-79 80-100 >100
n % n % n % n % n % n % n %
Initial 25 22.5 43 38.7 43 38.7 60 54.1 37 33.3 14 12.6 0 0
Figure 5 Comparison of Act score with Asthma Severity
We observed in the initial visit 1(2.2%),3(6.5%),10(21.7%) and 32(69.6%) patients of MI,MIP,MOP and SP had ACT score <15.In ACT score of 16-19 we observed 9(20.9%),11(25.6%), and 23(53.5%) patients of MI,MIP and MOP whereas in ACT score of >20 there were 19(86.4%),2(9.1%) and 1(4.5%) patients in MI, MIP, MOP. In the follow up group 2(66.7%) and 1(33.3%) patients of MOP and SP had Act score <15.In ACT score between 16-19 there were 13(17.8%),10(13.7%),29(39.7%), and 21(28.8%) patients in MI,MIP,MOP and SP whereas as in ACT score >20 there were 16(45.7%) ,6(17.1%),3(8.6%) and 10(28.6% ) in each group mentioned before. the flowing when we compared ACT score with severity. (Figure 5)
Asthma control as defined by GINA was highly correlated with asthma severity. Most patients with intermittent, mild, and moderate asthma had controlled disease. In contrast, the disease in most patients with severe persistent asthma were uncontrolled There was positive correlation between ACT score and Asthma symptom severity. There was agreement between ACT score of >20 and MI in initial visit and in follow up visit with MI + MIP. .In follow up group specificity was 44.83% and sensitivity 23.17% having fair agreement with Kappa value of 0.243.
69.6% of initial and 62.3% of follow up group of severe persistent severity had ACT Score <19 indicating a moderate agreement between act score and severity scale.
Asthma control as defined by GINA was highly correlated with asthma severity. Most patients with intermittent, mild, and moderate asthma had controlled + partly controlled disease. In contrast, the disease in most patients with severe asthma was uncontrolled. The choice of the scale to evaluate current asthma control may have a significant impact on the control status of an individual patient.
DISCUSSION
In present study we studied the agreement between the commonly used categorical and numerical scales used for evaluation of asthma. ACT score and ACQ score are numerical scores used to evaluate asthma control over a short term period of 4 week and 1 week respectively. Till date no gold standard scale is available to measure the asthma control. The GINA classification is described as a working scheme based on present-day opinion which is not yet validated. The mean age of patients was 37,5 years +10.52 with disease duration of
16.97 + 6.65years.Of this only 34.2% were non smokers while rest of them were exposed to smoking in one or either way. The disease of majority of the patients started in their childhood or adolescent age hence smoking related obstruction was less likely and more than half of the study population 54% had history of atopy.
In this prospective study we evaluated whether ACT is synom with GINA defined asthma control and ACQ. We compared ACT score with GINA (splitting it into uncontrolled and controlled + partly controlled groups) and ACQ. We observed a specificity of 67% with diagnostic accuracy of 65.77% with GINA and Specificity of 89.4% and Sensitivity of 68.57% with ACQ.
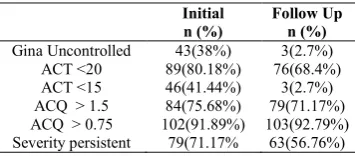
Table 4 Number of Patients in each scales Using Different Cut off Values
Initial n (%)
Follow Up n (%)
Gina Uncontrolled 43(38%) 3(2.7%)
ACT <20 89(80.18%) 76(68.4%)
ACT <15 46(41.44%) 3(2.7%)
ACQ > 1.5 84(75.68%) 79(71.17%)
ACQ > 0.75 102(91.89%) 103(92.79%) Severity persistent 79(71.17% 63(56.76%)
We observed agreement between ACT and GINA, ACT and ACQ if proper cut off points are applied. Using recommended cut off points the ACT and ACQ classified significantly more patients as uncontrolled (Table 4).
In present study if ACT score cut off point of <15 is used then, there would be a better balance between ACT and GINA defined Uncontrolled asthma and using a cut of point of 20 overestimates the number of patients. Koolen et al.[10] studied how to use ACT score to identify uncontrolled asthma patients as per the GINA score. They observed a sensitivity of 66% and a specificity of 100% using cut off value of 19 and suggested that increase in cut off value would increase the sensitivity. Alvarez-Gutierrez et al.[11] compared ACT with GINA and observed that ACT score for each GINA control, classified only 59.4%, 54.1% and 63.6% of the patients correctly.
In ACQ using cut off point of >1.5 in the uncontrolled population the sensitivity was 68.5%.Some studies suggested 1 as cut-off point .If we used this cut off it will overestimate the uncontrolled population if compared to GINA categorical scale.
One of the study suggested ACQ -5 cut off 1 while comparing GINA and Gaining Optimal Asthma Control (GOAL) criteria to obtain a balance of sensitivity and specificity for the GINA criteria,[12] however in the present study this would escalate the number of patients with GINA uncontrolled asthma.
The asthma control status of an individual may be impacted significantly depending on the scale used to evaluate the asthma control. In present study if we compared categorical GINA asthama control with numerical scale, using recommended cut off points for uncontrolled asthma, than the numerical scale classifies significantly more patients. In this framework, the GINA criteria would not be able to correctly classify all patients with uncontrolled asthma patients.
Using the recommended cut off points <15 for the ACT score to define uncontrolled asthma and dual split for GINA classification (uncontrolled vs. controlled + partly controlled), correctly predicted 93.5% of patients, whereas using cut of value of >1.5 for ACQ and <15 for ACT score correctly 0
20 40 60 80 100 120
Ast
hm
a
Sev
er
ity
Act Score
Mild Intermittent (MI) Mild Persistent (MIP)
Moderate Persistent (MOP) Severe Persistent (SP)
predicted 54.3% of patients and cut off of <20 predicted 75.69% of patients.
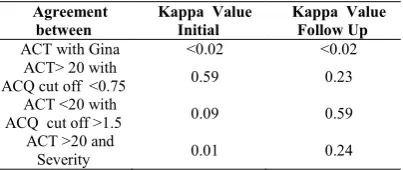
Table 5 Kappa Agreement between different scales
Agreement between
Kappa Value Initial
Kappa Value Follow Up
ACT with Gina <0.02 <0.02
ACT> 20 with
ACQ cut off <0.75 0.59 0.23
ACT <20 with
ACQ cut off >1.5 0.09 0.59
ACT >20 and
Severity 0.01 0.24
Kappa Coefficient is a statistical test designed to determine interobserver agreement .The Kappa has a value ranging from 0 to 1. A value of 0 means agreement is equivalent to chance whereas a value of 1 means ideal agreement [13] Using a cut-off point of 20 for the ACT score to define uncontrolled asthma and a cut-off point of 1.50 for the ACQ scores, the kappa level of agreement for the patient population was was 0.09 and 0.5942 for initial and follow up visit indicting an agreement. (Table 5) Thomas et al. [14] in his retrospective study of more than 2900 patients observed a Kappa coefficient of 0.42when compared ACT with GINA. They observed GINA partly controlled and uncontrolled group was adequately predicted by ACT score <19. O’Byrne et al. [12]
in his study comparing GINA, ACT 5, and GOAL observed substantial agreement between GINA and GOAL with a Kappa of 0.8, however between GINA uncontrolled with ACQ-5 > 1.5 ,the Kappa value was 0.61
Using appropriate cut off point’s agreement can be observed between numerical and categorical scale. The choice of the scale use to evaluate asthma control has a clear effect on the amplitude of control both in an individual patient and in patient populations. This analysis proves that the cut off values must be based on the representative population which is likely to undergo the test, and then the ACT score would be a reliable and effective numerical scale.
Acknowledgement
We acknowledge the contribution of PFT technician Rajani Raut for her support in performing the tests and Fascit Xeroprinters for helping us to prepare the graphs.
References
1. Bateman ED, Hurd SS, Barnes PJ, Bousquet J, Drazen
JM, FitzGerald M,et al.Global strategy for asthma
management and prevention: GINA executive summary. Eur Respir J 2008; 31:143-78.
2. Koshak E. Classification of asthma according to revised
2006 GINA: evaluation from severity to control. Ann Thorac Med 2007; 2:45-6.
3. Ohta K, Yamaguchi M, Akiyama K Adachi M, Ichinose M, Takahashi K et al. Japanese guideline for adult asthma. AllergolInt 2011; 60:115-45.
4. Doerschug KC, Peterson MW, Dayton CS, Kline JN.Asthma guidelines: An assessment of physician understanding and practice. Am J RespirCrit Care Med 1999; 159:1735-41.
5. Roberts NJ, Smith SF, Partridge MR. Why is spirometry underused in the diagnosis of the breathless patient: A qualitative study. BMC Pulm Med 2011; 11:37.
6. Vollmer WM. Assessment of asthma control and
severity. Ann Allergy
Asthma Immunol 2004; 93:409-14
7. .7. Schatz M, Kosinski M, Yarlas AS,Hanton J,Watson M,Priti J. The minimally important difference of the Asthma Control Test. J Allergy Clin Immunol. 2009; 124:719–723.
8. Juniper EF, O’Byrne PM, Guyatt GH, Ferrie PJ, King DR. Development and validation of a questionnaire to measure asthma control. Eur Respir J 1999; 14:902– 907.
9. Juniper EF, Svensson K, Mork AC, Stahl E. Measurement properties and interpretation of three shortened versions of the asthma control questionnaire. Respir Med. 2005; 99:553–58.
10. Koolen BB, Pijnenburg MWH, Brackel KJL,
A.M. Landstra, N.J. van den Berg, P.J.F.M. Merkus, et al. Comparing Global Initiative for Asthma (GINA) criteria with the Childhood Asthma Control Test (C-ACT) and Asthma Control Test ((C-ACT). Eur Respir J 2011; 38:561-6.
11. Alvarez Gutie´rrez FJ, Medina Gallardo JF, Perez Navarro P, Martín Villasclaras JJ, Martin Etchegoren B, Romero-Romero B, et al. Comparison of the Asthma Control Test (ACT) with lung function, levels of exhaled nitric oxide and control according to the Global Initiative for Asthma (GINA). Arch Bronconeumol 2010; 46:370-7.
12. O’Byrne PM, Reddel HK, Eriksson G, Ostlund O, Peterson S, Sears MR et al. Measuring asthma control: a comparison of three classification systems. Eur Respir J 2010; 36: 269–76.
13. 13 Cohen J. A coefficient of agreement for nominal scales. Educ Psychol Meas 1960; 20:37-46.
14. 14. Thomas M, Kay S, Pike J, Williams A, Rosenzweig JR, Hillyer EV et al. The Asthma Control Test (ACT) as a predictor of GINA guideline-defined asthma control: analysis of a multinational cross-sectional survey. Prim Care Respir J. 2009; 18:41–9
How to cite this article:
Dr Sumer S Choudhary et al (2019) ' Asthma Control Test (Act) Score: Effectiveness, Validation, Reliability, and Response In Opd Patients of Our Place', International Journal of Current Medical And Pharmaceutical Research, 05(06), pp 4259-4263.