Abstract— The most prominent threats to the main water resource in north east Kelantan is the intrusion of salt water, especially in the second aquifer and part of the third aquifer. The main purpose of this work was to evaluate the salt water intrusion into the first aquifer. It was investigated using physical and chemical characteristics of ground water, which revealed that. A range of pH from 1.65 ̶ 8.81, electrical conductivity (EC) 2 ̶ 1094 µs/cm, salinity 0.02 ̶ 0.149, and total dissolved solids 1 ̶ 671 mg/l. A range of calcium (Ca), sodium (Na), chloride (Cl) and sulfate (SO4) 1.4 ̶ 194.26, 2.86 ̶ 62.4, 2.91 ̶ 54.79 and 0.74 ̶ 64.12 mg/L
respectively. The values of Na, Ca, SO4, Cl and EC were decrease
gradually from the sea towards inland. A variation in the ground water levels between the wet and dry seasons, which was in rang of 0.42 ̶ 3.7 m. Moreover, the freshwater/saltwater interface was located on the shoreline in the dry season and retreated in the wet season. In general, theintrusion of salt water was detected in the first coastal aquifer; however, it has a limited effect. The ground water in this aquifer is fresh (except the two wells 20 and 32) that considered as salty due to the high average of chloride, salinity, total dissolved solids, and electrical conductivity.
Index Term-- Salt water intrusion; First aquifer; Bachok, Kelantan
I. INTRODUCTION
Salt water intrusion into the aquifer of fresh water is a common environmental problem in many parts of the world. It is often caused by natural conditions and human activities. The saline intrusion of aquifers might originate from various sources such as sea water, saline water in enclosed areas like a tidal lagoon return flows to stream from disposal wells, and leakage from irrigated lands [1]. Ground water represents the most vital natural resources. It delivers potable water supply torural and urban populations, supports manufacturing and irrigation. In addition, it sustains the rivers flow and streams, and preserves riparian and ecosystems of wetland [2].
Quality of ground water reservoir can be affected by some factors, such as contamination by salt water intrusion or by toxic industrial chemic waste. On the other hand, quality of surface water may be impacted via ground water flow or vice versa [3]. The amount of salt water that has intruded into the fresh water aquifer eventually mixes with the ground water and
inevitably to production wells and finally our drinking water which is not suitable for human life and most of the animals and plant types. Therefore both ground water and surface water are two vital and interconnected water bodies that relate to each other both in terms of quality and quantity. However, either ground or surface water, the general goal is to make sure that, sufficient suppliesof good quality of water are available to all societies, the ones living nowadays and for generations of future, while conserving required quality and quantity of water flow to sustain vital functions of ecosystems [4].
These contaminants represent communal environmental problems that have produced the need to find appropriate ways for monitoring the extent of such environmental damage [5], [6], [7]. The most important parameters for investigation of ground water are electrical conductivity (EC), total dissolved solids (DS), calcium (Ca2+), magnesium (Mg+), sodium (Na+) and chloride (Cl-). The six parameters mentioned above affected the characteristics of ground water are an evidence of sea water intrusion [8].
Although the ground water represents about 90% of the whole water resources in Bachok [9], with increasing population density, increased demand for water and the ground water has been suffering from some environmental problems such as salt water intrusion, pollution, and drought. The salt water intrusion is considered as the most concern in the study area. Hence, this paper aimed to mapping the salt water intrusion area and its changes during the dry and wet seasons using the physiochemical characteristics of ground water and Surfer software.
II. MATERIALS AND METHODS A.Location of the study area
The investigated area is situated on the northeast coast of Malaysia, located along the coastal area of northeast Kelantan. It extends about 12.5 km in length and 10 km in width, between Jelawat and downstream of the Kemasin river at the sea as shown in (Fig 1).
The issue of Salt Water Intrusion during The
Dry and Wet Seasons in The First Coastal
Aquifer of Bachok Kelantan, Malaysia
Atea.K.A.AL mabrok
1, Wan Zuhairi Wan Yaacob
2, Abdulrahim Samsudin
3& Jasni Yaakub
41, 2, 3 Geology Programme School of Environmental Sciences and Natural Resources, Faculty of Science and Technology, Universiti Kebangsaan Malaysia, Bangi 43600, Malaysia
Fig. 1. Boundaries of the study area Source: Modified after [10].
Geological Condition
Sediments of Quaternary cover most of the coastal area of Kelantan (Fig 2), whereas the bedrock is granite. It divided by short rivers and streams that flow towards the South China Sea. Moreover, the largest river of Kelantan drains the area and flow into northeast. The Pengkalan Datu River drains the plain in southeast, [9].
Fig. 2. Geological map of Kelantan, Source: Modified from [11]
B.Hydrogeological Condition
The quaternary sediments contain alternating layers of sand, silt, gravel, and clay. The cross-section is showing that the sediments cover granite bedrock Fig 3. The Quaternary sediments can be divided into four aquifers. The silty clay layers separate the aquifers from each other. The topmost ranged from a few meters to maximum 15 m under the ground, and separated from the second aquifer by a layer composed mainly of clay. The depth of the second aquifer is commonly between 20 - 35 m and a thickness about 15 m. In addition, a clay rich layer separates this aquifer from the third aquifer below it. The third aquifer’s depth is more than 40 m, and it also shows great thickness exceeding 50 m in some wells. The
fourth aquifer is situated on the granite bedrock, which is not always detectable [12].
Fig. 3 Cross section of Chap and Bachok villages, Kelantan Source: Modified from [12].
C.Water supply in Kelantan
A traditional ground water supply distribution project, came into reality when the Kota Bharu water works institute has been established, which is now under the administration of the Malaysian Public Works Department, in the late twenties [13]. The initial water resources study in the area of Kelantan was carried out by German consultants, in cooperation with the Geological Survey Department of Malaysia [14, 15&16] as cited in [17]. A local contractor, Binner and Partners (Malaysia) was awarded a contract to investigate the future water demand, and recommend the best means to meet the demand [18]. The public Waterworks Department generally takes ground water from the first and third aquifers. Ground water from the second aquifer is not utilized because it is saline and not suitable for domestic use [17].
D.Physical and chemical data
physical and chemical surveys were carried out within the study area. It was divided into three parts (A, B, C) and three lines (first, second and third) as shown in Fig 4.
Fig. 4.The physical and chemical survey lines in the study area. Source: Modified from [10].
into three parts and lines, in addition, to accurate determination to the salt water intrusion phenomenon during the dry and wet seasons. The hydrophysical survey was conducted utilizing Water Quality meter (YSI). It was used to determine temperature (°C), electrical conductivity EC (µs/cm), total dissolved solid TDS (mg/L), and pH. Moreover, the ground water level and total depth of the wells were measured at the same time. For the chemical survey, thirty six groundwater samples were collected during the dry and wet seasons from the shallow wells in different sites of Bachok, and its surrounding areas. The chemical analysis was conducted to determine the concentration of calcium (Ca), sodium (Na), chloride (Cl) and sulfate (SO4). It was using Ion Chromatography (IC) and Inductively Coupled Plasma Mass Spectrometry ICP-MS Instruments. The quantitative data of Cl and EC were used to produce the salinity map utilizing (Surfer software).
II.RESULTS AND DISCUSSION
The results showed that, in the dry season, the level of ground water ranged from 0.78 - 3.7 m. While during the wet season the ground water level ranged from 0.42 - 3.1 m. The variation in ground water levels refers to the annually rainfall, geological and geomorphological condition, and ground water usage. The total depth of the wells, ranged from 1.65 ̶ 17 m. The temperature values ranged from 26.15 ̶ 30.22 °C. The electrical conductivity ranged from 61-1094 µs/cm, were the values of 61-400 µs/cm, represent the fresh ground water with a very low content of elements. While the values ranged from 401-1000 µs/cm represent the fresh ground water with maximum allowable of elements according to the Malaysian water quality standard. However, the values ranged from 1000-1094 µs/cm represent the salt water intrusion. The highest value 1094 µs/cm was in the well (32), due to its location within the (C) area, in Balai village, about 1200 m from the sea. Furthermore, the value of 1044 µs/cm in the well (20), in the (B) area at Binji village, about 4684 m from the sea; is high due to the salt water intrusion. The value of (701 µs/cm) is a little high due its location within the (C) area in Kawa village, about 25 m from the sea. The values of 488, 537 and 588 µs/cm are moderate as a local environmental impact Fig 5.
.
Fig.5. Variation of electrical conductivity in the wells during the dry season in the first aquifer of Bachok
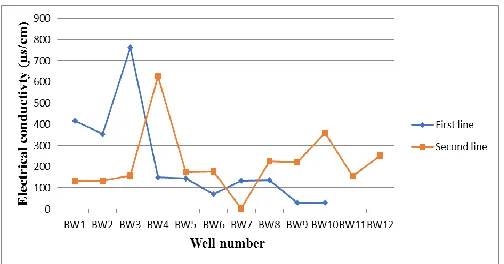
In contrast, during the wet season the (EC) values ranged
from 2-764 µs/cm which were lower than the dry season. This variation reflects the role of rain in reducing the concentration of elements. The two values of 626 and 764 µs/cm are a result of sea water intrusion into these two wells as shown in Fig 6& table 1.
Fig. 6. Variation of electrical conductivity (µs/cm) in the wells during the wet season in the first aquifer of Bachok
Table I
Variation of electrical conductivity (µs/cm) in the wells during the dry and wet season in the first aquifer of Bachok
On the other hand, the chloride concentration values ranged from 2.91-315.58 mg/L. The high value of 315.58 mg/L was a result of salt water intrusion into the well (32), due to its location within the (C) area, in Balai village, about 1200 m from the sea. For the other high value 300.6 mg/L was a result of sea water intrusion into the well (20) due to its location within the (C) area, Fig 7.
Dry season
Wet season 1st
line
2nd line
3rd Line
Well No 1st line
2nd line
354 701 467 BW1 417 133
465 507 551 BW2 353 132
569 236 1094 BW3 764 159
482 468 258 BW4 149 626
175 588 183 BW5 144 173
133 1044 150 BW6 70 178
96 285 153 BW7 133 2
142 215 BW8 135 226
205 188 BW9 28.49 220
113 346 BW10 28.56 360
285 181 BW11 156
537 162 BW12 253
113 119 BW13
61 135 BW14
Fig.7. Variation of chloride concentration (mg/L) in the wells during the dry season in the first aquifer of Bachok
The salt water intrusion into this area refers to its locations in the villages of Bingi about 4684 m from the sea. Through the wet season, the average of chloride was in the range of (4.29-71.46 mg/L), which is very low compared to the dry season. It refers to the role of rain in reducing the concentration of elements as shown in Fig 8 &Table 2.
Fig. 8. Variation of chloride concentration (mg/L) in the wells during the wet season in the first aquifer of Bachok
The total dissolved solids values, ranged from 36 -671 mg/L during the dry season. The highest value (671mg/L) represents the salt water intrusion area. This intrusion refers to its location in the (C) coastal area at the village of Balai (1200 m) from the sea. The lowest value was 36 mg/L due to its location in the (A) area, in the village of Hajnur Marak at a distance of about 9707 m from the sea. In contrast, to the wet season, the range of TDS was 1-465 mg/L, which is low due to the role of rain in reducing the concentration of elements as shown in Fig.9, Fig.10 and Table 3.
Fig. 9.Variation of (TDS) concentration (mg/L) in the wells during the dry season in the first aquifer of Bachok
Table II
Variation of chloride concentration (mg/L) in the wells during the dry and wet season in the first aquifer of Bachok
Dry season
Wet season
1st
line
2nd
line
3rd Line
Well No
1st
line
2nd
line
12. 50 176.26 54.77 BW1 21.285 17.28 1
21.98 56.07 28.15 BW2 19.577 6.888
43.39 7.73 315.58 BW3 51.097 7.058
24.81 6.43 34.4 BW4 5.932 71.45
5
12.19 2.91 17.71 BW5 16.666 11.55
7.947 300.6 15.551 BW6 7.877 4.287
4.86 16.14 33.7 BW7 6.546 21.37
8
11.58 20.46 BW8 21.83
5
30.07 28.27 BW9 7.342
4.96 45.73 BW10 20.58
4
21.53 17.82 BW11 7.363
67.66 8.32 BW12
11.5 9.69 BW13
7.02 37.55 BW14
Table III
Variation of (TDS) concentration (mg/L) in the wells during the dry and wet season in the first aquifer of Bachok
The pH average, ranged from 4.07-7.87 during the dry season. The highest value (7.87) was in the (B) area, at the village of Sri Sentosa. The lowest value was 4.07in the (B) area in Binji village, due to its location in a farming area which perhaps, affected by fertilization activities. During the wet season, the pH average ranged from 1.65-8.81. The highest value (8.81) reflects the influence of carbonate rocks; due to its location in the (C) residing area of Balai village, about 1200 m from the sea. The lowest value was 1.65 in the village of Binji. Consequently, constant rainfall, release fertilizers from the soil into ground water through infiltration operation.
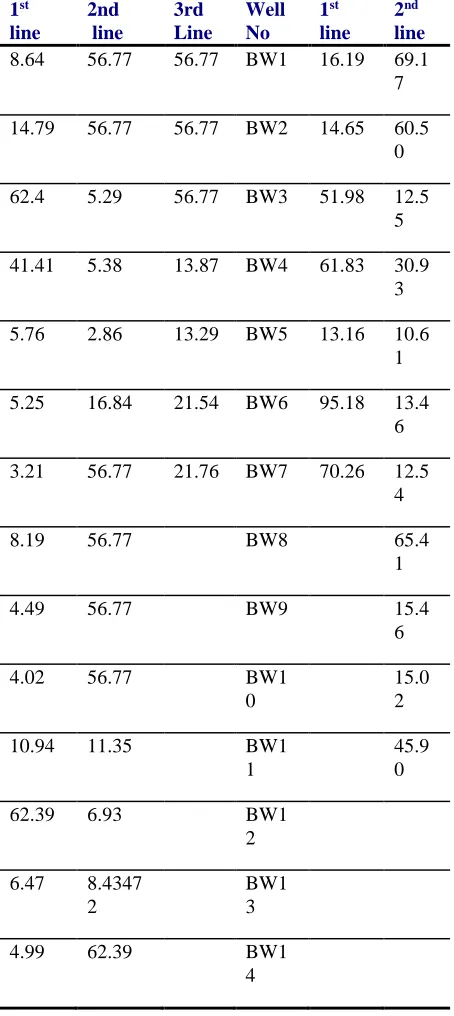
The average of Na was 26.97 mg/L during the dry season. The highest value was 62.4 mg/L which refers to its location in the (C) coastal area in Alurjering village, about 1000 m from the sea. The lowest value was 2.86 mg/L due to its location in the (C) area at Pengkalan Bharu village about 3170 m from the sea. In contrast to the wet season, the average of Na was 46.86 mg/L. The highest value was 98.21 mg/L, in the (C) area at the village of Berise Kubur Besar at the distance of about 4300 m from the sea. The lowest was 10.52 mg/L, in the well (28) within the (A) area at Berise Bekan village at the distance of about 9619 m from the sea. The variation of sodium concentration depends on distance from the sea, amount of rainfall and ground water usage see Table 4
Table IV
Variation of Na concentration (mg/L) in the wells during the dry and wet season in the first aquifer of Bachok
1st line
2nd line
3rd Line
Well No
1st line
2nd line
8.64 56.77 56.77 BW1 16.19 69.1
7
14.79 56.77 56.77 BW2 14.65 60.5
0
62.4 5.29 56.77 BW3 51.98 12.5
5
41.41 5.38 13.87 BW4 61.83 30.9
3
5.76 2.86 13.29 BW5 13.16 10.6
1
5.25 16.84 21.54 BW6 95.18 13.4
6
3.21 56.77 21.76 BW7 70.26 12.5
4
8.19 56.77 BW8 65.4
1
4.49 56.77 BW9 15.4
6
4.02 56.77 BW1
0
15.0 2
10.94 11.35 BW1
1
45.9 0
62.39 6.93 BW1
2
6.47 8.4347
2
BW1 3
4.99 62.39 BW1
4
Dry season
Wet season
1st line
2nd line
3rd Line
Well No
1st line
2nd line
0.216 0.438 0.28 BW1 0.255 0.081
0.29 0.314 0.337 BW2 0.221 0.093
0.336 0.147 0.671 BW3 0.465 0.1
0.304 0.277 0.159 BW4 0.093 0.399
0.108 0.357 0.11 BW5 0.091 0.108
0.078 0.0641 0.094 BW6 0.039 0.108
0.06 0.174 0.093 BW7 0.001
0.089 0.132 0.096 BW8 0.14
0.126 0.115 BW9 0.139
0.07 0.214 BW10 0.227
0.177 0.112 BW11 0.095
0.329 0.098 BW12
0.069 0. 72 BW13
The average of Ca was 31.05 mg/L throughout the dry season. The highest value was 194.26 mg/Lat the (C) coastal area in Alurjering village, about 1000 m from the sea. The lowest value was 1.19 mg/L at Binji village of about 4684 m from the sea. The average of Ca during the wet season was 30.61 mg/L and the highest value was 74.92 mg/L. at the village of Pengkalan China of about 3025 m from the sea. The lowest value was 1.41 mg/L at the (A) residential area of Binji Amarda distance of about 9625 m from the sea.The variation in Ca concentration average is attributed to thedistance from the sea, impact of the local rocks and soil, and water usage Table 5.
Table V
Variation of Ca concentration (mg/L) in the wells during the dry and wet season in the first aquifer of Bachok
The average of SO4 was 14 mg/L during the dry season. The highest value was 42.87 mg/L due to its location within the (C) coastal area. The lowest value was 0.738 mg/L, which is low; due to its location in the (A) area in Binji Amarda. However, during the wet season the average was 13.86 mg/L .The highest value was 64.12 mg/L, in (B) area in Beris Pak Pura about 3696 m from the sea. While, the lowest value was 1.3 mg/L in (C) coastal area in Surau Desa Sentusa at the distance of about 6050 m from the sea which is shown in Fig11, Fig 12& Table 6.
Fig. 11. Variation of sulphate concentration (mg/L) in the wells during the dry season in the first aquifer of Bachok
Fig. 12. Variation of sulphate concentration (mg/L) in the wells during the
wet season in the first aquifer of Bachok
Table VI
Variation of SO4 concentration (mg/L) in the wells during the dry and wet season in the first aquifer of Bachok
1st line 2nd line 3rd Line Well No 1st line 2nd line
45 31.59 13.88 BW1 24.79 69.18
122.6 7
31.02 28.21 BW2 25.00 60.51
194.2 6
22.94 22.53 BW3 44.48 12.55
54.66 180.9
8
16.94 BW4 74.92 30.94
14.5 44.15 7.31 BW5 50.86 10.61
14.5 1.19 12.35 BW6 19.13 13.47
9.59 13.99 25.81 BW7 18.08 12.54
7
9.35 12.18 BW8 65.42
10.38 4.3 BW9 15.46
10.33 15.08 BW1
0
15.02
31.99 6.45 BW1
1
45.90
33.97 9.39 BW1
2
5.6 4.62 BW1
3
1.83 23.01 BW1
4 1st line 2nd line 3rd Line Well No 1st line 2nd line 3rd line
10.9 7.83 18.81 BW1 4.88 3.44 5
2.95 10.6 2
30.24 BW2 11.21 3.25 7
42.8 7
3.27 10.17 BW3 37.44 3.78 8
5.25 26.1 8
11.12 BW4 16.9 1.30 10
12.6 6
1.12 8.27 BW5 7.81 9.34 12
8.94 12.8 6
14.59 9
BW6 3.18 28.72 13
13.2 3
23.5 8
0.738 BW7 2.80 64.12 11
14.6 5
22.3 7
BW8 27.35 14
25.6 5
22.0 2
BW9 1.83 10
4.92 20.8 3
BW1 0
22.11 8
8.29 20.4 8 BW1 1 12.16 3 6 25.3 4
19.2 BW1
2
8.94 5
7.5 6.68 BW1
3
6.63 8
2.94 BW1
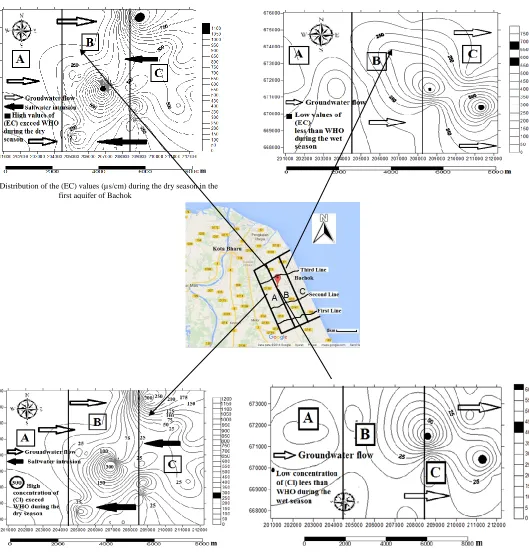
Fig. 14. Distribution of the (EC) values (µs/cm) during the wet season inthe
first aquifer of Bachok
Fig .16. Distribution of (Cl) (mg/L) concentration during the wet season in the first aquifer of Bachok Fig. 13. Distribution of the (EC) values (µs/cm) during the dry season in the
The current study disagrees with [19], [12], [20], and [16] that, the first aquifer is fresh100%, and the fresh water/salt water interface is on the shoreline. However, the results of this study are similar to that obtained by [15]. A cording to the salinity map, the salt water had intruded as far as 3 km inland, and the minimum length of intrusion of the coast is 1km. However, analytical results of the chloride content of the first aquifer, in the said inferred zone in April 1977 did not support that, saline water has intruded as far inland, for about 1 km only as shown in Fig.17
Fig. 17. Variation of freshwater/saltwater interface on the first coastal aquifer of Bachok, Kelantan during the period from (1974-2014) Source: Updated
after [2].
Moreover, the actual saline zone seems to be in much smaller zone with a maximum intrusion length of about 1.35 km inland. The position of this boundary is not static. It varies with the seasons. During the Northeast Monsoon season, the boundary is being pushed outwards nearer to the sea. It is attributed to the greater available amount of fresh water, and a higher hydraulic gradient induced by the high rainfall, which replenishes the aquifer resulting in a greater pressure, exerted on the interface by the fresh water. The saline water is then slowly being flushed out towards the sea [13]. Finally this study provides an accurate determination to the salt water intrusion area, which was not given by the privies studies. The study has evaluated the salt water intrusion area as small as just about 5% of the total study area. Thereby, the ground water from the first aquifer considered as fresh water.
III. CONCLUSION
The intrusion of salt water was detected in small area, which represented in the two wells (20&32) in the villages of Binji about 4684 m from the sea and Balai about 1200 m
respectively. Unreasonable land use is considered as the permanent reason for the intrusion of salt water in this area. However, the area in between the village of Balai 1200 m from the sea and the shoreline is fresh. There is no concern of sea water intrusion as far as the threats of sewage, contaminated rivers and landfills. The freshwater / saltwater interface was located on the shoreline during the dry season, and retreated under the seawater during the wet season. In general, the ground water in the first aquifer is fresh (except the two wells 20&32) that revealed a high average of electric conductivity, chloride concentration, total dissolved solids, Na, Ca, and SO4, which, exceeded the World Health Organization [21].
Therefore, it is recommended that the ground water from the two wells (20&32) need to treat before consumption and continue in monitoring operation for the whole wells and update the salinity map annually. In addition, reduce the pumping ratio of ground water from the salt water intrusion area; recharge the first aquifer from surface water which finally goes to the sea especially during the wet season. However, well siting, to avoid drilling in locations immediately adjacent to the coast prevent any future damages or high economic cost.
ACKNOWLEDGMENTS
The authors would like to record their appreciation to the Geology Program, University Kebangsaan Malaysia for assistance during the fieldwork and in the preparation of this paper. In addition, special thanks to the Geological survey Department of Malaysia and Air Kelantan for their assistance in the collection of water samples from their monitoring wells, as well as the people in the study area.
REFERENCES
[1] T. C. Siang, “Development of saltwater intrusion software using the
visual basic M.S thesis, Dept. Civil. Eng., Putra Malaysia University.,Serdang, Malaysia, 2001, 1-3.
[2] N. Islami, “Geoelectric method for subsurface profiling comparison,
Case study in Tawang and Sabak area north Kelantan”, Malaysia, Makra Sains, 2010; 14: 88-94.
[3] M.Atta, “Steady state groundwater flow modeling of an ex-landfill site in Kuala Lumpur, Malaysia” American Journal of Environmental Sciences, 2015, 348-357.
[4] G. Björklund, “Water management in developing countries-policy
and priorities for EU development cooperation” SIWI Report 12. Stockholm, 2001.
[5] N.S.S. Abdul, M.H. Loke, C.Y. Lee and M.N.M. Nawawi,
Geophysical Prospecting, V48, 2000, 647.
[6] R.D. Barker, In: S.H. Ward (Ed.), “Geotechnical and Environmental
Geophysics: Environmental and Groundwater Applications, Society of Exploration Geophysicists”, 1990, 2 -245.
[7] R.D. Barker, “The Application of Electrical Tomography in
Groundwater Contamination”, 1996.
[8] I. Tawnie, A. Sefie, M. Yusuf, I. Yusoff, H. Juahir, and S.Suratman,
“Ground water geochemistry characteristic at Tanjung Mas well field using chemo metric techniques” The 5th AUN/SEED-Net Regional Conference on Geological Engineering15-16 January 2013, Kuala Lumpur, Malaysia
[9] S. Suratman, “Managing the Groundwater Component in Malaysia”
2004
[10] https://www.google.com/maps/place/Kelantan 2018.
[11] N.I. Mohammad, A. Lioyd, “Grondwater and Environment.
[12] A. R. Samsudin, A. Haryono, U. Hamzah, and A. G. Rafek, “Salinity study of coastal groundwater aquifers in north Kelantan, Malaysia” A. Annual GeologicaL Conference 1997. hlm.41: 159–165. Kuala Lumpur.
[13] I. B. M. Noor, “Prefeasibility study of potential groundwater
development in Kelantan, Malaysia” Ph.D. Thesis, University of Birmingham UK. 1979, 33.
[14] Pfeiffer and Tiedemann. “Hydrogeological studies and the
development of Groundwater in Kelantan, Malaysia” Natural resource development institute, for Scientific Corporation, Tubingen. Federal republic of Germany, 1986, 24: 72-82.
[15] D. Pfeiffer, F. S. Chong, “Groundwater exploration in Kota
Bharu” Report No.1. The geological Survey of Malaysia, 1974.
[16] H. Flathe, “Geoelectric Investigations in Kota Bharu, Kelantan,
Malaysia” 1975. GSD, No. 6.
[17] A. R. Samsudin, A. Haryono, U. Hamzah, and A. G. Rafek,
“Salinity mapping of coastal groundwater aquifers using hydrogeochemical and geophysical methods: a case study from north Kelantan, Malaysia”, 2007. 55: 1737–1743.
[18] T.E. Heng, M. Singh, “Groundwater supply studies in Northern
Kelantan” Bulletin of the Geological Society of Malaysia; 1989, 24: 13-26..
[19] S. Suratman, “Groundwater protection in North Kelantan,
Malaysia. An integrated mapping approach using modeling and GIS” . Unpubl. Ph.D. Thesis, University of Newcastle1999.
[20] A. Haryono, “Management of salt water intrusion in Kelantan”
The final project report MYS289/94:1-.1995, 49.
[21] Organization of W. H.O. “Guidelines for Drinking water quality”
fourth edition, 2011: 26-307
![Fig. 3 Cross section of Chap and Bachok villages, Kelantan Source: Modified from [12]](https://thumb-us.123doks.com/thumbv2/123dok_us/1351752.1643738/2.612.63.224.357.559/cross-section-chap-bachok-villages-kelantan-source-modified.webp)


![Fig. 17. Variation of freshwater/saltwater interface on the first coastal aquifer of Bachok, Kelantan during the period from (1974-2014) Source: Updated after [2]](https://thumb-us.123doks.com/thumbv2/123dok_us/1351752.1643738/8.612.49.290.199.451/variation-freshwater-saltwater-interface-coastal-aquifer-kelantan-updated.webp)
