CLASSIFICATION OF CONTINUOUS DATA- A
SURVEY
Nishtha Sharma
1, Dr. Amit Sharma
2 1M.Tech Scholar,
2Associate Professor, Department of Computer Science & Engineering
,
V
edant College of Engineering & Technology ,Bundi ,Rajasthan (India)
ABSTRACT
Classification in machine learning aims to group similar data based on past user experiences. The
traditional classification algorithms mostly classified static/batch data. With the emergence of Big
Data, classification and analysis of data coming in streams is a highly concerned area of study. It
brings with it a lot of problems too. There have been proposed various methodologies like combining
of classifiers, extensions/optimizations of previous static data classification algorithms to deal with
the new aspect. This paper discusses the various problems encountered in classifying continuous data
and the recent trends in this direction.
Keywords: Big Data, Data Mining, Data Classification, Mining Techniques
I. INTRODUCTION
Classification comes in the supervised machine learning approach with an available training set using which the
algorithm then classifies the testing set such that data is grouped reliably. The steps to a desirable classification
are documentation, preprocessing, indexing, feature selection, classification and performance evaluation, out of
which the most important step is of classification done through classification algorithms or classifiers.
The traditional classification algorithms have been focused on classifying discrete and static data. The mostly
researched topic “Big Data” referring to huge volumes of data available in the world in various forms from
different sources poses a variety of different challenges to handle such data. One of the challenges includes the
continuous nature of data with equally increasing size. Analyzing such data for use later is equally important.
Continuous data classification, as opposed to the discrete/ static data classification, carries the load of handling
uncertainty in data, updation of data for classification within a matter of seconds along with the classification
task, fast speed of the clustering algorithm to match the fast pace of the data arriving for classification in
streams, on the fly classification in order to avoid storage of this vast amount of data, combination of continuous
with other data types and many more problems.
The probable solutions to the various problems encountered can be extensions/optimizations of the traditional
algorithms, different feature selection methods or combining of classifiers to use the advantages of all. This
paper surveys the recent developments in the direction of overcoming the problems of classifying continuous
II. RECENT DEVELOPMENTS
Brito et al [1] in 2006 provided a comparative study on the combining of classifiers for solving the continuous
and discrete data classification problems. Combination of classifiers is favored to contemplate the drawbacks of
a single classifier and use their combined advantages for solving the classification problem. Serial combining
and hierarchical combining methods are considered. Serial combining refers to a linear combination of a finite
number of classification models whereas the hierarchical modeling structures nested model in a binary tree.
Authors access the performances of the classification models of both kinds on discrete and continuous
classification problems. A comprehensive evaluation of the different kinds of clustering and classification
available for both discrete and continuous data is provided by Jacob Peskoe [2] in 2012. The author also deduces
the best algorithm for both types of data.
Bounhas and Mellouli [3] in 2010 proposed a Naïve Possibilistic Network Classifier (NPNC) for classification
of continuous attributes of dataset containing perfect and imperfect input knowledge. The work is based on
possibilistic theory [4,5] and is the first work in the direction of dealing with continuous imperfect data.
Imperfection in data can be understood through examples of a doctor failing to specify what symptoms are
observed in a patient or a crime witness failing to precisely describe the criminal. In other words, uncertainty
and subjectivity in an expert’s knowledge about a situation he would have to make decision about leads to
imperfection. For dealing with imperfection in data, there have been proposed evidence theory and fuzzy set
theory before the possibilistic theory. The proposed NPNC is able to produce a plausible class given as input a
perfect or imperfect continuous knowledge.
Bounhas et al [6] in 2011 proposed an extension to the conference paper of [7] dealing with possibilistic
classification of numeric data. The idea behind the proposal is to extend the work for dealing with imprecise
data too. The proposal is based on the extension principle and addresses three kinds of uncertainties: uncertainty
in the class of the training set, imprecision in the attribute values of the testing set and imprecision due to the
data being limited. The paper includes adaptation of the work in [7] to make it able to deal with imperfection
followed by development of an algorithm for dealing with imprecise attribute values. The proposed
probabilitistic-to-possibilistic work, since the considered Naïve Possibilistic Classifiers (NPC) is a counterpart
to the Naïve Bayesian Classifiers, promises a robust performance when dealing with imprecision in data.
Doquire and Verleysen [8] in 2011 propose a feature selection for classification of mixed numeric categorical
and continuous data. The proposal cannot be adapted to some real problems since it does not consider the
similarity between the mixed data. The proposal involves ranking of the both the attributes of data into different
lists followed by combining the lists. A combination is done taking into account the accuracy of the classifier.
For the ranking, Mutual Information Criterion (MIC) is used.
Leon et al [9] in 2011 worked on classification of general mixed data models. The focus of the study in the
paper is data determining the common characteristics of the patients suffering from croup so as to classify
among them the patients who should be admitted to the hospital or brought home according to the severity in the
disease. The records consist of both nominal and ordinal values thereby showing the mixed nature of data for
followed by investigating the error rates in the proposed rules and outlining the methods for estimation of
misclassification of error rates.
Diana Porro-Munoz [10] in 2012 worked on classification of multi-way continuous data through the use of
Dissimilarity Representation approach. A new development tool and new dissimilarity measures have been
developed for the same in the thesis. The author discusses the problems in the classification of the multiway
continuous data and provides alternatives for tackling them otherwise the problem can considerably affect the
accuracy of the classification. Some of the problems include the curse of dimensionality, noise and missing
values.
Brown et al [11] in 2013 used a publicly available continuous dataset for classifying the color of the vehicle
using its spatial features. Corresponding to the need of accurate object characteristic measurements for video
analytics, ability to extract information through observing the useful attributes is a trivial task. In the paper, the
authors pointed out that around 66% of American cars are shades of grey. Distinguishing from the various
shades of grey, with obstacles in terms of shadow effects, lightening, time of the day, etc becomes a daunting
task. As a solution to the same, a public dataset is released in the paper with ground truth color classification
related to the i-LIDS dataset [12]taking into account its high dimensional video and is capable for evaluations
and comparisons in future. The vehicle color classification into 7 commonly used colors: light silver, dark red,
red, dark blue, white and black is done through the use of spatial features like pose, vehicle alignment and body
part masks.
Le et al [13] in 2014 proposed a heuristic based on Gaussian distribution for efficient classification of
continuous streaming data. The authors first address the long computation time issue of one of the efficient
classifiers for continuous streaming data, E-Rules that works on the sliding window approach and uses a prism
rule-based classifier of [14]. The long processing times pose as a disadvantage to the algorithm, the reason being
the inefficiency of the algorithm to handle the high speed data stream. The proposed G-ERules classifier makes
the E-Rules more efficient in terms of computations. The speed of the proposed classifier is better than E-Rules
while the accuracy of both the classifiers is same.
Volkovs et al [15] in 2014 worked on extending the static data cleaning to deal with continuous data cleaning.
Declarative data cleaning aims to encode data semantics as constraints and finds an error when the data doesn’t
satisfy the specified constraints which then are repaired by the user. Limited to static data so far, data cleaning
of continuous dynamic data is introduced by authors that takes into account repair inconsistencies, predicts what
type of repair is needed and also uses the past user repair preferences for effectively resolving the inconsistency.
The results conform the proposed repair classifier has high prediction accuracy and generates high quality
repairs for the noted inconsistencies.
Jeyalakshmi and Jennifer [16] in 2014 addressed the ability of fuzzy Decision Trees (DT) to handle difficulties
encountered in classification of structured data with continuous target variables/labels. Decision trees are
considered because of their capability of managing noisy data. Fuzzy concept bridges the gap between
ambiguous features and quantitative data. The authors propose an optimized fuzzy decision tree based on
approximate reasoning very similar to ID3. The aim behind the proposal is of classifying the given data into
Parita and Shrivastava [17] in 2014 pointed out the problems associated with classifying incremental/
continuous data and the inability of the traditional tree based classification algorithms to handle the incremental
nature of data. The paper involves building of a decision tree incrementally that does not have to start from the
beginning whenever new information is added in the stream and only updates the new information. The proposal
is based on incremental learning where the new tree is built instance by instance or in batches. Furthermore, the
decision tree also detects concept drifts.
III. BIG DATA ARCHITECTURE AND CLASSIFICATION
This "Big data architecture and patterns" series presents a structured and pattern-based approach to simplify the
task of defining an overall big data architecture [8].
Fig 1: Big Data Architecture
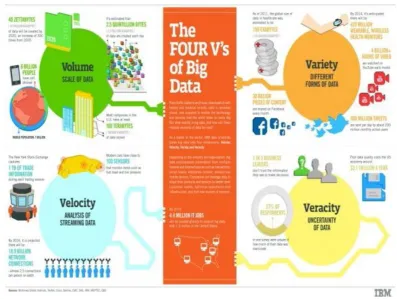
IV. BIG DATA CHARACTERISTICS
We have all heard of the 3Vs of big data which are Volume, Variety and Velocity, yet other Vs that IT, business
and data scientists need to be concerned with, most notably big data Veracity.
Data Volume: Data volume measures the amount of data available to an organization, which does not
necessarily have to own all of it as long as it can access it. As data volume increases, the value of different data
records will decrease in proportion to age, type, richness, and quantity among other factors.
Data Variety: Data variety is a measure of the richness of the data representation – text, images video, audio,
Incompatible data formats, non-aligned data structures, and inconsistent data semantics represents significant
challenges that can lead to analytic sprawl.
Data Velocity: Data velocity measures the speed of data creation, streaming, and aggregation. Ecommerce has
rapidly increased the speed and richness of data used for different business transactions (for example, web-site
clicks). Data velocity management is much more than a bandwidth issue; it is also an ingest issue.
Data Veracity: Data veracity refers to the biases, noise and abnormality in data. Is the data that is being
stored, and mined meaningful to the problem being analyzed. Veracity in data analysis is the biggest challenge
when compares to things like volume and velocity.
V. BIG DATA ANALYTICS
Big data analytics refers to the process of collecting, organizing and analyzing large sets of data ("big data") to
discover patterns and other useful information. Not only will big data analytics help you to understand the
information contained within the data, but it will also help identify the data that is most important to the
business and future business decisions.
Big data analysts basically want the knowledge that comes from analyzing the data.
a. The Benefits of Big Data Analytics
Enterprises are increasingly looking to find actionable insights into their data. Many big data projects originate
from
the need to answer specific business questions. With the right big data analytics platforms in place, an enterprise
can
boost sales, increase efficiency, and improve operations, customer service and risk management.
b. The Challenges of Big Data Analytics
For most organizations, big data analysis is a challenge. Consider the sheer volume of data and the many
different
formats of the data (both structured and unstructured data) collected across the entire organization and the many
different ways different types of data can be combined, contrasted and analyzed to find patterns and other useful
information. The first challenge is in breaking down data silos to access all data an organization stores in
different places and often in different systems. A second big data challenge is in creating platforms that can pull
in unstructured data as easily as structured data. This massive volume of data is typically so large that it's
difficult to process using traditional database and software methods.
c. Big Data Requires High-Performance Analytics
To analyze such a large volume of data, big data analytics is typically performed using specialized software
tools and applications for predictive analytics, data mining, text mining, and forecasting and data optimization.
Collectively these processes are separate but highly integrated functions of high-performance analytics. Using
big data tools and software enables an organization to process extremely large volumes of data that a business
has collected to determine which data is relevant and can be analyzed to drive better business decisions in the
d. Examples of How Big Data Analytics is Used Today
As technology to break down data silos and analyze data improves, business can be transformed in all sorts of
ways.
Big Data allow researchers to decode human DNA in minutes, predict where terrorists plan to attack, determine
which gene is mostly likely to be responsible for certain diseases and, of course, which ads you are most likely
to respond to on Face book. The business cases for leveraging Big Data are compelling. For instance, Netflix
mined its subscriber data to put the essential ingredients together for its recent hit House of Cards, and
subscriber data also prompted the company to bring Arrested Development back from the dead. Another
example comes from one of the biggest mobile carriers in the world. France's Orange launched its Data for
Development project by releasing subscriber data for customers in the Ivory Coast. The 2.5 billion records,
which were made anonymous, included details on calls and text messages exchanged between 5 million users.
Researchers accessed the data and sent Orange proposals for how the data could serve as the foundation for
development projects to improve public health and safety. Proposed projects included one that showed how to
improve public safety by tracking cell phone data to map where people went after emergencies; another showed
how to use cellular data for disease containment.
VI. CONCLUSION
Classification of continuous data is a relatively new research area with almost all prior work done in this
direction on static data. With the increasing size and continuous nature of data, there exist a lot of problems in
classification. Overcoming the problems in continuous data classification has therefore been the focus of many
recent studies. The other area of study is the extension of the various proposed works dedicated at classification
of static data to make them fit for classifying continuous data. This survey discusses some of the recent research
works in the direction of optimizing the prior works or overcoming the problems deduced in continuous data
classification.
REFERENCES
[1] Isabel Brito, Gilles Celeux and Ana Sousa Ferreira, “Combining Methods in Supervised Classification: A
Comparative Study on Discrete and Continuous Problems”, REVSTAT – Statistical Journal, Volume 4,
No. 3, pp. 201–225, 2006.
[2] Jacob Peskoe, “Evaluation of different clustering and classification algorithms for continuous and discrete
datasets”, Project Report, Worcester Polytechnic Institute, Worcester, Massachusetts, 2012.
[3] Myriam Bounhas and Khaled Mellouli, “A Possibilistic Classification Approach To Handle Continuous
Data”, Proceedings of the IEEE/ACS International Conference on Computer Systems and Applications
(AICCSA), pp. 1-8, 2010.
[4] D. Dubois and H. Prade, “Possibility Theory. Qualitative and Quantitative Aspects”, In D. Gabbay and P.
Smets, editors, Handbook on Defeasible Reasoning and Uncertainty Management Systems, vol.1, pp.
[5] D. Dubois and H. Prade, “Possibility Theory: An Approach to computerized Processing of Uncertainty”,
Plenum Press, New York, 1994.
[6] Myriam Bounhas, Mohammad Ghasemi Hamed, Henri Prade, Mathieu Serrurier and Khaled Mellouli,
“Naive possibilistic classifiers for imprecise or uncertain numerical data”, Fuzzy Sets and
Systems-Handling preference, similarity and uncertainty with fuzzy sets (ECSQARU 2011), Volume 239, pp. 137–
156,2011.
[7] M. Bounhas, H. Prade, M. Serrurier and K. Mellouli, “Possibilistic classifiers for uncertain numerical
data”, Proceedings of the 11th European Conference on Symbolic and Quantitative Approaches to
Reasoning with Uncertainty (ECSQARU 2011), Volume LNAI 6777, pp. 434-446, Springer-Verlag, 2011.
[8] Gauthier Doquire and Michel Verleysen, “An Hybrid Approach to Feature Selection for Mixed
Categorical And Continuous Data”, Proceedings of the International Conference on Knowledge Data and
Information Retrieval, pp. 394-401, 2011.
[9] A.R. de Leon, A. Soo and T. Williamson, “Classification with discrete and continuous variables via
general mixed-data models”, Journal of Applied Statistics, Volume 38, Issue 5, pp. 1021-1032, 2011.
[10] Diana Porro Munoz, “Classification of continuous multi-way data via dissimilarity representation”, Thesis
Report, Delft University of Technology, Netherlands, 2013.
[11] Lisa M. Brown, Ankur Datta and Sharathchandra Pankanti, “Tree-Based Vehicle Color Classification
Using Spatial Features on Publicly Available Continuous Data”, Proceedings of the 10th IEEE
International Conference on Advanced Video and Signal Based Surveillance, pp.347-352, 2013.
[12] Dule, E., Gokman, M, Sabur Beratoglu, M., “A Convenient Feature Vector Construction for
Vehicle Color Recognition,” Proceedings of the 11th WSEAS International Conference on Neural
Networks, NN 2010.
[13] Thien Le, Frederic Stahl, João Bártolo Gomes, Mohamed Medhat Gaber and Giuseppe Di Fatta,
“Computationally Efficient Rule-Based Classification for Continuous Streaming Data”, Research and
Development in Intelligent Systems XXXI, pp 21-34, 2014.
[14] J.Cendrowska, “PRISM: an algorithm for inducing modular rules”, International Journal of. Man-Machine
Studies, Volume 27, No. 4, pp. 349–370, 1987.
[15] Maksims Volkovs, Fei Chiang, Jaroslaw Szlichta and Ren´ee J. Miller, “Continuous Data Cleaning”,
Proceedings of the IEEE 30th International Conference on Data Engineering (ICDE), pp. 244-255, 2014.
[16] K.Jeyalakshmi and J.Jenifer, “Optimized Fuzzy Decision Tree for Structured Continuous-Label
Classification”, International Journal of Advances in Computer Science and Technology, Volume 3, No.8,
pp. 432-437, 2014.
[17] Ponkiya Parita and Rohit Srivastava, “Batch -Incremental Classification of Stream Data Using Storage”,
(IJCSIT) International Journal of Computer Science and Information Technologies, Vol. 5, No. 3, pp.