www.orientjchem.org
An International Open Free Access, Peer Reviewed Research Journal
A New Validated RP-HPLC Method for the Determination
of Lumacaftor and Ivacaftor in its Bulk and
Pharmaceutical Dosage Forms
N.MD. AKRAM*
1and M.UMAMAHESH
21Department of Chemistry, Rayalaseema University, Kurnool,
Andhra Pradesh, India.
2Department of Chemistry, RGMCET, Nandyal, Kurnool District,
Andhra Pradesh, India.
*Corresponding author E-mail: [email protected] http://dx.doi.org/10.13005/ojc/330354 (Received: April 22, 2017; Accepted: May 18, 2017)
ABSTRACT
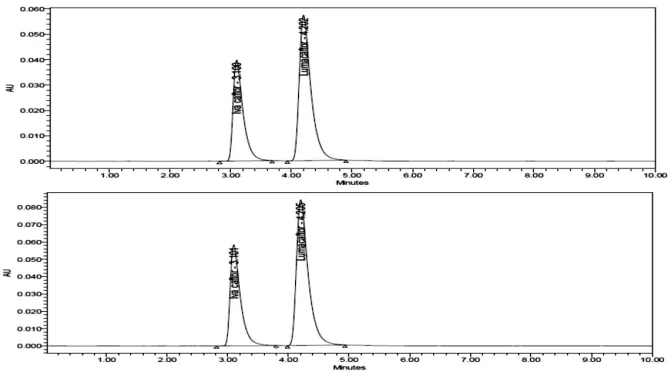
A New method was established for simultaneous estimation of Lumacaftor and Ivacaftor by RP-HPLC method. The chromatographic conditions were successfully developed for the separation of Lumacaftor and Ivacaftorby using Ineertsil ODS column (4.6×250 mm) 5µ, flow rate was 1ml/min, mobile phase ratio (30:10:60v/v) ACN,Methanol,1 ml of OPA in 1000 ml water pH 3 (pH adjusted with triethylamine), detection wavelength used by WATERS HPLC Auto Sampler, Separation module 2695, UV detector 2489, Empower-software version-2. The retention times were found to be 3.101 min. and 4.205mins. The % purity of Ivacaftor and Lumacaftor were found to be 100.17 and100.39 respectively. The present analytical method was validated according to ICH guidelines (ICH, Q2 (R1)). The linearity study of Ivacaftor and Lumacaftor was found in the concentration range 62.5µg/ ml-312.5µg/ml and 100µg/ml-500µg/ml and correlation coefficient (R2) be 0.999 and 0.999, %
recovery was found to be 100.13 and 100.53, % RSD for repeatability 0.8 and 0.8, % RSD for intermediate precision was 0.7 and 0.6respectively. The precision study was precision, robustness and repeatability. It is a convenient, simple and quick method for the determination of Ivacaftor and Lumacaftorin its bulk and pharmaceutical dosage forms.
keywords: Ivacaftor, Lumacaftor, HPLC, Methanol, Acn.
INTRODUCTION
Ivacaftor is Cystic fibrosis is caused by any one of several defects in a protein, cystic fibrosis trans membrane conductance regulator, which regulates fluid flow within cells and affects the components of sweat, digestive fluids, and mucus.
of the CFTR protein. The CFTR protein is a chloride channel present at the surface of epithelial cells in multiple organs. Ivacaftor facilitates increased chloride transport by potentiating the channel-open probability (or gating) of the G551D-CFTR protein.
Lumacaftor I Orkambi is a combination of lumacaftor and ivacaftor, both of which are oral cystic fibrosis transmembrane conductance regulator (CFTR) modulators. The CFTR protein is a chloride channel present at the surface of epithelial cells in multiple. Ivacaftor is currently approved for use in combination with Lumacaftor (as the combination product Orkambi) for the treatment of chronic cysticfibrosis1-4
Literature review reveals that there few HPLC7-13 and HPTLC14-15 methods are available for
the determination of Lumacaftor and Ivacaftor in different dosage forms.
For Lumacaftor and Ivacaftor there are several HPLC17-21 methods available in combined
dosage forms.
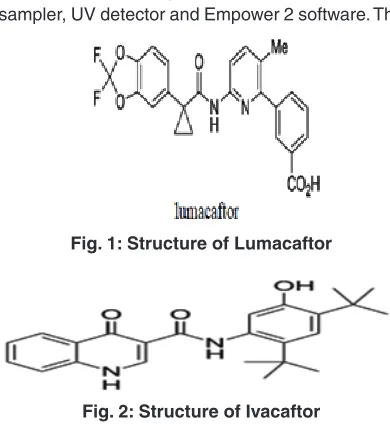
The structures of Lumacaftor and Ivacaftor were shown in figures 1 and 2.
MATERIALS AND METHODS
Instrumentation
The chromatography was performed on a Waters 2695 HPLC system, equipped with an auto sampler, UV detector and Empower 2 software. The
analysis was carried out at 254 nm with an inertsil ODS (4.6 x 250mm, 5mm) dimensions at ambient temperature(250c).
Chemicals and reagents
Ivacaftor and Lumacaftor were supplied fromMylon laboratories, Hyderabad. Ortho phosphoric acid (OPA) (Merck), Methanol(MERCK HPLC grade) Acetonitrile (Molychem, HPLC grade) and Water for HPLC (LICHROSOLV (MERCK). were employed in the present work.
Preparation of solutions Preparation of buffer
1ml of Orthophosphoric acidin1000 ml of HPLC water. The PH is adjusted to 3.0 with TEA. The
final solution is filtered through 0.45mm membrane filter and sonicate it for 10 mins.
Preparation of mobile phase
Accurately measured 600 ml (60%) of PH=3.0 buffer and 300 ml(30%) of Acetonitrile and
100ml(10%) of Methanol. mixed and degassed in an ultrasonic water bath for 10 minutes and then filtered through 0.45 µm membrane filter under vacuum filtration. Figure 4 represents the Chromatograms of mobile phase (blank solution).
Diluent Preparation
The Mobile phase was used as the diluent.
Preparation of standard stock solution
20 mg of Lumacaftor and 12.5 mg of Ivacaftor were accurately weighed and transferred into a 10 ml clean dry volumetric flask. Add about 7 mL of Diluent and sonicate to dissolve it completely and make volume up to the mark with the same solvent.
Further, 1.5 ml of the above prepared stock solution is pipetted into a 10ml volumetric flask and dilute up to the mark with diluent.
Preparation of Sample Solution
Accurately weigh the samples of 10 tablets. It is crushed in mortor and pestle. Transfer equivalent to 20 mg o fLumacaftor and 12.5 mg Ivacaftor sample into a 10 mL clean dry volumetric flask. Add about 7 mL of Diluent and sonicate it up to 30 mins to dissolve it completely and make volume up to the
Fig. 1: Structure of Lumacaftor
mark with the same solvent. Then, it is Filtered through 0.44 micron Injection filter.
Further, pipette 1.5 ml of Lumacaftor and Ivacaftor from the above sample solution into a 10 ml volumetric flask and dilute up to the mark with diluent. The standard solutions were prepared on daily basis from which stock solutions were prepared.
Procedure
20 mL of the standard, stock and sample solution are injected into the chromatographic system. The areas are measured for Lumacaftor and Ivacaftor peaks are calculated. The % Assay by using the standard formula.
Method development and selection of wavelength
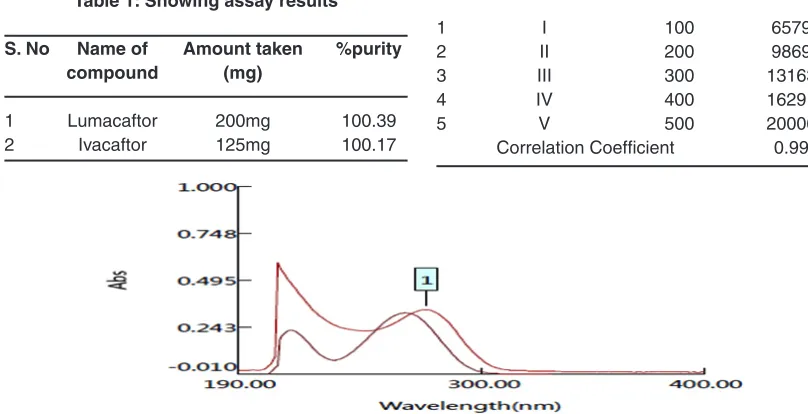
UV spectrum of 10 µg/ml Lumacaftor and 10 µg/ml Ivacaftor in diluents (mobile phase composition) are recorded by scanning in the range of 200nm to 400nm. The UV Spectrum obtain for From the UV spectrum Lumacaftor and Ivacaftor is shown in the figure.1.Form the UV spectrum , the wavelength is selected as 254 nm. At this wavelength both the drugs show good absorbance.
Construction of calibration curve
Aliquots of different concentrations of standard solution were prepared and their chromatograms were recorded at the optimized
chromatographic conditions. The mean peak areas at different concentration levels were calculated from the chromatograms. Then the linearity plot was constructed using the mean peak areas at their respective concentrations. (Figures 8 &9)
Method Of validation
The developed method was validated for linearity, accuracy, precision, and limit of detection, limit of quantitation, robustness and system suitability parameters as described in ICH guidelines.
Linearity
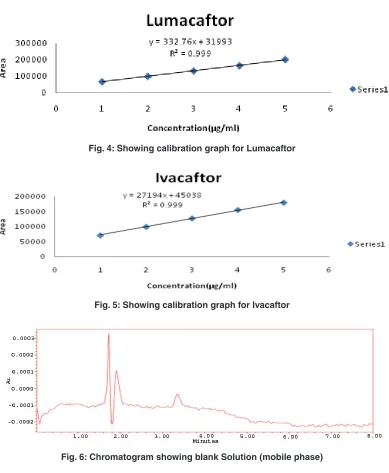
From the stock solution, 100, 200, 300, 400, 500mg/ml solutions for Lumacaftor and 62.5, 125, 187.5,250, 312.5ìg/ml solutions for Ivacaftor were made and their chromatograms were recorded. From the recorded chromatograms, their respective mean peak areas were calculated and the linearity plot was constructed using the mean peak areas at their respective concentrations. The correlation coefficient was found to be 0.999. The linearity data of Lumacaftor and Ivacaftorare shown in the Tables 1 & 2.The calibration plots, are given in the figures 4&5.
Table 1: Showing assay results
S. No Name of Amount taken %purity
compound (mg)
1 Lumacaftor 200mg 100.39
2 Ivacaftor 125mg 100.17
Table 2: Linearity results for Lumacaftor
S. No Linearity Concentration Area
Level (mm/ml)
1 I 100 65792
2 II 200 98696
3 III 300 131638
4 IV 400 162911
5 V 500 200063
Correlation Coefficient 0.999
Table 3: Linearity results for Ivacaftor
S. No Linearity Concentration Area
Level (mm/ml)
1 I 62.5 71267
2 II 125 99725
3 III 187.5 127369
4 IV 250 155275
5 V 312.5 179461
Correlation Coefficient 0.999
Table 4: Linearity results for Ivacaftor
S. No Linearity Concentration Area
Level (mm/ml)
1 I 62.5 71267
2 II 125 99725
3 III 187.5 127369
4 IV 250 155275
5 V 312.5 179461
Correlation Coefficient 0.999
Table5: Showing accuracy results for Lumacaftor
%Concentration Area Amount Added Amount Found % Recovery Mean
(at specification Level) (mg) (mg) Recovery
50% 67838.3 10 10.00 100.02 100.53
100% 136568.7 20 20.13 100.67
150% 205309.3 30 30.27 100.90
Table 6: Showing accuracy results for Ivacaftor
%Concentration Area Amount Added Amount Found % Recovery Mean
(at specification Level) (mg) (mg) Recovery
50% 60620.7 6.25 6.27 100.37 100.13
100% 121845 12.5 12.61 100.87
150% 179676 18.75 18.59 99.16
Precision
Table 7: Showing% RSD results for Lumacaftor and Ivacaftor
Injection Area for Area for
Lumacaftor Ivacaftor
Injection-1 141368 128876
Injection-2 140717 127224
Injection-3 142655 129055
Injection-4 143939 128739
Injection-5 143013 126699
Injection-6 142282 129220
Average 14239 128302.2
Standard Deviation 1156.8 1064.1
%RSD 0.8 0.8
Intermediate precision/Ruggedness
Table 8: Showing results for intermediate precision of Lumacaftor and Ivacaftor
Injection Area for Area for
Lumacaftor Ivacaftor
Injection-1 139453 122535
Injection-2 137162 121224
Injection-3 139458 122915
Injection-4 138377 123391
Injection-5 138482 123108
Injection-6 139771 122959
Average 138783.8 122688.7
Standard Deviation 976.1 769.7
%RSD 0.7 0.6
RESULTS AND DISCUSSION
The present investigation reported by the authors are to develop a new validated method for the
Fig. 5: Showing calibration graph for Ivacaftor Fig. 4: Showing calibration graph for Lumacaftor
Fig. 6: Chromatogram showing blank Solution (mobile phase)
Fig. 8: Chromatogram showing standard of sample injection
-Fig. 9.a,b Level 1,2 Chromatograms showing Linearity of Lumacaftor and Ivacaftor
Fig 9.e. Level 5 Chromatograms showing Linearity of Lumacaftor and Ivacaftor
It is used as diluent in the present study. An intersil ODS column of 5m (4.6X250mm) is employed for the simultaneous determination of Lumacaftor and Ivacaftor by RP-HPLC method. A flow rate of 1ml for minute is used in this method. UV detection wavelength at 254 mm and temperature of 25oC
were maintained. Two sharp peaks were absorbed at 3.101mts and 4.025 mts for Ivacaftor and Lumacaftor respectively. The representative chromatograms of blank solution, Lumacaftor and Ivacaftor shown in this figure.4 Chromatograms of assay of sample injection and standard of sample injection are shown
Fig. 10: Chromatogram showing less flow rate
Table 9: System suitability results for Lumacaftor
S. Flow Rate System Suitability Results No. (ml/min)
USP Plate Count USP Tailing
1 0.9 2910 1.16
2 1.0 2310.88 1.58
3 1.1 2245.12 1.13
Table 10: System suitability results for Ivacaftor
S. Flow Rate System Suitability Results
No. (ml/min)
USP Plate USP USP
Count Tailing Resolution
1 0.9 3425.70 1.19 3.62
2 1.0 2693.11 1.16 3.43
3 1.1 2675.84 1.17 3.35
* Results for actual flow (1.0ml/min) have been
considered from Assay standard. in the figures 5 & 6 and assay results of purity in the
table 1. The % purity of Lumacaftor and Ivacaftor were found to be 100.39 and 100.17 respectively.
Linearity
F i g u r e s 7 a t o 7 e r e p r e s e n t t h e chromatograms showing different linearity levels with different concentrations of Lumacaftor and Ivacaftor and results of given in the tables 2 & 3. Both Lumacaftor and Ivacaftor obey Beer Lamberts Law in the range of concentrations of 100µg /ml to 500 µg /ml and 62.5µg /ml to 312.5µg/ml respectively with regression equations Y= 332.76 X + 31993(correlation and coefficient) R2= 0.999 for Lumacaftor and Y= 27194 X +
45038 , R2= 0.999. for Ivacaftor.
Precision
This validated method is more precise and the percentage of relative standardization (%RSD) and intermediate precision / Ruggedness were found to be 0.8 and 0.7 for Lumacaftor and 0.8 and 0.6 for Ivacaftor . The results are given the in the tables 6 and 7.
System suitability
The results for Lumacaftor and Ivacaftor are given in the tables 473. It was performed to ensure that complete testing system was suitable for the intended application. The USP tailing factor
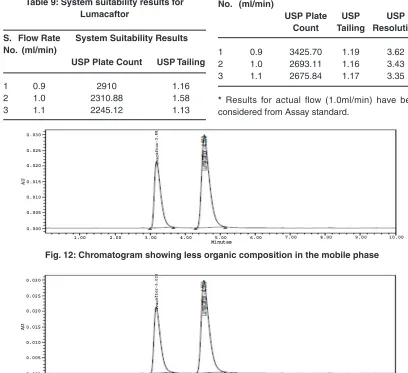
Fig. 12: Chromatogram showing less organic composition in the mobile phase
Table 11: Showing system suitability results for Lumacaftor
S. Change in Organic System Suitability
No. Composition in the Results
Mobile Phase
USP Plate USP
Count Tailing
1 10% less 2425.70 1.21 2 *Actual 2310.88 1.58 3 10% more 2705.45 1.12
Table 12: Showing system suitability results for Ivacaftor
S. No Change in Organic System Suitability Results
Composition in the Mobile Phase
USP Plate Count USP Tailing USP Resolution
1 10% less 2910.66 1.16 3.61
2 *Actual 2693.11 1.16 3.43
3 10% more 2248.50 1.12 2.96
for Lumacaftor and Ivacaftor were 1.58 and 1.15 which is <2 and the USP plate found were 2693.56 and 2310.88 which is >2000 the results for actual flow of 1.0 ml/min is considered from assay standard. Tablets for all shows system suitability results with
change in the organic composition in the mobile phase for Lumacaftor and Ivacaftor chromatograms of and Lumacaftor and Ivacaftor are show in the figures 12 and 13.
Accuracy
The accuracy study was performed for 50%, 100% and 150 % for Lumacaftor and Ivacaftor. Each level was injected in triplicate into chromatographic system. The area of each level was used for calculation of % recovery. These results were given in the tables 4 & 5. The Mean % of recovery is 100.53 for Lumacaftor and 100.13 for Ivacaftor. (NLT 98% and NMT 102%)
Accuracy
The accuracy study was performed for 50%, 100% and 150 % for Lumacaftor and Ivacaftor. Each
Fig. 14: Chromatogram showing LOD
level was injected in triplicate into chromatographic system. The area of each level was used for calculation of % recovery.
The accuracy results for Lumacaftor Detection limit
As per ICH guidelience S/N Ratio value shall be 3 for LOD solution.
As per ICH guidelience S/N Ratio value shall be 10 for LOQ solution.
CONCLUSION
The proposed HPLC method was found to be simple, precise, accurate and sensitive for
the simultaneous estimation of Lumacaftor and Ivacaftorin pharmaceutical dosage forms. The results are accordance with ICH guidelines. Hence, this method can easily and conveniently adopt for routine quality control analysis of Lumacaftor and Ivacaftor in pure and its pharmaceutical dosage forms.
ACKNOWLEDGEMENT
Authors are thankful to the Pharma Train Lab, Kukatpally, for providing instrumental and analytical support. We extended our thanks to the Principal and Management for their timely help.
REFERENCES
1. Alter, M.J.; Hepatology. 1997, 26, 62-65
2. Benhamou, Y.; DeMartinio, V.; Bochet, M.; Colombet, G.; Thibault, V.; Liou, A.; Katlama, C. Hepatology, 34, 283-287
3. "Elbasvir Hydrochloride". The American Society of Health-System Pharmacists. Retrieved Jan 2016.
4. Hirst, J.; Farmer, A. J.; Ali, R.; Roberts, N. W.; Stevens, R. J. 2012, 35(2), 446-54
5. Lilian, B. A. R.; Marilia, B. G. Elbasvir: an old but still the best treatment for type 2 diabetes,
2013
6. Arayne, M. S.; Najma S.; Hashim, Z. Pak. J. Pharm. Sci., 2006, 19(3), 231-235.
7. Teng, X .W.; Foe, K.; Brown, K.; Cutler, D. J.; Davies; J. Pharm. Biomedi. Anal. 2001,
26, 313-19
8. Shaikh, S.; Muneera, M.S,; Thusleem, O.A Orient. J. Chem., 2013, 29(2), 579-587.
9. Kondaguli, A.V. Jour. of Chromatographic Sci., 2009, 47(2), 178-183
10. Ravi, R. Y.; Manoj, D. R., Deepali M. G.; Ganesh S. Holkar. Intern. Jour. of Theo. & Appl.Sci. 2012, 4(2), 145-156
11. Kabeer, A. S.; Ashish, T. P. Jour. of Trace Analysis in Food and Drugs, 2013, 1,
14-21
12. Yadav, R.R.; Rokade, M.D.; Salunke, S.A.; Gangrade, R.M.; . Holkar, G.S. V.N. Biological Forum – An Int. Jour. 2009, 4(21),
1128(-21071
13. Hiral, N. D.; Ashlesha, G. M.; Chaitanya, B.; Killambi, P. k.; Inter. Jour. of App. Sci. and Eng. 2011, 9, 177-185
14. Ravi, G.; Padmakar, A.; Sudesh, B.; Biological Forum – An International Jour. 2013, 5(1),
33-41
15. Heidurnezhad, Z,; Heydari, F.; Bahranian, E. Orient. J. Chem., 2013, 29(1), 69-74
16. Rajesh, M. K.; Santosh, G. S.; Shrawan, S.; E-Jour. of Chem., 2011, 8, 340-346
17. Soleymani, R.; Dehgharian, A.; Ebtesam, S., Orient J. Chem., 2012, 28(4), 1291-1304
18. Abdollahpour, A.; Forouhi, M.; Shamsipur, M.; Yamini, Y. J. Iran. Chem. Soc., 2010, 7,
516-520
19. Holkar, G.S.; Rokade, M.D.; Yadav, R.R.; Daphal, V.N.; Int. Jour.of Theo. & App. Sci.,
2012, 4(2), 56-65
20. Gopalakrishnan, S.; Chitra, T.A.; Aruna, A.; Chenthilnathan, A. Der. Pharma. Chemica,
2002, 4, 1003-1015