5747 IJSTR©2020
Identification of Bergman Minimal Model
Parameters in Sprague-Dawley Rats by novel
GWBMO algorithm
Ekta Makhija1, Prof. Dinesh Raj Modi2Abstract—The blood glucose level in the Diabetes patient was vastly analyzed by biotechnologists. Several mathematical models have been devised for evaluating the dynamics of glucose. The major fundamental research for the insulin infusion automation in the control algorithm optimization. The dynamics of the glucose–insulin is affected by the intake of meal which indicated the importance of the investigation. The work attempts for the determination of the parameters in the Bergman minimal model through Grey Wolf Bergman Minimal Optimization (GWBMO) algorithm. The selected model comprehensively mimics the physiological activities of the human body and requires the proposed GWBMO for the process of optimization. The paper considered injected insulin amount and glucose measurements once every five minutes from the continuous subcutaneous sensor. The twenty iterations were carried out in vivo experiments from 19 rats which were induced with streptozotocin have been referred and considered in this study. The performance of the proposed GWBMO is compared with the existing Genetic Algorithm (GA) and Bergman Chicken Flock Optimization (BCFO) algorithm by means of various performance measures like RMSE, MDPE, MDAPE and WOBBLE. The proposed experimental setup exhibits enhanced efficiency when compared to the existing algorithms and could be widely utilized for the identification of the real time parameter for the insulin infusion optimization system.
Index Terms— Blood glucose level, Diabetes, Bergman minimal model, Grey Wolf Bergman Minimal Optimization (GWBMO) algorithm, streptozotocin, Genetic Algorithm (GA) and Bergman Chicken Flock Optimization (BCFO) algorithm.
—————————— ——————————
1 I
NTRODUCTIONA metabolic type of disease which is caused due to the defects occurred in the proper secretion of insulin by the beta cells of pancreas is known with the name of diabetes mellitus. When diabetes is occurred in a person, he/she lacks with the ability to make use of glucose and thus results in increasing the level glucose in the blood. The level of glucose in the blood is measured by performing proper fasting before the examination of blood glucose level and is measured by means of plasma glucose or glycated hemoglobin. (Association, 2017) There are various types of diabetes that are commonly occurring among people like:
Diabetes type 1 – which is caused by the destruction of autoimmune beta cells and this results in the deficiency of insulin in the blood which possess the ability to regulate the glucose level in blood.
Diabetes type 2 – which is caused because of the loss occurred in the secretion of b cell type of insulin and is often related to the lower resistance of insulin secreted.
GDM (i.e.) Gestational Diabetes Mellitus – occurs mainly among the pregnant women during the second or third trimester. A trimester is a period of around 13 weeks during the pregnancy period.
And finally various other types of diabetes which are
caused because of different reasons like observed in monogenic type of diabetes which are occurred only among the young children which are referred as MODY (i.e.) Maturity Onset Diabetes of Young, exocrine pancreatic disease like in the cystic fibrosis condition and at last the diabetes caused by inducing the chemical or drugs which are observed in cases like glucocorticoid application, for diagnosing deadly conditions like HIV, drug induced after the transplantation of an organ and in animals like rats for the experimental point of view.
Autoimmune diabetes or type 1 diabetes (Katsarou et al., 2017) is a chronic type of disease that are recognized by the deficiency of insulin due to the loss or damages in the beta cells of pancreas. The inception of this type of diabetes occurs at the very earlier age like during the adolescence period or also during the time of childhood in some very rare cases. But symptoms to this type of diabetes might develops very slowly. Type 1 diabetes might develop much before the years or months of inception of the symptoms associated with the type 1 diabetes. The individuals who are likely to possess higher risk of developing type 1 diabetes are identified and utilized for the research point of view. Based on the genetic factors and environmental triggering, the type of antibody that appears first in the affected person is decided. There are three different categories present in the pathogenesis of type 1 diabetes based on the condition of hyperglycemia and symptoms related to hyperglycemia. Permanent cure to this diabetes type is not possible and the affected persons should rely on insulin injections for their entire life. (Marso et al., 2016) Similarly, type 2 diabetes is a metabolic type of condition that is recognized by the hyperglycemia condition and the symptoms related to the
Ekta Makhija
Affiliation: Department of Biotechnology, School of life sciences, Babasaheb Bhimrao Ambedkar University, Lucknow
Email id: [email protected]
Co-Author Prof. Dinesh Raj Modi
5748
complications like microvascular, cardiovascular and several other heart diseases. By reducing the risk existing in microvascular condition, the glycemic level can be regulated and there is very lower rate of benefits observed in the regulation of glycemic level in macro vascular condition. A problem is present in the secure treatment or therapies related to the anti-hyperglycemic condition. Cardiovascular safety measures of modern treatment techniques for diabetes are instructed by the regulatory authorities which looks onto these issues. During the course of the diabetic (Schwartzbaum et al., 2017) diseases, an infected person can undergo the screening tests for diabetes for numerous times. After the completion of this diagnosis, the risk of glioma in the affected patients are also tested by using the appropriate treatment techniques. (Goel, Parkhi, Barua, Shah, & Ghaskadbi, 2018) The increase in the blood glucose level is determined based on the release of hepatic in the blood glucose followed by the consumption of food and similarly the disposal of hepatic is performed based on the clearance of insulin based peripheral tissue and various other insulin based independent tissues.
Figure 1. Illustration of Bergman Minimal Model
Multi cooperative optimization such as Grey Wolf Bergman Model Optimization (GWBMO) permits better ability of search than the PSO algorithm, existing BCFO algorithm and other traditional techniques on the basis of gradient method and least square method. [6] Complications have been reported regarding estimation of parameter that includes correlation between action parameters insulin sensitivity. The objective was to minimize the problem through modifying the input of glucose in the test.
A. Objective
• To identify the parameters of the Type 1 Diabetic Mellitus (T1DM) condition.
• To perform Grey Wolf Bergman Model Optimization (GWBMO) for predicting the parameters range. • To analyze the efficiency of the proposed system by
comparing with various state of the art approaches and existing technique of BCFO.
B. Organization of Paper
The remaining division is specified as mentioned below: Section II provides the brief explanation of the existing methods relevant to the research work. Section III deliberates the implementation process of the proposed GWBMO algorithm for estimating the range of parameters. Section IV illustrates the comparative investigation of projected methodology with the prevailing methods and accomplishes the objectives of the research paper depending upon the results attained at the end of the examination. Section V concludes research paper by summing up the entire process carried out in the paper.
2 RELATED WORKS
5749 IJSTR©2020
intake of glucose. A benchmark in the circulation of Tscm is attained by the increased expression of GLUT1 among the type 1 diabetes patients. The intake of glucose is targeted through GLUT-1 which makes use of appropriate suitable inhibitor WZB117 and therefore results in inhibiting expansion and generation of Tscm. (Julia Townson et al., 2018) Free text type of investigation and qualitative study was carried out among 21 different parents whose child were diagnosed with the condition of diabetes type 1, 60 different parents whose children were not diagnosed with the same diabetes type 1 condition, ( staffs in the primary healthcare, 9 teachers and 3 nurses who are specialized in diabetes. Two very significant themes like the significance of knowledge and awareness about availing the aid of healthcare staffs if necessary. The parents whose children were identified with diabetes type 1 stated that they preferred to get opinion from various people before discussing with the professional health care staffs. The staff in healthcare know about their responsibility in detecting diabetes condition in very young children. Getting a job in the primary healthcare is recognized as one of the most difficult and responsible task. Mostly, parents of the children affected with diabetes type 1 prefer to get a day time slot for inspecting their children. (J Townson et al., 2017) designed, developed and determined the possibility of conveying an intervention depending upon the multi component community which brings awareness to parents and the staffs in health care regarding the symptoms of diabetes type 1 disorder among the children in the country of South Wales. Qualitative type of interviews were conducted among the parents and stakeholders regarding the possibility, acceptability and effect of the proposed intervention were determined. Based on the traffic systems in the road with red triangles that indicate the warning sign and octagon shaped stop sign which states to obtain medical aid, the parent component of proposed intervention possess a recyclable bag which comprise of 4 very significant symptoms of type 1 diabetes. The bag was accompanied with an A5 leaflet that provides with additional data. The bag along with the leaflet was given to 323 schools out of total 329 schools which implies a total percentage of about 98 and comprise of totally 1,01,371 children. Components present in the primary health care component were dual glucose as well as ketone meter, lancets which can be used only once, parent leaflets, stickers and visit of nurse in the community diabetes liaison in order detect the type 1 diabetes among the children. (Cescon et al., 2016) designed an innovative algorithm for providing a suitable warning to the patient at the inception of developing the infusion set failure depending on the values of glucose sensors that are generated in a continuous manner and the supply of insulin through the usage of insulin pump. Performance and efficiency of the suggested technique was determined at the period of 12 weeks in infusion set wear without any shortcomings document among 4 different patients in the condition of ambulatory and the technique was verified during 18 weeks of infusion set wear among 9 different subjects in the same condition of ambulatory. The recommended algorithm have attained a resultant of about 50 % of sensitivity, 66 % of specificity and 55 % of accuracy. (Ahmed, Ahmed, Arafa, & Salah, 2018)
analyzed the performance of RV myocardial in the asymptomatic type 1 diabetes mellitus by making use of standard echo parameters and speckle tracking for associating it with functional capacity through the employment of treadmill stress test. The test was conducted among 39 different victims of type 1 diabetes without any risk of cardiac arrests and among 15 healthy persons were registered as samples for the control group. Through the aid of traditional tracking techniques like tissue Doppler and 2D speckle tracking echocardiography (i.e.) 2D-STE, RV function value was determined. Then similarly, the peak value of RV global longitudinal strain (i.e.) RV-GLS was also determined. The treadmill exercise test was utilized for accessing the functional capacity value and the value of METs (i.e.) Metabolic Equivalents were determined.
(Townsend & Seron, 2017) The optimality of unrestricted pulse that are given as input to the Bergman minimal model are characterized based on the performance of plasma glucose concentration for a particular category of disruption. Based on the limitations possessed by the glucose concentration, the results are attained under a particular minimum value and the input to the model is in the rectangular shape. (Campos-Náñez, Layne, & Zisser, 2018) analyzed the silico population among different children, teenagers and grown up adults through the usage of UVA/PADOVA Type 1 Diabetes Simulator. The value of concentration of glucose for the normal person who was not affected with diabetes was found to have 120 mg/dL (6.7 mmol/L). After the gap of 1 hour of simulated time, two significant circumstances like basal insulin infusion rates in increments of 0.01 U/h were administered and bolus doses in increments of 0.01 U were injected. The delivery of insulin for modifying the blood glucose to 12.5 mg/dL followed by 25 mg/dL only if 5% of
5750
system contribute towards the proposed algorithm’s efficiency. (Kohli & Arora, 2018) in order to elevate the global convergence speed, implemented an innovative chaos theory into GWO algorithm in the research work. With the aid of ten dissimilar chaotic maps, a brief investigation was performed on 13 different standard and limited benchmark issues for determining the most effective map. The performance of proposed chaotic based GWO was compared to the performances of conventional GWO and also with many other meta-heuristics techniques like FAO (i.e.) Firefly Algorithm Optimization, FPO Algorithm (i.e.) Flower Pollination Optimization and PSO Algorithm (i.e.) Particle Swarm Optimization. Efficiency of CGWO algorithm is validated based on five different issues related to design.
3 PROPOSED WORK
3.1 MethodologyAn experiment (Gallardo-Hernández et al., 2019) is referred and considered where the diabetes mellitus disease is injected or induced into 19 different overnight fasted Sprague-Dawley category of female rats through the injection of strepzotocin intraperitoneal chemical. These rats weigh around the range of 250 – 300 grams. The level of glucose in the blood is measured in interval of every 5 minutes through the continuous subcutaneous sensor and this is the most significant step involved in the algorithm that is taken into consideration in the proposed work. The experiments are carried out for determining the model parameters for 20 different iterations with higher accuracy on 19 rats considered for the experimentations. RMS error present among the expected and actually measured glucose concentrated is also evaluated. Model parameters are altered due to the
experimental setting or life change settings and further calculations are performed based on the amount of insulin injected and the glucose sensor.
Bergman Minimal Model
Bergman Minimal Model (BMM) is a very simple model and considered to be a very helpful one among various techniques available for describing the GI setup. The regulatory system of GI is explained in a detailed manner through the BMM model. This model is first introduced in the year of 1979 by Bergman for the easier understanding of effects caused due to the sensitivity and secretion of insulin, risk of diabetes, and the tolerant ability of glucose. Kinetic understanding of insulin is enabled by assuming the leads of T2DM. Moreover, the cause for the failure of beta cells in the diagnosis of diabetes is concentrated. Equations involved in the BMM model are:
B
̂ = −s (B − B ) − BY (1)
Y
̂ = −s Y + s (J − J ) (2)
Ĵ = −m(J − J ) + γ[B − h] t + u(t) (3)
Where Ĵ B̂ and Ŷ indicates the plasma insulin
concentration in µU/ml, plasma glucose concentration (mg/ml) and the insulin mediated concentration of glucose reduction
correspondingly. B and J are the plasma glucose and insulin
concentration u(t) basal values that signified the insulin infusion
rate. S1 denotes the rate of insulin independent glucose
disappearance (min-1), also known as glucose effectiveness (PB), S2 is the rate of sudden reduction witnessed the ability of tissue in the uptake of glucose (min-1).
5751 IJSTR©2020
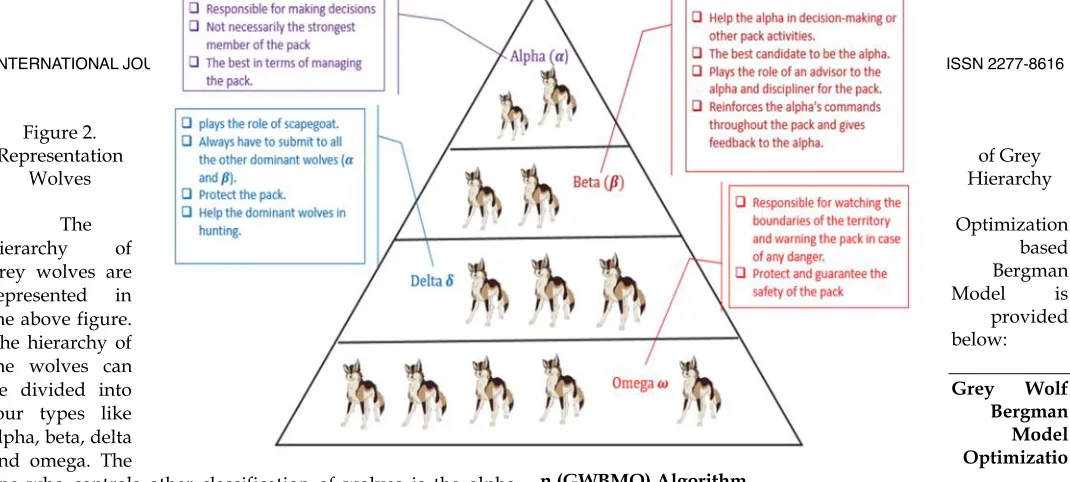
Figure 2.
Representation of Grey
Wolves Hierarchy
The hierarchy of grey wolves are represented in the above figure. The hierarchy of the wolves can be divided into four types like alpha, beta, delta and omega. The
one who controls other classification of wolves is the alpha type of wolves. The decisions are made by the alpha wolves. Hence best and optimal candidate solutions are exhibited by these classification of wolves. Then the beta category wolves provides assistance to its higher level alpha wolves for making important decisions and forms a bridge between the higher alpha wolves and the remaining wolves that are lower to the beta type of wolves. Therefore second best optimal candidate solutions are generated by them. Then important informations are delivered to the upper alpha and beta wolves by the delta wolves. Third best optimal candidate solutions are generated by them. Then the last category of omega level grants information to all its higher level wolves. The reminder of optimal candidate solutions are generated by these omega wolves.
This optimization algorithm was devised depending upon the social governing order possessed by the grey wolves and pack hunting behavior of the wolves. The key steps involved in the hunting behavior of grey wolves are:
The ability to track, chase and approach the targeted prey.
Then it surrounds the prey in all directions and harasses the prey until it stops to move around.
Finally, the wolf attacks the prey. Advantages of GWO algorithm over GA
GWO algorithm consists of benefits like minimized control parameters, increased accuracy of the solutions and higher rate of convergence speed. On comparing with traditional meta-heuristics genetic optimization algorithm, the GWO exhibits great capability for exploring and enhanced convergence rate. Because of the simple nature and easier to employ this algorithm, it has achieved notable attention and was utilized for resolving numerous optimization related issues ever since the invention of GWO.
3.3 Grey Wolf Bergman Model Optimization (GWBMO) Algorithm
The algorithm for the proposed Grey Wolf
Optimization based Bergman Model is provided below:
Grey Wolf Bergman Model Optimizatio n (GWBMO) Algorithm
Step 1:
Initialize position of the grey wolves by the random values,
𝐺(𝑖 = 1 2 … 𝑔 )
Maximum iteration, 𝑀𝑎 = 500
Lower Bound , 𝑏𝑜𝑢𝑛𝑑 = −100 Upper Bound, 𝑏𝑜𝑢𝑛𝑑 = 100
Initialize 𝛼 𝛽 , 𝛿 and 𝜔
Step 2: repeat the process until maximum iterations,
𝑊𝑖𝑙𝑒 𝑡 < 𝑀𝑎
𝑢𝑏 = {1 𝐺 > 𝑏𝑜𝑢𝑛𝑑 0 𝑒𝑙𝑠𝑒 𝑙𝑏 = {1 𝐺 < 𝑏𝑜𝑢𝑛𝑑
0 𝑒𝑙𝑠𝑒
Update the position based on the updating 𝑢𝑏 and 𝑙𝑏
𝑔 = 𝐺 ∗ (𝑢𝑏 − 𝑙𝑏) + (𝑏𝑜𝑢𝑛𝑑 ∗ 𝑢𝑏) + (𝑏𝑜𝑢𝑛𝑑 ∗ 𝑙𝑏)
Step 3:
Perform objective function based on estimation of error rate for the updated parameters,
𝑅𝑀𝑆𝐸(𝑔 𝑔 ) = √∑ (𝑔 𝑔 )
𝑚
𝑔 = (1 − 𝑇𝑠 )(𝑔 − 𝐵 ) − 𝑇𝑔𝑌
𝑌 = (1 − 𝑇𝑠 )𝑌+ 𝑇𝑠 (𝐽 − 𝐽 )
𝐽 = 𝐽 − 𝑛𝑇(𝐽 − 𝐽 ) + 𝑇𝑢
Step 4:
Update wolves score and position, For alpha wolves,
𝛼 = 𝑅𝑀𝑆𝐸(𝑔 𝑔
) 𝛼 = 𝑔 𝑖𝑓 𝐹𝑖𝑡 < 𝛼
For beta wolves,
𝛽 = 𝑅𝑀𝑆𝐸(𝑔 𝑔 ) 𝛽 = 𝐺 𝑖𝑓 𝑅𝑀𝑆𝐸(𝑔 𝑔 ) >
𝛼 && 𝑅𝑀𝑆𝐸(𝑔 𝑔
) < 𝛽
For delta wolves,
𝑖𝑓 𝑅𝑀𝑆𝐸(𝑔 𝑔 ) > 𝛼 && 𝑅𝑀𝑆𝐸(𝑔 𝑔 ) > 𝛽 && 𝑅𝑀𝑆𝐸(𝑔 𝑔 ) < 𝛿
𝛿 = 𝑅𝑀𝑆𝐸(𝑔 𝑔 ) 𝛿 = 𝐺
For omega wolves,
5752
𝜔 = 𝑅𝑀𝑆𝐸(𝑔 𝑔
) 𝜔 = 𝐺
Step 5: Update overall position of Wolves, Calculate two parameters,
𝑎 = 2 − 𝑡 ∗ (
)
𝐴 = (2 ∗ 𝑎 ∗ 𝑟𝑎𝑛𝑑(1 1)) − 𝑎
𝐶 = 2 ∗ 𝑟𝑎𝑛𝑑(1 1)
Position updated using formed wolves positions,
𝐺 = 𝛼 − (
| ∗( )|)
The same process is applied for all wolves and estimated 𝐺,
𝐺 and 𝐺
𝐺 =( )
Step 6: Agent position and best agent are estimated based on the updating wolves positions,
𝑊𝑜𝑙𝑓 =
∑ ( ) 𝐵𝑒𝑠𝑡 = {1 𝑊𝑜𝑙𝑓 > 𝛼
0 𝑒𝑙𝑠𝑒
End while
Step 7: This process is repeated for all iterations and obtained the final solutions which provided minimum number of agents.
𝐵𝑒𝑠𝑡 = min(𝐵𝑒𝑠𝑡 ) ∀ 𝑡 = 1 2 … 𝑖𝑡𝑒𝑟
The position of grey wolves are assigned with random values from 1 to 𝑔 . The upper and lower limit is set
as (100, -100) for the maximum of 500 iterations. The process is repeated unless maximum iterations are attained. The values of lower bound 𝑙𝑏 and upper bound 𝑢𝑏 are updated based on the position. The objectives of functions are performed depending upon on estimation of error rate for the updated parameters. The wolves score and position are updated for each type of wolves like alpha, beta, delta and omega wolves separately. The overall position of the wolves are get updated based on the two parameters. Position of the agent and best optimal agent are determined depending upon the updated position of wolves. This algorithmic procedure is repeated for numerous iterations and minimum number of agents are provided by obtaining the final solutions for the last iteration.
4 PERFORMANCE ANALYSIS
The performance of the proposed GWBMO algorithm is analyzed by means of various performance measures like RMSE, MDPE, MDAPE and WOBBLE and is compared to the same performance measures of existing Genetic Algorithm (GA), Bergman Chicken Flock Optimization (BCFO) and the efficiency
TABLE 1:IDENTIFICATION RESULTS WITH N, P2, P3 AS UNKNOWN PARAMETERS FOR RMSE AND MDPE MEASURES
Individual Disappearance
rate of
Endogenous insulin
Rate of
spontaneous decrease of tissue glucose
Insulin-Dependent increase in tissue Glucose
RMSE MDPE
Existing GA
BCFO GWBMO Existing
GA
BCFO GWBMO
1 0.03 0.0312 0.274x10⁻³ 16.68 7.0700 0.5707 4.88 -0.7369 -1.3697
2 0.05 0.0457
0.164x10⁻³
14.46 6.4360 1.7571 1.87 -1.1891 -2.9412
3 0.07 0.0716
0.510x10⁻³
10.62 7.3058 1.2113 1.29 -1.2250 2.6914
4 0.01 0.0002
0.075x10⁻³
7.16 8.4672 2.7843 8.48 -1.1586 7.2713
5 0.21 0.0432
0.510·x10-3
21.7 5.9159 16.5158 −0.56 -0.0583 -8.6976
6 0.07 0.0664
0.289x10⁻³
19.97 6.4026 1.6094 0.32 -1.4681 5.5329
7 0.09 0.1373
0.231x10⁻³
17.87 6.6478 0.5707 2.85 -1.0202 -1.3697
8 0.01 0.0086
0.206x10⁻³
5.7 5.4038 3.1347 0.23 -0.4882 0.5002
9 0.07 0.0552
0.494x10⁻³
9.88 6.7978 1.1172 −0.51 -1.1518 1.603
10 0.01 0.0146
0.510x10⁻³
30.49 6.5822 3.1198 −7.91 -0.5803 1.6575
11 0.01 0.0114
0.428x10⁻³
11.87 7.2023 2.4465 1.88 -1.2354 0.937
5753 IJSTR©2020
3
13 0.06 0.0002
0.220x10⁻³
9.22 8.0215 1.1146 3.04 -1.0778 -1.9014
14 0.01 0.0001
0.156x10⁻³
21.42 7.1052 16.5158 −0.79 -1.0526 -8.6976
15 0.02 0.0257
0.397x10⁻³
18.52 7.9503 0.1094 1.35 -1.1022 0.0656
16 0.04 0.0342
0.490x10⁻³
15.16 6.5408 3.7829 0.55 -1.0261 17.2354
17 0.03 0.0234
0.079x10⁻³
21.31 6.2800 2.7843 −0.35 -0.9397 7.2713
18 0.02 0.0127
0.087x10⁻³
21.72 6.3632 1.6094 2.79 -0.7742 5.5329
19 0.37 0.0096
0.339x10⁻³
14.84 6.4111 6.6203 −2.64 -0.6895 -8.4482
20 0.04 0.0415
0.222x10⁻³
18.93 7.3021 1.5557 2.74 -1.4487 3.3835
mean 0.06 0.0327 0.30x10⁻³ 15.76 6.81 3.50 2.40 -0.99 0.92
TABLE 2:IDENTIFICATION RESULTS WITH N, P2, P3 AS UNKNOWN PARAMETERS FOR MDAPE AND WOBBLE MEASURES
Indivitual Disappearan
ce rate of Endogenous insulin
Rate of spontaneou s decrease of tissue glucose
Insulin-Dependent increase in tissue Glucose
MDAPE WOBBLE
Existing GA
BCFO GWBMO Existing
GA
BCFO GWBMO
1 0.03 0.0312 0.274x10⁻³ 9.54 1.3023 1.3543 4.67 2.0392 2.724
2 0.05 0.0457
0.164x10⁻³
8.96 1.2622 2.9308 7.09 2.4513 5.872
3 0.07 0.0716
0.510x10⁻³
3.41 1.8152 2.6771 2.11 3.0401 -0.0143
4 0.01 0.0002
0.075x10⁻³
17.47 1.5640 -7.2811 8.98 2.7226 0.0098
5 0.21 0.0432 0.510·x10
-3
5.78 1.4618 8.6986 6.34 1.5201 1.7396
6 0.07 0.0664
0.289x10⁻³
7.34 2.0032 -5.5477 7.02 3.4712 0.0148
7 0.09 0.1373
0.231x10⁻³
6.28 1.9212 1.3543 3.43 2.9414 2.724
8 0.01 0.0086
0.206x10⁻³
1.15 0.7358 -7.5069 0.92 1.2240 0.0068
9 0.07 0.0552
0.494x10⁻³
4.69 1.7359 1.6205 5.2 2.8876 0.0175
10 0.01 0.0146
0.510x10⁻³
28.59 1.8153 8.64 36.5 2.3955 -0.0175
11 0.01 0.0114
0.428x10⁻³
6.46 1.2516 0.9567 4.57 2.4869 0.0197
12 0.05 0.021
0.289x10⁻³
3.86 1.4058 1.8882 2.47 2.8117 3.7896
13 0.06 0.0002
0.220x10⁻³
4.19 1.5642 -1.8882 1.15 2.6420 3.7896
14 0.01 0.0001
0.156x10⁻³
8.32 1.6713 -8.6986 9.11 2.7240 17.3963
15 0.02 0.0257
0.397x10⁻³
5754
16 0.04 0.0342
0.490x10⁻³
5.68 1.9492 1.2182 5.12 2.9753 -0.0172
17 0.03 0.0234
0.079x10⁻³
6.84 1.2384 7.2811 7.19 2.1780 0.0098
18 0.02 0.0127
0.087x10⁻³
7.01 1.1787 5.5477 4.22 1.9529 0.0148
19 0.37 0.0096
0.339x10⁻³
6.03 0.8955 0.4493 8.67 1.5850 1.6897
20 0.04 0.0415
0.222x10⁻³
7.13 1.5657 0.3791 4.4 3.0144 -0.0044
mean 0.06 0.0327 0.30x10⁻³ 7.85 1.47 0.71 6.81 2.46 1.99
The performance of the proposed GWBMO algorithms is represented in table 2 and 3 in which the experimental glucose sensor analysis have been compared with the framed model result. The RMS error mean value is found to be 3.50 mg/dl of glucose concentration for the proposed BCFO, whereas the mean value for the existing BCFO and GA is 15.76 mg/dl and 6.81 mg/dl of the concentration of glucose with the occurred outliers due to unpredictable external perturbations that affected both the glucose and sensing criteria of population. The performance measures of Varvel were manipulated and the percentage prediction error that Median Absolute Performance Error(inaccuracy), Median Prediction Error(bias), Wobble(variability) in all the individual. The mentioned results were shown as follows.
The proposed GWBMO for the identified the BMM parameters since the method comprised non linear terms like X(t) and I(t) which are sufficiently not available for the estimation. The gradient based algorithms and least square cannot be utilized for the identification of the parameters since they need the issue to be projected with the linear parameters. If there existed non linear terms,fitness function required to be convex or concave and consequently the GWBMO require a well-defined fitness function. The access to the unmeasurable variables were not needed. The experimental design of the setup was the identification of the BM model in the transfer to normoglycemia from hyperglycemia.
Figure 3. Output of the proposed GWBMO
In Figure 3, the operation required nearly 17 glucose measurements at a spacing of 5 min (generally 80 min). It implied the algorithm potential for the identification of the model parameters on the basis of real time. There is a notable advantage when the comparison was performed to the conventional method of the parameter estimation. For the insulin dependent patients the parameter estimation
8616
5755 IJSTR©2020
over the glucose tolerance.
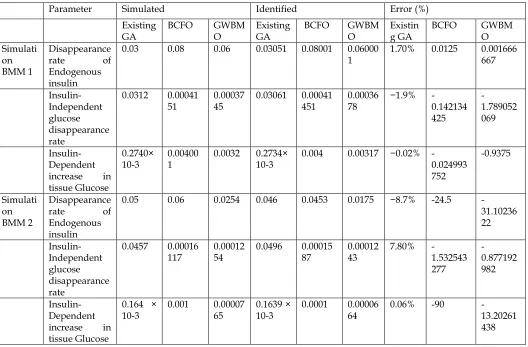
TABLE 3COMPARISON OF SIMULATION PARAMETERS
Parameter Simulated Identified Error (%) Existing
GA BCFO GWBMO Existing GA BCFO GWBMO Existing GA BCFO GWBMO Simulati
on BMM 1
Disappearance rate of Endogenous insulin
0.03 0.08 0.06 0.03051 0.08001 0.06000
1 1.70% 0.0125 0.001666667
Insulin-Independent glucose disappearance rate
0.0312 0.00041
51 0.0003745 0.03061 0.00041451 0.0003678 −1.9% -0.142134 425
-1.789052 069
Insulin-Dependent increase in tissue Glucose
0.2740×
10-3 0.004001 0.0032 0.2734×10⁻³ 0.004 0.00317 −0.02% -0.024993 752
-0.9375
Simulati on BMM 2
Disappearance rate of Endogenous insulin
0.05 0.06 0.0254 0.046 0.0453 0.0175 −8.7% -24.5 -31.10236 22
Insulin-Independent glucose disappearance rate
0.0457 0.00016 117
0.00012 54
0.0496 0.00015 87
0.00012 43
7.80% -1.532543 277
-0.877192 982
Insulin-Dependent increase in tissue Glucose
0.164 × 10⁻³
0.001 0.00007 65
0.1639 × 10⁻³
0.0001 0.00006 64
0.06% -90 -13.20261 438
The setup induces the main physiological concepts that are essential for the explanation of the predicted glucose dynamics and it was further enough for the modification of TIDM model configuration. The rat physiological glucose dynamics are modeled by BMM and hence utilized for rats. It possess a strategy for the destruction of the pancreatic beta cells that controls secretion of insulin. The functional, biochemical and structural modifications in the streptozotocin in rats is a widely used animal model for TIDM analysis. Most of the affected patient have glycemic instability which is characteristically linked comorbidities and hence there occurs an emergency need for insulin therapies that are optimized to reduce comorbidies. In this
8616
5756
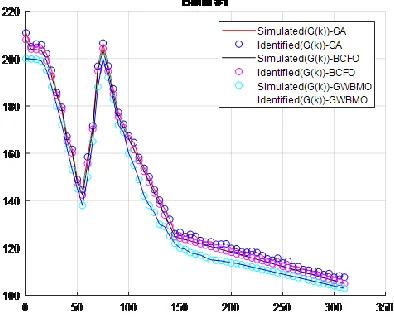
Figure 4. BMM simulation models
The two different simulation models that are compared
with different existing algorithms of GA, BCFO and proposed GWBMO in Table 3 are represented in the form of graphs in the figure 4. The value of G(k) both for simulated and identified were plotted for the proposed GWBMO and existing GA and BCFO algorithms.
5
CONCLUSION
The research contributes towards the determination of BMM parameters in the Sprague-Dawley female rats in which diabetes was induced through the strepzotocin in traperitoneal injection by the usage of novel Grey Wolf Bergman Model Optimization (GWBMO) algorithm. The parameters which enables the scalable simple real time application of different glucose dynamics among humans were identified in a most accurate manner. Digestion of foods by the rats considered for the examination is considered as the key issue prevailing in the research work. Approximate determination of blood glucose level by the proposed system
for the entire experimentation is not significant since it is useful for the exact estimation of parameters in minimized time. The performance of the proposed GWBMO algorithm is
very effective when compare d to various existing algorith ms of GA and BCFO.
R
EFERE NCES[1] Ahmed, T. A., Ahmed, Y. A., Arafa, A. I., & Salah, R. A. (2018). Detection of occult right ventricular dysfunction in young Egyptians with type 1 diabetes mellitus by two-dimensional speckle tracking echocardiography. Indian heart journal, 70(5), 665-671.
[2] Association, A. D. (2017). 2. Classification and diagnosis of diabetes. Diabetes care, 40(Supplement 1), S11-S24. [3] Campos-Náñez, E., Layne, J. E., & Zisser, H. C. (2018). In silico
modeling of minimal effective insulin doses using the uva/padova type 1 diabetes simulator. Journal of diabetes science and technology, 12(2), 376-380.
[4] Cescon, M., DeSalvo, D. J., Ly, T. T., Maahs, D. M., Messer, L. H., Buckingham, B. A., . . . Dassau, E. (2016). Early detection of infusion set failure during insulin pump therapy in type 1 diabetes. Journal of diabetes science and technology, 10(6), 1268-1276.
5757 IJSTR©2020
parameters of the Bergman Minimal Model in Sprague-Dawley rats with experimental diabetes for adaptive insulin delivery. Computers in biology and medicine, 108, 242-248.
[6] Goel, P., Parkhi, D., Barua, A., Shah, M., & Ghaskadbi, S. (2018). A Minimal Model Approach for Analyzing Continuous Glucose Monitoring in Type 2 Diabetes.
Frontiers in physiology, 9, 673.
[7] Guha, D., Roy, P. K., & Banerjee, S. (2016). Load frequency control of interconnected power system using grey wolf optimization. Swarm and Evolutionary Computation, 27, 97-115.
[8] Katsarou, A., Gudbjörnsdottir, S., Rawshani, A., Dabelea, D., Bonifacio, E., Anderson, B. J., . . . Lernmark, Å. (2017). Type 1 diabetes mellitus. Nature reviews Disease primers, 3, 17016.
[9] Kohli, M., & Arora, S. (2018). Chaotic grey wolf optimization algorithm for constrained optimization problems. Journal of computational design and engineering, 5(4), 458-472. [10] Marso, S. P., Daniels, G. H., Brown-Frandsen, K., Kristensen,
P., Mann, J. F., Nauck, M. A., . . . Ravn, L. S. (2016). Liraglutide and cardiovascular outcomes in type 2 diabetes. New England Journal of Medicine, 375(4), 311-322. [11] Schwartzbaum, J., Edlinger, M., Zigmont, V., Stattin, P.,
Rempala, G. A., Nagel, G., . . . Walldius, G. (2017). Associations between prediagnostic blood glucose levels, diabetes, and glioma. Scientific reports, 7(1), 1436. [12] Townsend, C., & Seron, M. M. (2017). Optimality of
unconstrained pulse inputs to the Bergman minimal model. IEEE Control Systems Letters, 2(1), 79-84.
[13] Townson, J., Gallagher, D., Cowley, L., Channon, S., Robling, M., Williams, D., . . . Gregory, J. W. (2018). ―Keeping it on your radar‖—assessing the barriers and facilitators to a timely diagnosis of type 1 diabetes in childhood: A qualitative study from the early detection of type 1 diabetes in youth study. Endocrinology, diabetes & metabolism, 1(1), e00008.
[14] Townson, J., Gregory, J., Cowley, L., Gallagher, D., Channon, S., Robling, M., . . . Lowes, L. (2017). Establishing the feasibility of a community and primary health care intervention to raise awareness of symptoms of Type 1 Diabetes—The Early Detection of Type 1 Diabetes in Youth (EDDY) study. Pediatric diabetes, 18(8), 955-963. [15] Vignali, D., Cantarelli, E., Bordignon, C., Canu, A., Citro, A.,