CT Scan Utilization Patterns in Pediatric Patients With
Recurrent Headache
WHAT’S KNOWN ON THIS SUBJECT: Although unnecessary for children with headache and normal history, computed tomography (CT) scans are widely used. Fewer than 1% of pediatric brain abnormalities present with headache as the only symptom. Furthermore, repeated CT scans may increase lifetime risk of cancer.
WHAT THIS STUDY ADDS: CT scans continue to be used to diagnose isolated pediatric headaches despite existing practice parameters. Although emergency department visits were correlated with greater likelihood of CT scan use, these scans were widely used across a variety of clinical settings.
abstract
OBJECTIVE:Although unnecessary for children with headache and nor-mal history, computed tomography (CT) scans are widely used. This study sought to determine current practice patterns of neuroimaging to diagnose pediatric headache in a variety of treatment settings and to identify factors associated with increased use of neuroimaging.
METHODS:This retrospective claims analysis included children (aged 3–17 years) with $2 medical claims for headache. The primary out-come was CT scan utilization on or after first presentation with headache in a physician’s office or emergency department (ED).
RESULTS: Of 15 836 patients, 26% (4034 patients; mean age: 11.8 years) had $1 CT scan, 74% within 1 month of index diagnosis. Patients with ED visits were 4 times more likely to undergo a CT scan versus those without ED visits (P, .001 [95% confidence interval: 3.9–4.8]). However, even outside the ED, use of CT scans remained widespread. Two-thirds of patients with CT scans had no ED use. Among patients with no ED utilization, .20% received a CT scan during the study period. Evaluation by a neurologist was strongly associated with a lower likelihood of CT scan compared with other provider specialties (odds ratio: 0.37; P , .01 [95% confidence interval: 0.30–0.46]).
CONCLUSIONS: Use of CT scans to diagnose pediatric headache remains high despite existing guidelines, low diagnostic yield, and high potential risk. Implementing quality improvement initiatives to ensure that CT scans in children are performed only when truly indicated will reduce unnecessary exposure to ionizing radiation and associated can-cer risks.Pediatrics2013;132:e1–e8
AUTHORS:Andrea DeVries, PhD,aPaul C. Young, MD,bEric
Wall, MD, MPH,cThomas ScD Getchius,d Chia-hsuan Li,
MS,aJohn Whitney, MD,eand Alan Rosenberg, MDe
aHealthCore, Inc, Wilmington, Delaware;bAmerican Academy of
Pediatrics, Elk Grove Village, Illinois;cAmerican Academy of
Family Physicians, Washington, District of Columbia;dAmerican
Academy of Neurology, Minneapolis, Minnesota; andeWellPoint,
Inc, Indianapolis, Indiana
KEY WORDS
administrative claims, CT scan, headache diagnosis, pediatric headache, recurrent headache
ABBREVIATIONS
AAN—American Academy of Neurology AAP—American Academy of Pediatrics ACR—American College of Radiology CI—confidence interval
CT—computed tomography ED—emergency department
Dr DeVries developed the initial study concept and design, interpreted the data, and wrote and revised the manuscript; Dr Getchius and Dr Wall contributed to the initial study concept and design, contributed to data interpretation, and reviewed the draft manuscript; Ms Li analyzed and interpreted the data, and critically reviewed and revised the manuscript; Dr Whitney contributed to the initial study concept and design, contributed to data interpretation, and reviewed and revised the draft manuscript; Dr Rosenberg developed the initial study concept, contributed to the study design and data interpretation, and reviewed the draft manuscript; and all authors approved the
final submitted draft.
www.pediatrics.org/cgi/doi/10.1542/peds.2012-3862 doi:10.1542/peds.2012-3862
Accepted for publication Apr 2, 2013
Address correspondence to Andrea DeVries, PhD, HealthCore, Inc, 800 Delaware Ave, 5th Floor, Wilmington, DE 19801. E-mail: [email protected]
PEDIATRICS (ISSN Numbers: Print, 0031-4005; Online, 1098-4275). Copyright © 2013 by the American Academy of Pediatrics
FINANCIAL DISCLOSURE:Dr DeVries and Ms Li are employees of HealthCore, Inc, an independent research organization that received funding from WellPoint, Inc, for the conduct of the study. Drs Whitney and Rosenberg are employees of WellPoint, Inc. The other authors have indicated they have nofinancial relationships relevant to this article to disclose.
FUNDING:This study was funded by WellPoint, Inc.
well as 1 of the most frequent reasons for pediatric neuroimaging, particu-larly in emergency departments (EDs). In 2008, 1.7 million pediatric CT scans were performed in the ED, nearly 6% of all pediatric ED visits that year.3 As many as 28% of those scans were performed for headache unrelated to head injury. Brain tumors are un-common in children, and,1% of brain abnormalities in children present with headache as the only symptom.1,4 Thus, neuroimaging is considered un-necessary in the diagnosis of headache when no other neurologic symptoms are present to suggest serious intra-cranial pathology.1,5–13
Not only is neuroimaging clinically un-necessary for children with isolated headache, it is also associated with potential long-term health risks. CT scans involve larger doses of radia-tion than convenradia-tional radiographs14 and have been proposed to increase a child’s lifetime risk of cancer.14–17 For example, a retrospective study by Pearce et al17suggests that the cumu-lative ionizing radiation doses from as few as 2 to 3 head CT scans in a child aged,15 years could triple the risk of brain tumors; 5 to 10 head scans could triple the risk of leukemia. It should be noted the occurrence of these cancers is rare, and the cumulative absolute risk is small.
Because of the low diagnostic yield of CT scans in the diagnosis of pediatric headache, the American Academy of Neurology (AAN) published practice parameters specifically recommend-ing against neuroimagrecommend-ing for children with headache and a normal history and neurologic examination.18,19 This recommendation was endorsed by the American Academy of Pediatrics (AAP) and the American College of Radiology (ACR). The ACR instituted the Choosing Wisely campaign, which includes a
scan is recommended.20 The high-lighted points advise against CT scans for uncomplicated headaches, sus-pected pulmonary embolism,
ad-mission or preoperative chest
radiographs, suspected appendicitis in children, and follow-up imaging for inconsequential adnexal cysts, in cases with an unremarkable history and examination.
Despite the practice parameters, use of neuroimaging, and CT scans in partic-ular, in children has changed little in recent years.21–23Although the overall ratio of CT scans in children is lower than in adults, pediatric CT scans have increased disproportionately in older children.22 In an analysis of neuro-imaging rates for pediatric nonacute headache, rates remained constant before and after publication of the 2002 AAN guidelines: in 1992, 43% of children presenting at a pediatric neu-rology clinic with nonacute headache underwent neuroimaging compared with 45% in 2004.21 In a more re-cent analysis spanning 2003 through 2010, a CT scan was performed in 5.5% of all pediatric ED visits, with head CT scans comprising 63% of the total.23
The current study originated with dis-cussions between leadership within the AAP and WellPoint, Inc, to address the question, “to what extent do cur-rent practice patterns for treatment pediatric headache align with prac-tice guidelines?”An advisory group in-cluding representatives from the AAP, AAN, and the American Academy of Family Physicians was convened. This study resulted from this advisory group’s initial questions. Previous anal-yses examined neuroimaging as a di-agnostic tool for children with headache, but those studies were performed in pediatric neurology clinics,7,8,11,13,21 EDs,3,5,22,23or an ambulatory care
set-current, real-world practice patterns in the use of neuroimaging to di-agnose pediatric headache. The com-prehensiveness of the claims data enabled analysis across all treatment settings to identify factors associated with increased likelihood of neuro-imaging. This study is the first that we are aware of comparing children across treatment settings and pro-vider specialties.
METHODS
Data Source
This study was a retrospective, ob-servational cohort analysis using commercial claims data. Data were obtained from the HealthCore Inte-grated Research Environment, an integrated medical, pharmacy, and eligibility claims data set of com-mercially insured patients. The data-base includes claims data for 14 major commercial health plans across the United States. The health plans include a wide range of product offerings, including preferred pro-vider organizations, health mainte-nance organizations, fee-for-service, and consumer-directed health plans. The database includes ∼45 million total unique lives, with eligibility dating back to 2006.
Patients
date of the first headache diagnosis claim, and patients were required to have a minimum of 12 months’health plan eligibility before and after the in-dex date. After the initial identification period, patients were followed up until December 31, 2010, or disenrollment from the health plan. Children were ex-cluded from the study if they had,24 months of health plan eligibility, if they had headache diagnosis claims occur-ring in the 12-month period before the index date, or if diagnosis codes in-dicating head trauma appeared during the preindex period, on the index date, or during the follow-up period (Supple-mental Appendix B).
Institutional Review Board Approval
This study was a noninterventional, retrospective claims analysis. The re-search was conducted in compliance with state and federal laws, including the Health Insurance Portability and Accountability Act of 1996. All claims data were from a limited data set with de-identified patient information. No patients were involved in the study and thus review by an institutional review board was unnecessary.
Outcome Measures
The primary outcome of interest was utilization of CT scans of the head on or after the patient first presented with a headache in a physician’s office or in an ED setting. In addition to the binary variable of CT scan/no CT scan, we evaluated patients receiving multiple CT scans of the head and patients re-ceiving a CT scan in conjunction with another head-related imaging pro-cedure.
Statistical Analysis
The statistical significance of differ-ences between patients undergoing CT scans and those who did not undergo a CT scan were assessed by usingx2
tests for categorical variables and 2-sided t tests for continuous varia-bles. The initial variables of interest included age, gender, geographic re-gion, length of patient follow-up, ini-tial headache diagnosis on index date, change in headache diagnosis cate-gory after index date, provider spe-cialty on index diagnosis, number of physician office visits since index date, days betweenfirst and last headache diagnosis, number of ED visits during the follow-up period (inclusive of index date), diagnostic procedures (eg, MRI, lumbar puncture), headache treatment (including use of abortive/rescue head-ache medications), use of preventive/ prophylactic medications, use of non-pharmacologic treatment (eg, acu-puncture), and presence of comorbid conditions. The comorbid conditions of interest were identified during the 12-month preindex period and in-cluded diagnoses for attention-deficit/ hyperactivity disorder, anxiety, asthma, cerebral palsy, depression, epilepsy, pervasive developmental disorders, antisocial personality disorder, and stress (Supplemental Appendix C).
A binomial logistic regression model was used to measure the relationship between the outcome of interest (like-lihood of receiving a CT scan) and the following variables: age, gender, geo-graphic region, provider specialty on index diagnosis, number of physician office visits, ED visits, diagnostic pro-cedures (eg, MRI, lumbar puncture), use of abortive/rescue headache medi-cations, and presence of comorbid conditions. Statistical analyses were conducted by using SAS version 9.1 (SAS Institute, Inc, Cary, NC). Analevel of .05 was set for each test.
RESULTS
Patient Population
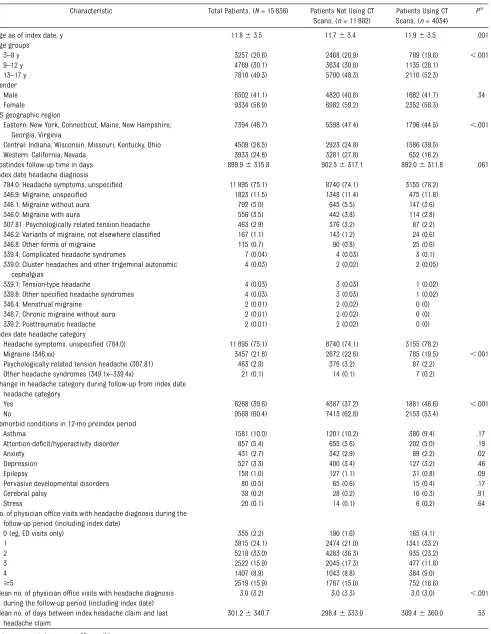
There were 15 836 children meeting study criteria, with 4034 (25%)
under-going$1 CT scan during the follow-up period (Table 1). The mean patient age was 11.8 years on the index date; 59% of the population was female. Although 4 categories of headache were initially identified for inclusion (migraine, other headache syndromes, psychologically re-lated tension headache, and headache symptoms/unspecified), the majority of patients (75%) fell into the category of headache symptoms/unspecified, with migraine as the second most common category (22%) at their index diagnosis. In 60% of cases overall, the index head-ache category was the same as thefinal headache category. At follow-up, the headache category remained unchanged in 53.4% of children who had a CT scan, compared with 62.8% who did not have a CT scan. In cases in which there was a shift in headache category, the most common shift was from headache symptoms/unspecified to migraine. The most common comorbid condition was asthma, with the diagnosis appearing in 10% of the patients’claims history be-fore the index date.
Scans, (n= 11 802) Scans, (n= 4034)
Age as of index date, y 11.863.5 11.763.4 11.963.5 .001 Age groups
3–8 y 3257 (20.6) 2468 (20.9) 789 (19.6) ,.001 9–12 y 4769 (30.1) 3634 (30.8) 1135 (28.1)
13–17 y 7810 (49.3) 5700 (48.3) 2110 (52.3) Gender
Male 6502 (41.1) 4820 (40.8) 1682 (41.7) .34 Female 9334 (58.9) 6982 (59.2) 2352 (58.3)
US geographic region
Eastern: New York, Connecticut, Maine, New Hampshire, Georgia, Virginia
7394 (46.7) 5598 (47.4) 1796 (44.5) ,.001 Central: Indiana, Wisconsin, Missouri, Kentucky, Ohio 4509 (28.5) 2923 (24.8) 1586 (39.5)
Western: California, Nevada 3933 (24.8) 3281 (27.8) 652 (16.2)
Postindex follow-up time in days 899.96315.8 902.56317.1 892.06311.8 .061 Index date headache diagnosis
784.0: Headache symptoms, unspecified 11 895 (75.1) 8740 (74.1) 3155 (78.2) 346.9: Migraine, unspecified 1823 (11.5) 1348 (11.4) 475 (11.8) 346.1: Migraine without aura 792 (5.0) 645 (5.5) 147 (3.6) 346.0: Migraine with aura 556 (3.5) 442 (3.8) 114 (2.8) 307.81: Psychologically related tension headache 463 (2.9) 376 (3.2) 87 (2.2) 346.2: Variants of migraine, not elsewhere classified 167 (1.1) 143 (1.2) 24 (0.6) 346.8: Other forms of migraine 115 (0.7) 90 (0.8) 25 (0.6) 339.4: Complicated headache syndromes 7 (0.04) 4 (0.03) 3 (0.1) 339.0: Cluster headaches and other trigeminal autonomic
cephalgias
4 (0.03) 2 (0.02) 2 (0.05) 339.1: Tension-type headache 4 (0.03) 3 (0.03) 1 (0.02) 339.8: Other specified headache syndromes 4 (0.03) 3 (0.03) 1 (0.02) 346.4: Menstrual migraine 2 (0.01) 2 (0.02) 0 (0) 346.7: Chronic migraine without aura 2 (0.01) 2 (0.02) 0 (0) 339.2: Posttraumatic headache 2 (0.01) 2 (0.02) 0 (0) Index date headache category
Headache symptoms, unspecified (784.0) 11 895 (75.1) 8740 (74.1) 3155 (78.2)
Migraine (346.xx) 3457 (21.8) 2672 (22.6) 785 (19.5) ,.001 Psychologically related tension headache (307.81) 463 (2.9) 376 (3.2) 87 (2.2)
Other headache syndromes (349.1x–339.4x) 21 (0.1) 14 (0.1) 7 (0.2) Change in headache category during follow-up from index date
headache category
Yes 6268 (39.6) 4387 (37.2) 1881 (46.6) ,.001 No 9568 (60.4) 7415 (62.8) 2153 (53.4)
Comorbid conditions in 12-mo preindex period
Asthma 1581 (10.0) 1201 (10.2) 380 (9.4) .17 Attention-deficit/hyperactivity disorder 857 (5.4) 655 (5.6) 202 (5.0) .19 Anxiety 431 (2.7) 342 (2.9) 89 (2.2) .02 Depression 527 (3.3) 400 (3.4) 127 (3.2) .46 Epilepsy 158 (1.0) 127 (1.1) 31 (0.8) .09 Pervasive developmental disorders 80 (0.5) 65 (0.6) 15 (0.4) .17 Cerebral palsy 38 (0.2) 28 (0.2) 10 (0.3) .91 Stress 20 (0.1) 14 (0.1) 6 (0.2) .64 No. of physician office visits with headache diagnosis during the
follow-up period (including index date)
0 (eg, ED visits only) 355 (2.2) 190 (1.6) 165 (4.1) 1 3815 (24.1) 2474 (21.0) 1341 (33.2) 2 5218 (33.0) 4283 (36.3) 935 (23.2) 3 2522 (15.9) 2045 (17.3) 477 (11.8) 4 1407 (8.9) 1043 (8.8) 364 (9.0)
$5 2519 (15.9) 1767 (15.0) 752 (18.6) Mean no. of physician office visits with headache diagnosis
during the follow-up period (including index date)
3.0 (3.2) 3.0 (3.3) 3.0 (3.0) ,.001 Mean no. of days between index headache claim and last
headache claim
301.26340.7 298.46333.9 309.46360.0 .53
Data are presented as mean6SD orn(%).
length of time to CT scan was 79 days (Fig 1).
Univariate Results
Children who underwent CT scans were, on average, 2 months older than children who did not have CT scans. This difference was statistically significant (P , .01) but not clinically meaningful. There was a nonsignificant difference in gender between those who had a CT scan and those who did not. Most of the comorbid conditions were not significantly differ-ent between the 2 groups. The 1 excep-tion was anxiety, which was slightly less common among patients who underwent CT scans than those who did not (2.2% vs 2.9%, respectively;P,.01).
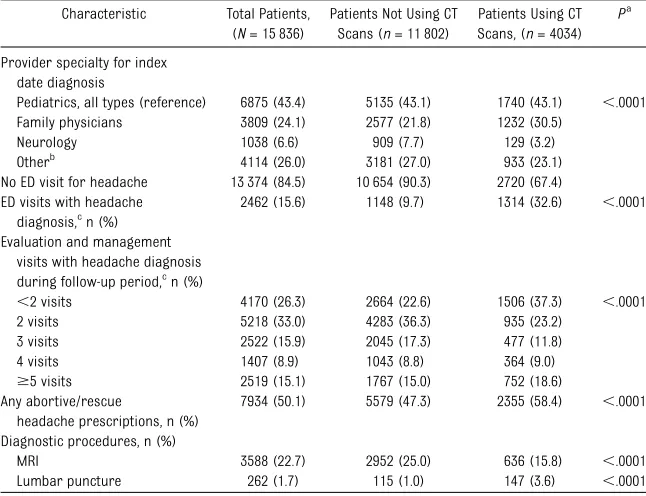
Patients who received CT scans had the same likelihood as those who did not receive a CT scan of being treated by a pediatrician on the index date (43% for both groups). However, children who underwent CT scans were more likely
than those who did not to be treated by a family physician (30.5% vs 21.8%, respectively; P , .01). Patients who underwent CT scans were much more likely than those without CT scans to receive care in the ED, either at the index date or during the follow-up pe-riod (32.6% vs 9.7%, respectively;P, .001). Patients in both groups received the same number of office visits on average (3.0 for both groups), although patients undergoing CT scans were more likely to have received care only in the ED (4.0% vs 1.6%;P,.001). Al-though ED visit was highly correlated with CT use, it is important to note that two-thirds of the patients receiving CT scans had no ED visits at all during the study period. After excluding patients with ED visits, 20.3% of patients re-ceived a CT scan either on the index date or at some point in the follow-up period. Patients undergoing CT scans were less likely to undergo an MRI (15.8% vs 25.6%;P,.001).
Logistic Regression Results
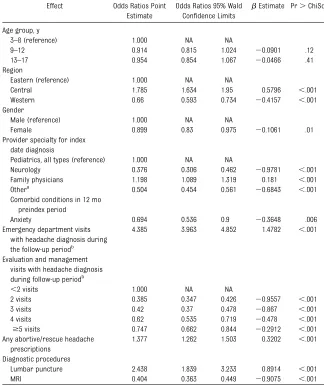
Consistent with the univariate results, the strongest association in the logistic regression was with ED use: pediatric patients with headache who visited the ED were 4 times more likely to undergo a CT scan as those who did not visit the ED (odds ratio: 4.4;P,.001 [95% confidence interval (CI): 3.96–4.85]) (Table 3).
Age was not statistically significant in the logistic regression model, consis-tent with the univariate results. Female patients were somewhat less likely than male patients to undergo CT scans (odds ratio: 0.89;P,.01 [95% CI: 0.83– 0.97]). The western geographic region was associated with lower rates of CT scan than the central or eastern regions (odds ratio: 0.66;P,.01). Thisfinding is consistent with other internal analyses of regional differences in imaging rates, in which the health plans in the western region of the country tend to have lower rates (WellPoint, internal analysis, 2012 data). Geographic differences in prac-tice patterns, although not specific to this population, have been long recog-nized, particularly via the work of the Dartmouth Atlas.24
It is interesting to note that provider specialty was associated with likelihood of receiving a CT scan. Receiving care from a neurologist was strongly asso-ciated with a lower likelihood of a child undergoing a CT scan (odds ratio: 0.37; P,.01 [95% CI: 0.31–0.46]), whereas receiving care from a family physician was associated with a higher likeli-hood of a child undergoing a CT scan (odds ratio: 1.2;P,.001 [95% CI: 1.09– 1.32]).
DISCUSSION
Practice parameters issued by the AAN and endorsed by the AAP and ACR rec-ommend against neuroimaging as a diagnostic tool for children presenting with headache and no other signs or symptoms.18,19Despite these recommen-dations and numerous studies noting TABLE 2 Characteristics of Interest According to CT Scan Diagnostic Procedures
Characteristic Total Patients, (N= 15 836)
Patients Not Using CT Scans (n= 11 802)
Patients Using CT Scans, (n= 4034)
Pa
Provider specialty for index date diagnosis
Pediatrics, all types (reference) 6875 (43.4) 5135 (43.1) 1740 (43.1) ,.0001 Family physicians 3809 (24.1) 2577 (21.8) 1232 (30.5)
Neurology 1038 (6.6) 909 (7.7) 129 (3.2) Otherb
4114 (26.0) 3181 (27.0) 933 (23.1) No ED visit for headache 13 374 (84.5) 10 654 (90.3) 2720 (67.4) ED visits with headache
diagnosis,cn (%)
2462 (15.6) 1148 (9.7) 1314 (32.6) ,.0001 Evaluation and management
visits with headache diagnosis during follow-up period,cn (%)
,2 visits 4170 (26.3) 2664 (22.6) 1506 (37.3) ,.0001 2 visits 5218 (33.0) 4283 (36.3) 935 (23.2)
3 visits 2522 (15.9) 2045 (17.3) 477 (11.8) 4 visits 1407 (8.9) 1043 (8.8) 364 (9.0)
$5 visits 2519 (15.1) 1767 (15.0) 752 (18.6) Any abortive/rescue
headache prescriptions, n (%)
7934 (50.1) 5579 (47.3) 2355 (58.4) ,.0001 Diagnostic procedures, n (%)
MRI 3588 (22.7) 2952 (25.0) 636 (15.8) ,.0001 Lumbar puncture 262 (1.7) 115 (1.0) 147 (3.6) ,.0001
Data are presented asn(%).
aPvalue is for 2-sided test,a= .05;x2test or Fisher’s exact was used for categorical variables between no CT scan versus CT
scan.
bOther provider specialty includes emergency medicine, internal medicine, ophthalmology, otolaryngology, allergy,
immu-nology, surgery (all types), anesthesiology/pain management, and other nonlisted.
cIncluding index date.
the lack of effectiveness of neuroimaging in pediatric headache,1,5–13 the use of neuroimaging in children remains high. Previous cross-sectional analyses of children with nonacute headache in a pediatric neurology clinic found 45% of the children had at least 1 neuro-imaging study performed.13,21Much of the previous work examining CT use in chil-dren with headache focused on the ED setting.3,5,22,23Consistent with this pre-vious research, we found a high rate of CT scan use in the ED, and ED visits were highly correlated with the likelihood of a child receiving a CT scan when pre-senting with a headache. However, our study was unique in examining the use of CT scans for pediatric headache not only in EDs but also across all treatment set-tings and various physician specialties. Across this broad cross-section of set-tings and specialties, CT scans were still commonly used diagnostic procedures even when the patient did not visit the ED.
Symptoms that indicate the need for CT scan include age,3 years; explosive headache; associated changes in men-tal status or performance; awakening with headache, nausea, and vomiting; and steadily worsening pattern of headache.25 Because we used claims data rather than medical records to determine which patients had a CT scan, we were unable to assess for the pres-ence of these symptoms. We acknowl-edge that this lack of data represents a significant limitation. Nevertheless, given the large percentage of patients with headache symptoms/unspecified and the fact that the majority of these patients did not receive a more specific diagnosis during the follow-up period raises concerns regarding the reliance of CT scans in the care for pediatric patients presenting with headaches. It is reasonable to suggest that when indi-viduals have syndromes that clearly require imaging, it is more likely that the
Thesefindings are consistent with the literature. Among children with chronic headache who had been referred to a specialty clinic, 23% of those referred by pediatricians had already had 1 head scan before referral.2Separate studies performed in neurology clinics and an ambulatory care centers found 76% to 80% of neuroimaging tests were ordered by primary care physicians rather than specialists.10,13,21The widespread CT uti-lization across physician specialties may be due to misperceptions of the clinical benefits and risks of CT scan for diagno-sis of headache or to misinterpretation by physicians of the expectations of children and their parents. Pediatricians surveyed indicated they believed the primary concern of mothers of children with headache was the presence of a tu-mor, and they therefore focused on di-agnostic testing rather than treatment.26 Although valid reasons may exist for the differences among physician specialties in ordering diagnostic tests, large dis-crepancies may indicate potential over-use or inappropriate over-use of certain procedures and could be used as the basis for developing future guidelines or educational programs.
Physicians also may underestimate the risks associated with CT scans.22 Of particular concern is that in addition to the lack of clinical effectiveness, CT scans have been associated with an increased lifetime risk of cancer.15–17 The risk from ionizing radiation is cu-mulative, with younger children facing the highest risk.16However, physicians ordering CT scans may underestimate the radiation risk or may mistakenly believe the risk is limited to infants.22 Only 9% of ED physicians in a survey perceived an increased risk of cancer associated with CT scans, compared with 47% of radiologists surveyed.27 Whereas CT scans accounted for 13% of all diagnostic radiology procedures in
FIGURE 1
US hospitals, they contributed 70% of the collective radiation dose delivered to patients. Few patients reported being informed of these risks, and 78% of physicians admitted they did not explain the potential risks to patients.
This study had several limitations. The study data were obtained from a large,
geographically diverse population. How-ever, as noted earlier, this is a claims-based analysis, and the potential exists that some claims may have been mis-coded. Although the sample was large and diverse, all patients were members of a US employer-based health plan, and the results may not be generalizable to patients with other types of health
insurance or living outside of the United States. As noted, it was difficult to de-termine whether a patient had a normal neurologic examination based on claims data and therefore a CT or MRI scan that conformed to clinical guidelines. A chart review would be needed to properly make that determination. Future research may further explore the frequency as to which neuroimaging tests indicate abnormali-ties, and whether scans ordered by generalists, such as pediatricians or family practitioners, differ from those ordered by neurologists in terms of detected abnormalities.
CONCLUSIONS
The likelihood of children receiving a CT scan in a variety of practice settings remains high and continues to be of concern given the cumulative risks associated with ionizing radiation and associated cancer risks. Although ED use was associated with the greater likelihood of a CT scan, we also saw widespread use of CT scans for patients treated by family physicians and pedia-tricians. This study affirms guidelines recommending against CT scans for uncomplicated headache. Furthermore, it suggests an opportunity exists to re-duce exposure of children and adoles-cents to ionizing radiation by ensuring that a CT scan ordered on a child with a headache is done so only when truly indicated.
ACKNOWLEDGMENTS
The authors acknowledge Cheryl Jones for editorial assistance in preparing the manuscript, and Burak Ozbay and Brian McNeeley for assistance with data col-lection and analysis.
REFERENCES
1. Dooley JM. The evaluation and manage-ment of pediatric headaches. Paediatr Child Health. 2009;14(1):24–30
2. Abu-Arefeh I, Russell G. Prevalence of headache and migraine in schoolchildren.
BMJ. 1994;309(6957):765–769
3. Larson DB, Johnson LW, Schnell BM, Goske MJ, Salisbury SR, Forman HP. Rising use of CT in child visits to the emergency TABLE 3 Logistic Regression Model (CT Scan Versus No CT Scan)
Effect Odds Ratios Point Estimate
Odds Ratios 95% Wald Confidence Limits
bEstimate Pr.ChiSq Age group, y
3–8 (reference) 1.000 NA NA
9–12 0.914 0.815 1.024 20.0901 .12 13–17 0.954 0.854 1.067 20.0466 .41 Region
Eastern (reference) 1.000 NA NA
Central 1.785 1.634 1.95 0.5796 ,.001 Western 0.66 0.593 0.734 20.4157 ,.001 Gender
Male (reference) 1.000 NA NA
Female 0.899 0.83 0.975 20.1061 .01 Provider specialty for index
date diagnosis
Pediatrics, all types (reference) 1.000 NA NA
Neurology 0.376 0.306 0.462 20.9781 ,.001 Family physicians 1.198 1.089 1.319 0.181 ,.001 Othera 0.504 0.454 0.561 20.6843 ,.001 Comorbid conditions in 12 mo
preindex period
Anxiety 0.694 0.536 0.9 20.3648 .006 Emergency department visits
with headache diagnosis during the follow-up periodb
4.385 3.963 4.852 1.4782 ,.001
Evaluation and management visits with headache diagnosis during follow-up periodb
,2 visits 1.000 NA NA
2 visits 0.385 0.347 0.426 20.9557 ,.001 3 visits 0.42 0.37 0.478 20.867 ,.001 4 visits 0.62 0.535 0.719 20.478 ,.001
$5 visits 0.747 0.662 0.844 20.2912 ,.001 Any abortive/rescue headache
prescriptions
1.377 1.262 1.503 0.3202 ,.001 Diagnostic procedures
Lumbar puncture 2.438 1.839 3.233 0.8914 ,.001 MRI 0.404 0.363 0.449 20.9075 ,.001
NA, not applicable.
aOther provider specialty includes emergency medicine, internal medicine, ophthalmology, otolaryngology,
allergy/immu-nology, surgery (all types), anesthesiology/pain management, and other nonlisted.
bIncluding index date.
4. Ahmed MA, Martinez A, Cahill D, Chong K, Whitehouse WP. When to image neurologi-cally normal children with headaches: de-velopment of a decision rule.Acta Paediatr. 2010;99(6):940–943
5. Lateef TM, Grewal M, McClintock W, Chamberlain J, Kaulas H, Nelson KB. Head-ache in young children in the emergency de-partment: use of computed tomography.
Pediatrics. 2009;124(1). Available at: www. pediatrics.org/cgi/content/full/124/1/e12
6. Pavone P, Conti I, Le Pira A, Pavone L, Verrotti A, Ruggieri M. Primary headache: role of investigations in a cohort of young children and adolescents. Pediatr Int. 2011;53(6): 964–967
7. Rho YI, Chung HJ, Suh ES, et al. The role of neuroimaging in children and adolescents with recurrent headaches—multicenter study.Headache. 2011;51(3):403–408
8. Schwedt TJ, Guo Y, Rothner AD. “Benign” imaging abnormalities in children and adolescents with headache. Headache. 2006;46(3):387–398
9. Tsushima Y, Endo K. MR imaging in the evaluation of chronic or recurrent head-ache.Radiology. 2005;235(2):575–579
10. You JJ, Gladstone J, Symons S, Rotstein D, Laupacis A, Bell CM. Patterns of care and outcomes after computed tomography scans for headache.Am J Med. 2011;124(1):58–63, e1
11. Lewis DW, Dorbad D. The utility of neuro-imaging in the evaluation of children with migraine or chronic daily headache who have normal neurological examinations.
Headache. 2000;40(8):629–632
the diagnosis of chronic headache. Arch Intern Med. 1992;152(12):2457–2462
13. Graf WD, Kayyali HR, Abdelmoity AT, Womel-duff GL, Williams AR, Morriss MC. Incidental neuroimaging findings in nonacute head-ache.J Child Neurol. 2010;25(10):1182–1187
14. Brenner DJ, Hall EJ. Computed tomography— an increasing source of radiation exposure.
N Engl J Med. 2007;357(22):2277–2284
15. Brenner DJ, Elliston CD, Hall EJ, Berdon WE. Estimated risks of radiation-induced fatal cancer from pediatric CT. AJR Am J Roentgenol. 2001;176(2):289–296
16. Karlsson P, Holmberg E, Lundell M, Mattsson A, Holm LE, Wallgren A. Intracranial tumors after exposure to ionizing radiation during infancy: a pooled analysis of two Swedish cohorts of 28,008 infants with skin heman-gioma.Radiat Res. 1998;150(3):357–364
17. Pearce MS, Salotti JA, Little MP, et al. Ra-diation exposure from CT scans in child-hood and subsequent risk of leukaemia and brain tumours: a retrospective cohort study.Lancet. 2012;380(9840):499–505
18. Lewis DW. New practice parameters: what does the evidence say?Curr Pain Headache Rep. 2005;9(5):351–357
19. Jordan JE; Expert Panel on Neurologic Im-aging. Headache. AJNR Am J Neuroradiol. 2007;28(9):1824–1826
20. American College of Radiology. Choosing wisely: five things physicians and patients should question. Available at: http://choosingwisely. org/wp-content/uploads/2012/04/5things_ 12_factsheet_Amer_Coll_Radiology.pdf. Accessed September 12, 2012
in nonacute pediatric headache before and after clinical practice parameters.Pediatrics. 2008;122(5). Available at: www.pediatrics.org/ cgi/content/full/122/5/e1001
22. Broder J, Fordham LA, Warshauer DM. Increasing utilization of computed tomog-raphy in the pediatric emergency depart-ment, 2000-2006.Emerg Radiol. 2007;14(4): 227–232
23. Menoch MJ, Hirsh DA, Khan NS, Simon HK, Sturm JJ. Trends in computed tomography utilization in the pediatric emergency de-partment.Pediatrics. 2012;129(3). Available at: www.pediatrics.org/cgi/content/full/129/ 3/e690
24. Goodman DC, Brownlee S, Chang CH, Fisher ES. Regional and racial variation in primary care and the quality of care among Medi-care beneficiaries. A report of the Darth-mouth Atlas Project. Available at: www. dartmouthatlas.org/downloads/reports/ Primary_care_report_090910.pdf. Accessed March 6, 2013
25. Brenner M, Oakley C, Lewis D. The evalua-tion of children and adolescents with headache.Curr Pain Headache Rep. 2008; 12(5):361–366
26. Raieli V, Compagno A, Pandolfi E, et al. Headache: what do children and mothers expect from pediatricians?Headache. 2010; 50(2):290–300
DOI: 10.1542/peds.2012-3862 originally published online June 24, 2013;
2013;132;e1
Pediatrics
John Whitney and Alan Rosenberg
Andrea DeVries, Paul C. Young, Eric Wall, Thomas ScD Getchius, Chia-hsuan Li,
CT Scan Utilization Patterns in Pediatric Patients With Recurrent Headache
Services
Updated Information &
http://pediatrics.aappublications.org/content/132/1/e1 including high resolution figures, can be found at:
References
http://pediatrics.aappublications.org/content/132/1/e1#BIBL This article cites 24 articles, 5 of which you can access for free at:
Subspecialty Collections
y_sub
http://www.aappublications.org/cgi/collection/traumatic_brain_injur
Traumatic Brain Injury
ub
http://www.aappublications.org/cgi/collection/head_neck_injuries_s
Head and Neck Injuries
sub
http://www.aappublications.org/cgi/collection/neurologic_disorders_
Neurologic Disorders
http://www.aappublications.org/cgi/collection/neurology_sub
Neurology
following collection(s):
This article, along with others on similar topics, appears in the
Permissions & Licensing
http://www.aappublications.org/site/misc/Permissions.xhtml in its entirety can be found online at:
Information about reproducing this article in parts (figures, tables) or
Reprints
DOI: 10.1542/peds.2012-3862 originally published online June 24, 2013;
2013;132;e1
Pediatrics
John Whitney and Alan Rosenberg
http://pediatrics.aappublications.org/content/132/1/e1
located on the World Wide Web at:
The online version of this article, along with updated information and services, is
http://pediatrics.aappublications.org/content/suppl/2013/06/19/peds.2012-3862.DCSupplemental Data Supplement at:
by the American Academy of Pediatrics. All rights reserved. Print ISSN: 1073-0397.