ISSN: 2334-2366 (Print), 2334-2374 (Online) Copyright © The Author(s). All Rights Reserved. Published by American Research Institute for Policy Development DOI: 10.15640/jcsit.v4n2a4 URL: https://doi.org/10.15640/jcsit.v4n2a4
An Implementation of ID3 Decision Tree Learning Algorithm for
Tax Fraud Control and Prevention System
Oshoiribhor Emmanuel O1, John-OtumuAdetokunbo M.2, & Ojieabu Clement E3
Abstract
Every month business ventures pay certain amount of money as tax to the government agency in-charge of collecting tax as internally generated revenue. This tax amount ought to be a certain percentage of their earnings or profit, but the agency in-charge has no structured means of apportioning or predicting the amount of money to levy the tax payers thereby over-estimating or under-estimating the tax amount charged. This scenario has posed serious financial fraud issues of cash suppression and diversion in the current tax collection system. For the purpose of this research work, ID3 classification technique based on decision tree has been used to properly classify tax payers into tears in order to monitor, control and reduce fraudulent tax activities in the present tax collection system. The result of this research work will assist the state government to control tax fraud of different kinds, and to properly predict the expected tax income to improve on the developmental projects of the state.
Keywords: ID3 Algorithm, Decision Tree, Machine Learning, Fraud, Tax
Collection System
1 Department of Computer Science, Ambrose Alli University, Ekpoma, Nigeria.
2 ICT Directorate, Ambrose Alli University, Ekpoma, Nigeria. [email protected] 3 Department of Electrical/Electronic Engineering, Ambrose Alli University, Ekpoma, Nigeria.
I.Introduction
Fraud has become one of the constants of life; fraud can never stop but can
be detected and reduced to an extent [14]. Edo state Inland Revenue Services is
overwhelmed with gigabyte of disk capacity containing data about tax payers’ in the
state. The data stored on the database is increasing in size at an alarming rate; but this
has resulted in a data rich but information poor situation where there is a widening
gap between the explosive growth of data and its types, and the ability to analyze and
interpret the data effectively has becomes a major challenge; hence fraudulent
activities like cash suppression and diversion in the tax collection system is rampant
because there is no proper structure for apportioning taxes/levies to petty shops,
supermarkets saloons etc in the current or existing tax collection system. Tax is
supposed to be based on a certain percentage of earnings/income or profit, but the
tax officers give estimated levies or taxes to business ventures or organizations at
random thereby either under estimating or overestimating the tax amount given to
taxpayers.
Moreso, some of the monies collected from these petty shops as taxes/levies
are not being remitted to the appropriate office, there by leading to tax amount
suppression or loss in the current system, and the government have no way of
knowing the exact number of business ventures or organizations that are paying
taxes/levies; let alone the revenue generated monthly from the various organizations.
The government only makes financial decisions based on what its mechanism
for collecting tax (board of internal revenue) presents as internally generated revenue
(IGR) for the month. The specific objective of this study is to develop an automated
model that will classify tax payers into tiers or segments based on their earnings or
profit for effective monitoring, controlling, and reduction of fraudulent activities in
2. Literature Review
Iterative Dichotomizer 3 (ID3) according to [1, 5, and 6] is a decision tree
learning algorithm developed by Ross Quinlan in 1983. The main idea behind ID3
algorithm is to create a decision tree of a given set using top-down greedy search to
check each attribute at every node. ID3 operates recursively on ‘n’ partitioned subsets
in order to get the best attribute until it classifies the training sets after which it stops
[7].
According to [8] most decision tree algorithms are faced with the issues of
choosing and splitting attributes, number of splits to be taken, stopping criteria, order
of splitting attributes and balancing of tree structure and pruning. [2] Applied
classification technique using DID3 algorithm to improve decision support system
under uncertain situations. The proposed system supported top level management to
make a good decision in any time under any uncertain environment using the
classification technique by DID3 algorithm. [3] Is of the opinion that each branch of
the tree is a classification question and the leaves of the tree are partitions of the
dataset with their classification.
Also from literatures reviewed, some other interesting implementation or uses
of ID3 algorithm are as follows;[4] Modified ID3 algorithm and implemented it to
create a decision tree for bank loan seekers. The changes were done in order to
remove the shortcomings of the algorithm, while the modified version is helpful to
bankers in order to predict the credit risk of people seeking for loans from banks. [9]
Adapted ID3 decision tree algorithm for job placement prediction based for the
The result of the analysis assisted academic planners to design a strategy to
improve the performance of students that will help them in getting placed at the
earliest possible time. [10] Used decision tree algorithm to select the best path to
follow in the standard division. They introduced ID3 algorithm and Havrda and
Charvat Entropy instead of Shannon Entropy. The decision tree helps in making the
better decision to the analysis of data. [11] Implemented decision tree classification
alongside with fuzzy logic. The fuzzy ID3 results were based on information gain of
the fuzzy dataset and fuzzy entropy.
The final result was an improved classification. Decision tree classification can
be taught under the field of data mining as other courses such as operations research,
project management, etc. [12] used Microsoft excel to teach decision tree classification
algorithm by outlining a set of procedures to implement it. [13] Also adapted ID3
decision tree learning algorithm to the training set for two weeks. The ID3 was
implemented using java programming language. The result shows a classified decision
tree and decision rules.
3. Methodology
The methods used in the analysis, design and development of the proposed
system are as follows: data gathering, profitability model/analysis, data mining analysis
tool and classification model using ID3 decision tree learning algorithm. While
jQuery, PHP, JavaScript, HTML and MySQL web programming languages were used
3.1 Data Gathering
This research work gathers data using structured questionnaire technique and
personal observation of the existing system in order to understand the correct
workflow process.
3.2 Profitability Model
Profitability model or analysis is the linear, deterministic algebraic model used
implicitly to determine the profit earned in a business, starting with profit equals sales
minus costs; it provides a structure for modeling cost elements such as materials,
losses, multi-products, learning, depreciation etc. It also provides a mutable
conceptual base for spreadsheet modelers. The basic profit model is sales minus costs.
Sales are made up of quantity sold multiplied by their price. Costs are usually divided
between fixed costs and variable costs.
From our variable definition above:
tp = ts – (tcs + toe)
Where:
Table 1: Tabular Representation of Sample data collected from proposed taxpayers
S/N Business Name Service acc cs aoe sa Tax
amount/month
Location
1 Kenny Barbers shop Barbing 15 120 50 400 5,000 GRA Area
2 Mekus Barber International Barbing 22 100 45 350 5,000 Ekewan Area
3 Sir Moris Saloon Barbing 17 140 45 300 4,500 Ugbowo Area
4 Excite Barbers Barbing 15 110 40 300 4,000 Ugbowo Area
5 Yuppies Beauty Salon Barbing 10 100 50 300 3,000 Uselu Area
6 Double twins Plaza Barbing 20 70 40 300 3,500 Ugbowo Area
7 Willmaz barber shop Barbing 25 160 80 350 5,000 Ugbowo Area
8 Manners Wilmas Stores Barbing 25 70 50 300 2,500 Uselu Area
9 Kome and Kome Barbers Barbing 15 80 50 350 2,500 Uselu Area
10 Fantastic Barbers Barbing 30 150 120 500 5,000 GRA Area
11 Daniels cute Barbing 15 200 120 500 5,000 GRA Area
12 OsasAmas Mighty Barbing 20 120 100 450 5,000 Ekewan Area
Applying the profitability model to the data in Table 1 considering the first
three business outfits (Kenny, Mekus and Sir Moris barbing salon); the profit of each
shop will be determined as shown below.
Kenny Barbers shop
ts = sa xacc ts = 400 x 15
ts = N6,000.00 daily tcs = cs xacc
tcs = 120 x 15
tcs = N1,800.00 daily toe = aoe xacc toe = 50 x 15 toe = N750.00 daily tp = ts – (tcs + toe) where
thus,
tp = 6000– (1800 + 750) tp = 6,000 – 2,550 tp = N3,450.00 daily
Mekus Barbers International
ts = sa xacc ts = 350 x 22
ts = N7,700.00 daily tcs = cs xacc
tcs = 100 x 22
tcs = N2,200.00 daily toe = aoe xacc toe = 45 x 22 toe = N990.00 daily tp = ts – (tcs + toe)
Where
ts = 7,700 tcs = 2,200 toe = 990
thus,
tp = 7700 – (2200 + 990) tp = 7700 – 1210
tp = N6,490.00 daily
Sir Morris Salon
ts = sa xacc ts = 300 x 17
tcs = 140 x 17
tcs = N2,300.00 daily toe = aoe xacc toe = 45 x 17 toe = N765.00 daily tp = ts – (tcs + toe)
where
ts = 5,100 tcs = 2,300 toe = 765
thus,
tp = 5,100 – (2,300+ 765) tp = 5,100 – 1,535
tp = N3,565.00 daily
Again, considering the first three tax payers’ from table 1 in different areas;
the table 2a was deduced.
Table 2a: Tax payers table with estimated profit per day
S/N Business Name Customer Count
Estimated Profit/day(NGN)
No of days’ work/Month
Estimated
Profit/Month(NGN) 1 Kenny Barbers
shop
15 3,450 24 82,800
2 Mekus Barber International
22 6,490 24 155,760
3 Sir Moris Saloon
Table 2b: Government Approved Tax Rate Guild
Tiers Tax Rate (%) Profit Earned (NGN) Tax Amount (NGN)
T1 5 0 -30,000 0 – 1,500
T2 10 30,001 – 50,000 3,001 – 5,000
T3 15 50,001 – 110,000 7,500.15 – 16,500
T4 20 110,001 – 160,000 22,000.22 – 32,000
T5 25 Above 160,000 40,000.25 -
Table 2c shows the state government approved tax rate guild which is
segmented into 5 tiers based on tax rate percentage, profit earned range and tax
amount. Applying this approved tax rate guild in table 2b to table 2a, the table 2c was
deduced.
Table 2c: Taxpayer table with Initial tax amount and Actual Tax Amount
S/N Business Name Estimated
Profit/Month(NGN)
Tier Initial Tax amount (NGN)
Proposed Tax amount (NGN) 1 Kenny Barbers
shop
82,800 T3 5,000 12,420
2 Mekus Barber International
155,760 T4 5,000 31,152
3 Sir Moris Saloon
85,560 T3 4,500 12,834
Figure 1: Graphical Representation of Table 2c
0
10
20
30
40
KB
MB
SMB
Figure 1 shows a graphical representation of table 2c. The parameters of the
graph on vertical axis are the initial tax amount, which is plotted against the proposed
tax amount on the horizontal axis as indicated in the graph using blue and purple
color code.
KB denotes Kenny barbers
MB denotes Mekus Barbers
SMB denotes Sir Morris Barbers
The amount is in thousands of Naira. (‘000)
Figure1 also shows the difference in tax amount between the initial tax
amount and the proposed or actual tax amount. This reveals that some tax payers are
under paying tax because of the existing unstructured way of collecting these taxes
thereby defrauding the government unknowingly.
3.3 Data Mining
Data mining could also be seen as data cleansing or data scrubbing. This
concept involves the searching and removal of noise, incomplete, missing and
irrelevant data from a dataset and then formatting the refined data according to the
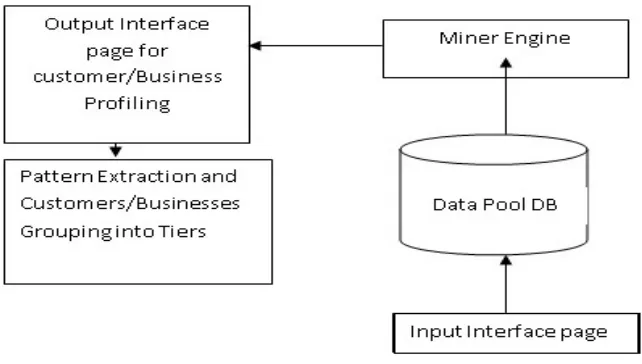
Figure 2: Proposed Data Miner Extractor Architecture
3.4 Classification Model
This is a systematic approach of building classification algorithm from an
input data set. Grouping taxpayers businesses into tiers; the active variables required
are profit earned and customer count. The technique of classification model used in
this research work is the Decision Tree Model. The ID3 decision tree learning
algorithm is adapted to classify taxpayer’s business into various tiers. The model is
expressed mathematically as:
Entropy (B) = -p(C) log2 p(C)
Where: p(C) is the proportion of B belonging to class C is over tp.
Gain (B, A) is information gain of sample set B on attribute A is defined as
Recall: the active variables required are the profit earned and customer count.
The profit earned in any of the business is analyzed and determined by the
profitability model. If the profit earned is zero (0) or negative then such business
cannot be classified into any tier because it is seen as not viable.
Table 3: Classes of Tiers
Classes TP (NGN)
Tier1 0 -30,000
Tier2 30,001 – 50,000
Tier3 50,001 – 110,000
Tier4 110,001 – 160,000
Tier5 Above 160,000
3.4.1 ModifiedID3 Decision Tree Algorithm for Tax Payers’ Classification /* ID3 Decision tree algorithm for tax payers classification*/
/* Parameters use to represent variable in the algorithms are
B -> Set of Business sample
T -> Set of Tiers. In this research work T is definite. (t1, t2, … t5) - i.e. T == 5)
TP -> Set of Total Profit sample from B
tp -> actual total profit for a given business b.
Recall that the defined attributes for classifying into classes (Tiers) are:
*/
PROCEDURE MAIN BEGIN
; Upload sample dataset B from taxpayer table in emma_phd database for classification
using ID3 algorithm;
STEP 1: If (all instances in TP are positive)
// using Entropy (information gain) expressed as
{
Where: p(C) is the proportion of B belonging to class C is over tp.}
Gain (B, A) is information gain of sample set B on attribute A is defined as
Gain (B, A) = Entropy (B) - ((|Bv| / |B|) * Entropy(Bv))
Then
{
Classification exists;
Classify into tier
}
END
If (all instances in TP are negative or zero)
then
// using Entropy expressed as
{
Entropy (B) = -p(C) log2 p(C) // all the businesses B are perfectly classified.
{
Classification does not exist;
}
END.
Function miner Engine(){
If(TP > 0)
{
Classification == 1; (Classification will take place)
If (tp<=30,000){
b == t1;
}
else{
if(tp>30,000 &&<= 50,000){
}
else
{
if (tp>50,000 &&<= 110,000){
b == t3;
}
else{
if (tp>110,000 &&<= 160,000){
b == t4;
}
else{
b == t5;
}
}
}
}
LOAD NEXT B;
end;
}
Else{
if (TP < 0){
Classification == 0; (Classification will not take place)
end;
}
Else{
if (TP == 0){
Classifications == 1;
b1, b2, …bn == t1 || t2 || t3 || t4 || t5;
end;
}
}
}
STEP 2: Partition or divide the training instances into subsets tp1, tp2, ….tpn according to value of
t.
Select * from datapool LIMIT 5;
STEP 3: Repeat the steps recursively
while (!B->EOF) {
if (B== eof){
end;
}
Else{
MoveNext();
}
}
3.4.2 Decision Tree Classification
Figure 3 depicts the decision tree classification diagram for tax payers
businesses under review in Benin City, Edo State, Nigeria.
4. Results and Discussion
The following are the results from the research work: (1) data can be cleansed
properly using the miner extractor (2) profits can be computed automatically and
correctly using the profitability module (3) tax payers can be classified automatically
without issues, and these are depicted in figures 4, 5, 6a, 6b, 7 and 8 respectively in
order to control fraudulent tax activities.
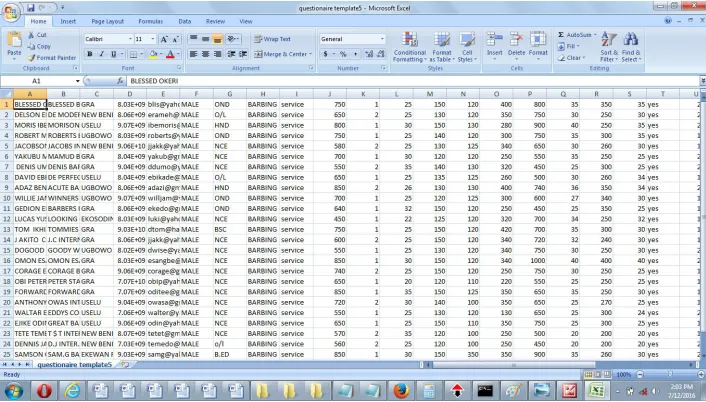
Figure 4: Sample tax payers’ data in Microsoft Excel format
Figure 4 shows the tax payers’ raw data from the questionnaire captured using
Microsoft Excel. The data is saved as Comma, Separated Value (CSV) format before
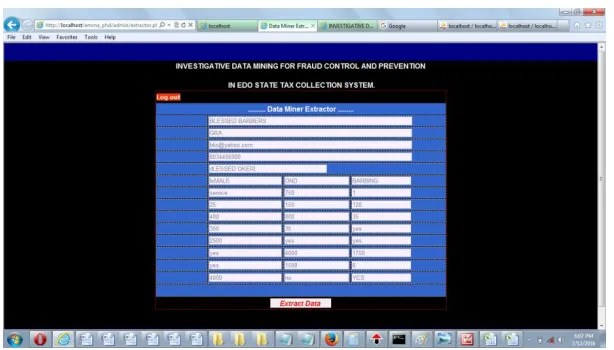
Figure 5: Screenshot of the developed Data Miner Extractor Interface
Figure 5 shows the Data Miner Extractor interface. This interface helps to
retrieve the raw data of individual business venture record uploaded before the
extraction is done.
Figure 6a: Screenshot of the developed profitability module
Figure 6a shows the snapshot of the profitability module displaying some
Figure 6b: Screenshot of the developed profitability analysis interface
Figure 6b shows the profitability analysis interface executed for a particular
business venture. The interface reveals name of the business venture, and analyzes
the following: cost of service, average operating cost, total revenue per day, total cost
of service per day, and total operating expenses in order to determine the daily and
monthly profit.
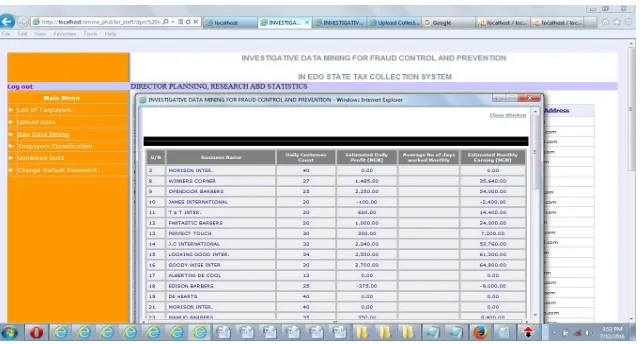
Figure 7 shows the output report as a result of the profitability computation
executed. The report reveals evidence of some business ventures estimated monthly
earning having zero, positive, and negative values respectively. It should be noted that
only the business ventures whose estimated monthly earning is having positive value
meaning the business is making profit that can be taxed and therefore classified into a
particular tier.
Figure 8: Screenshot of list of tax payers report classified into tiers
Figure 8 displays a report of list of tax payers classified into various tiers
which is based on their monthly earnings.
5. Conclusion
This research work provides a detailed study for the need to develop an
automated system that could properly classify tax payers earning into tears in order to
monitor, secure, control and prevent fraudulent activities like cash suppression and
The Iterative Dichotomizer 3 (ID3) Decision Tree Learning Algorithm was to
classifier the tax payers into their proper tiers. The experiment conducted concludes
that ID3 works very well on classification problems having datasets with nominal
attribute values.
6. Recommendations
This research work on tax fraud activities monitoring and control is highly
recommended to the Edo state Board of Inland Revenue for full deployment in order
to checkmate most loopholes in the present tax collection system of the state; and
also to other states tax collection system.
7. Acknowledgments
The authors would like to specially thank and acknowledge Professor F. M.
Okoro of the Department of Mathematics, Ambrose Alli University, Ekpoma, Nigeria
for his wonderful insight throughout this research work, and the Management and
staff of Edo State Board of Inland Revenue for sharing their time, and data.
References
Quinlan, J. R. (1986). Introduction of decision trees. Machine Learning.
Seddawy, A. B., Sultan, T., and Khedr, A. (2013).Applying Classification Techniques using DID3 Algorithm to improve Decision Support System under Uncertain Situations.
International Journal of Modern Engineering Research (IJMER), Vol 3(4), pp. 2139-2146.
Hamilton, H., and Gurak, E., and Olive, F. W. Overview of Decision Trees as Published on the website
http://www.cs.uregina.cd/~dbd/cs831/notes/ml/dtrees/4_dtrees1.html Chahai, H. (2013). ID3 Modification and Implementation in Data Mining. International
Journal of Computer Applications. Vol 80(7). Pp. 16-23
Adhatrao, K., Gaykar, A., Dhawan, A., Jha, R., and Honrao, V. (2013) Predicting Students Performance using ID3 and C4.5 Classification Algorithm. International
Journal of Data Mining and Knowledge Management Process (IJDKP), Vol 3(5).
Thakar, R. G., Patel, V., and Desai, H. (2014).Predicting Movement of Stock on the Basis of Daily Fluctuation Using Data Mining. International Journal of Advanced Research in Computer Science and Software Engineering, Vol. 4(11).
Dunham, M. H. (2003). Data Mining: introductory and Advanced Topics. Pearson Education Inc.
Bhatt, H., Mehta, S., and D’mello, L. R. (2015). Use of ID3 Decision Tree Algorithm for Place Prediction. International Journal of Computer Science and Information Technologies, Vol. 6(5).Pp 4785-4789.
Mathur, N., Kumar, S., Kumar, S., and Jindal, R. (2012).The Base Strategy for ID3 Algorithm of Data Mining Using Havrda and Charvat Entropy Based on Decision Tree. International Journal of Information and Electronics Engineering, Vol. 2(2), pp. 253-258.
Suryawanshi, R. D., and Thakore, D. M. (2012).Decision Tree Classification Implementation with Fuzzy Logic, International Journal of Computer Science and Network Security, Vol. 12(10).pp 93-97
Ataman, K., Kulick, G., and Sim, T. (2011).Teaching Decision Tree Classification Using Microsoft Excel. Informs Transactions on Education, Vol. 11(3), pp. 123-131. Bhardwaj, R., and Vatta, S. (2013). Implementation of ID3 Algorithm. International
Journal of Advanced Research in Computer Science and Software Engineering. Vol. 3(6), pp. 845-851.